

Continuous cooling transformation curve of a novel Al-Cu-Li alloy
LI Hong-ying(���Ӣ), GENG Jin-feng(������), ZHENG Zi-qiao(֣����),
WANG Chang-jian(������), SU Yao(�� Ң), HU Bin(�� ��)
School of Materials Science and Engineering, Central South University, Changsha 410083, China
Received 21 December 2005; accepted 8 June 2006
Abctract: An effective method of measuring continuous cooling transformation(CCT) curve is studied. Corresponding to different cooling rate range, the different measurement methods are employed. The phase-transformation temperatures at slow cooling rate are determined by differential thermal analysis(DTA). The phase-transformation temperatures at medium cooling rate are obtained by measuring a ratio of resistance change against temperature. The phase-transformation temperatures at high cooling rate are measured with thermal mechanical simulator and X-ray diffractometer. Mechanical property combined with microstructure of the samples at various cooling rates is studied and the CCT curve of the alloy is constructed. When the cooling rate increases, phase- transformation temperature drops and the quantity of the secondary phase decreases. The solid solution strengthening is the leading strengthening mechanism during the quench and the hardness increases with the increase of the cooling rate.
Key words:
Al-Cu-Li alloy; CCT curve; phase transformation; strengthening mechanism;
1 IntroductionAl-Li alloy is perspective for wide applications in aircraft industry. It has an attractive combination of medium strength with good plasticity, fracture toughness, corrosion resistance and weldability[1-3]. Continuous cooling transformation(CCT) curves of Al-Li alloy are beneficial to the selection of quenching and aging regimes. However, there is not much information available yet.
Generally, there are two types of time��temperature transformation curves for alloys, i.e. isothermal transformation(IT) curve and CCT curve. These curves contain important information of phase-transformation behavior of alloys. There are many CCT curves available for steels. However, there are only a few IT curves for aluminum alloys[4] and these curves are not suitable for continuous cooling process such as quenching[5]. On the other hand, most of these curves were constructed with indirect methods, such as corrosion or strength test. It was FINK and WILLEY who first attempted to describe the effect of quenching on the properties of aluminum alloys. Utilizing isothermal quenching techniques, they developed C-curves for strength of 7075-T6 and corrosion behavior of 2024-T4[6]. Since then the concept of time��temperature property(TTP) has been applied to different alloys. For example, DAVYDOV et al[7, 8] obtained IT and TTP curves of aluminum alloy for studying quench sensitivity and aging temperature range. ARCHAMBAULT and GODARD[9] studied high temperature precipitation kinetics and determined the IT curve of a 7XXX alloy by in-situ electrical resistivity measurements and differential resisitivity calorimeter.
The CCT curves are important for heat treatment of aluminum alloys because they provide information about the required quenching rate. HERDING et al[10] have measured CCT curves of aluminum alloys using a differential scanning calorimeter(DSC) at cooling rates of 5 to 475 ��/min, but these results are too simple and not applicable to the manufacturing of the alloy.
In this study, we present resistance test results obtained by in-situ measurement during continuous cooling and demonstrate the potential of the method for characterizing the precipitation process of the secondary phases. By differential thermal analysis(DTA), TEM analysis, X-ray diffraction analysis and hardness test, we will obtain phase-transformation temperatures and construct the CCT curve of a novel Al-Cu-Li alloy.
2 ExperimentalThe material used in this study is a novel Al-Cu-Li alloy designed referred to 2195 alloy and 2197 alloy. The samples were cut into rectangles (50 mm![]() 10 mm
10 mm![]() 4.5 mm) after forging and drawing. Solution treatment was performed at 520 �� for 30 min prior to cooling at different rates. The phase-transformation temperatures were determined by three different methods. 1) In the cooling rate range of 0.08-0.33 ��/s, the phase- transformation temperatures were measured by DTA. 2) When the samples cooled down in the range of 1.2-18 ��/s, the phase-transformation temperatures were obtained by the continuous testing of resistance. A novel computer-controlled electrical resistance measurement system was designed and constructed for studying phase transformations by in-situ measurements under continuous cooling. The system consists of (a) a heat chamber; (b) a cooling assembly designed to quench the sample at a predetermined rate; (c) double bridge and thermocouples attached to the sample; and (d) hardware and the software for data acquisition and analysis. 3) For higher cooling rate, we use thermal mechanical simulator to achieve the rapid cooling rate. The samples were solution treated at 520 �� for 30 min, then cooled to the pre-set temperatures at a cooling rate of 30 ��/s, 50 ��/s or 70 ��/s, respectively, and followed by water quenching. X-ray diffraction was performed on the Rigaku D/max 2500 X-ray diffractometer, and MDI Jade 6.5 software was used to analyze the phase information. The phase-transformation temperatures were obtained by comparing X-ray diffraction results.
4.5 mm) after forging and drawing. Solution treatment was performed at 520 �� for 30 min prior to cooling at different rates. The phase-transformation temperatures were determined by three different methods. 1) In the cooling rate range of 0.08-0.33 ��/s, the phase- transformation temperatures were measured by DTA. 2) When the samples cooled down in the range of 1.2-18 ��/s, the phase-transformation temperatures were obtained by the continuous testing of resistance. A novel computer-controlled electrical resistance measurement system was designed and constructed for studying phase transformations by in-situ measurements under continuous cooling. The system consists of (a) a heat chamber; (b) a cooling assembly designed to quench the sample at a predetermined rate; (c) double bridge and thermocouples attached to the sample; and (d) hardware and the software for data acquisition and analysis. 3) For higher cooling rate, we use thermal mechanical simulator to achieve the rapid cooling rate. The samples were solution treated at 520 �� for 30 min, then cooled to the pre-set temperatures at a cooling rate of 30 ��/s, 50 ��/s or 70 ��/s, respectively, and followed by water quenching. X-ray diffraction was performed on the Rigaku D/max 2500 X-ray diffractometer, and MDI Jade 6.5 software was used to analyze the phase information. The phase-transformation temperatures were obtained by comparing X-ray diffraction results.
3 Results and discussion
3.1 Determination of critical temperature
To obtain the critical temperature, the samples were heated at different temperatures for 30 min, water quenched, and then the hardness of the samples were measured. The critical temperature was determined as 480 �� according to harness vs temperature curve.
3.2 Measurement of phase-transformation tempera- ture
Three DTA curves were obtained on differential thermal analyzer, where the samples were cooled down at the cooling rate of 0.08 ��/s, 0.17 ��/s and 0.33 ��/s, respectively. When there is no second phase precipitated, the DTA curve will be the horizontal line. Once the second phase precipitates, exothermal reaction will occur and the inflection point will appear on the curve. It can be inferred that the onset temperatures of phase transformation are 472, 460 and 450 ��, corresponding to cooling rate of 0.08, 0.17 and 0.33 ��/s, respectively.
When the samples were cooled down at the cooling rates of 1.2, 2.4, 4.2, 7.8, 9.5, 11, 14.7 and 18 ��/s, respectively, the ratio of resistance change against temperature were measured. Fig.1 shows the relationship of the ratio of resistance change against temperature at the cooling rate of 18 ��/s. The abscissa axis is the ratio of resistance change [(RT-R0)/ R0], where R0 is the resistance at 520 �� and RT is the measured resistance at various temperatures.
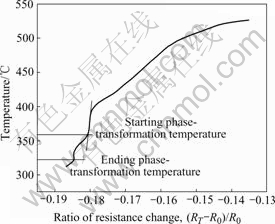
Fig.1 Ratio of resistance change against temperature
The ratio of resistance change of the alloy decreases smoothly with the decrease of temperature. But, once the precipitates of secondary phase appear, the ratio of resistance change decreases suddenly[11]. The phase- transformation temperature is measured by fitting tangent on ratio of resistance change against temperature. The tangent point is the onset of the precipitation process. It can be seen from Fig.1 that the ratio of resistance change decreases suddenly, when the samples are cooled to 356 ��. So the onset temperature of the precipitation process can be determined to be 356 ��. The curve in the temperature range of 356-321 �� differs from other parts, so the temperature range can be seen as phase- transformation temperature range. As a result, it can be inferred that the ending temperature should be 321 ��.
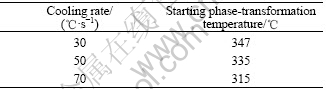
It is known that the phase-transformation temperature decreases with the increase of the cooling rate. The starting temperature of the precipitation process at the cooling rate of 18 ��/s is 356 ��. When the sample is cooled down at the rate of 30 ��/s, 50 ��/s and 70 ��/s, the phase-transformation temperatures are determined to be about 347 ��, 335 �� and 315 ��, respectively. For the example of 30��/s, Fig.2 shows the comparison of X-ray diffraction spectra for the samples cooled to 357 ��, 347 �� or 337 �� respectively, and followed by water quenching. We can see that there is no precipitation phenomenon at 357 ��, and there is a small amount of Al2CuLi (T1) and Al3Li (�ġ�) at 347 ��. While, there are more precipitates including Al2CuLi and Al3Li at 337 ��. We then determine the onset temperature of the precipitation process to be 347 ��. Similarly, the onset temperature of the precipitation is 335 �� at the cooling rate of 50 ��/s and 315 �� at 70 ��/s, respectively.
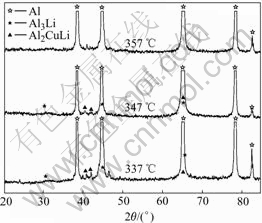
Fig.2 Comparison of X-ray diffraction spectra of samples as function of temperature at cooling rate of 30 ��/s
3.3 Hardness measurement
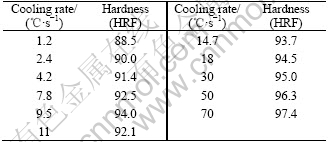
The Rockwell hardness of the samples cooled to room temperature at various cooling rates was measured and the results are listed in Table 1. It can be seen that the hardness increases with the cooling rate. Inaccuracy of hardness is less than 2[12].
Table 1 Rockwell hardness of sample cooled down at various cooling rates
3.4 Amendment of phase-transformation temperature
In order to amend phase-transformation temperature, the sample was solution treated at 520 �� for 30 min and cooled to the given temperatures prior to water quenching. The given temperatures were set at the phase-transformation temperature and 10 �� above and below it, respectively. X-ray diffraction analysis and TEM analysis were used to compare the formation and the quantity of the phases and determine the phase- transformation temperature.
As described above, when the sample was cooled down at the cooling rate of 18 ��/s, the phase- transformation starts at 356 �� and ends at 321 �� according to the measurement of the ratio of resistance change against temperature curve. Figs.3 and 4 show the results of X-ray diffraction spectra where the samples were solution treated at 520 �� for 30 min and cooled to 366 ��, 356 ��, 346 �� and 331 ��, 321 ��, 311 ��, respectively, then followed by water quenching.
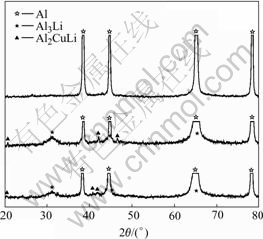
Fig.3 XRD spectra of samples cooled to 366 ��, 356 �� and 346 ��, respectively
The X-ray diffraction analysis shows that there are no precipitates at 366 ��. However, it is well known that the XRD analysis is inefficient when the amount of the precipitates is small. TEM image of sample cooled to 366 �� is shown in Fig.5. We can see that there are no secondary phases in the TEM image and SAD pattern. So, the starting temperature of precipitation can be determined to be 356 ��. It can be seen in Fig.4 that the amount of �� �� and T1 phases precipitating at 321 �� is larger than that at 331 ��. When the sample is cooled to 311 ��, the amount of the precipitates is similar to that at 321 ��. It can be seen when the sample is cooled to room temperature, the amount of the precipitates is similar to that at 311 ��. Therefore, the ending temperature of precipitation process should be determined as 311��. The phase-transformation temperatures at different cooling rates are listed in Table 2, Table 3 and Table 4.
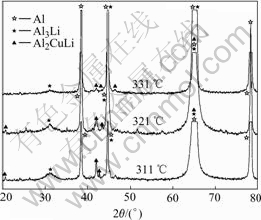
Fig.4 XRD spectra of samples cooled to 331 ��, 321 �� and 311 ��, respectively
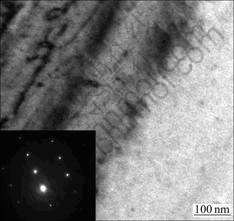
Fig.5 TEM image and selected area diffraction (SAD) pattern of sample cooled to 366 ��
Table 2 Phase-transformation temperatures at slow cooling rate
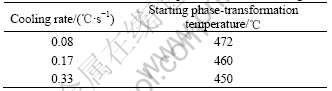
Table 3 Phase-transformation temperatures at medium cooling rate
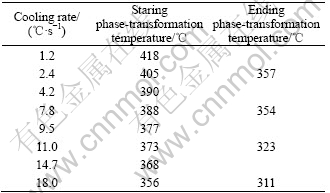
Table 4 Phase-transformation temperatures at high cooling rate
3.5 Analysis and plotting of CCT curve
The phase-transformation temperatures listed in Table 2, Table 3 and Table 4 are plotted in the half-logarithmic coordinate of temperature��time plot, and these points are then joined smoothly. The constructed CCT curve is shown in Fig.6. The numbers beside the cooling curve are the cooling rate and those below the cooling curve are the values of Rockwell hardness. �� phase here substitutes for the secondary phase, such as Al2CuLi and Al3Li.
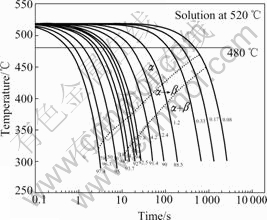
Fig.6 CCT curve of novel Al-Cu-Li alloy
From the CCT curve we can see that when the cooling rate increases, the phase-transformation temperature drops and the incubation period is shortened. It can also be seen that there are no nose part, so the critical cooling rate can not be obtained. This may be attributed to insufficient cooling rate used here or it is due to the precipitation characteristics of the Al-Cu-Li alloy. The precipitation of Al-Cu-Li alloy is typical diffusion transformation. When the cooling rate is increased, the driving force for transformation is also improved, so the incubation period is shortened. However, with increase of the cooling rate, the diffusion ability of the atom in solid solution will decrease. So the precipitation will be restrained and the CCT curve shown in Fig.6 is only the part of the C-shape.
3.6 Microstructure observation
Figs.7-9 show the TEM microstructures of specimens cooled at the cooling rate of 1.2 ��/s, 9.5 ��/s and 18 ��/s, respectively.
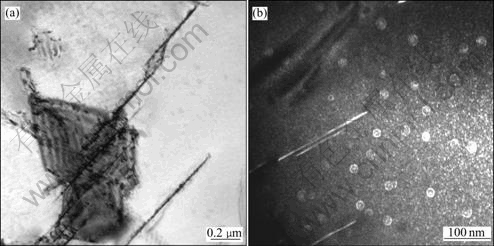
Fig.7 TEM microstructures of specimens cooled down at cooling rate of 1.2 ��/s: (a) Bright field micrograph of T1 phase; (b) Dark field micrograph of �ġ� phase
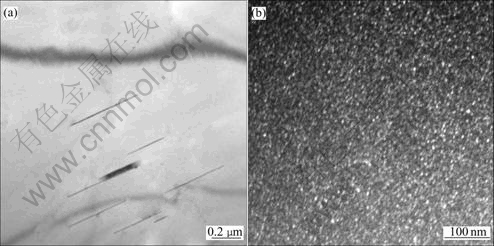
Fig.8 TEM microstructures of specimens cooled down at cooling rate of 9.5 ��/s: (a) Bright field micrograph of T1 phase; (b) Dark field micrograph of �ġ� phase
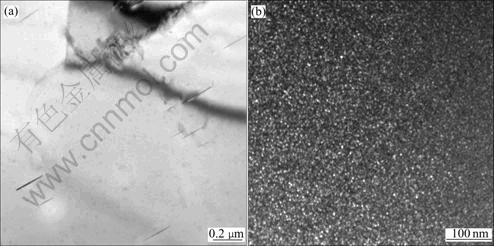
Fig.9 TEM microstructure of specimens cooled down at cooling rate of 18 ��/s: (a) Bright field micrograph of T1 phase; (b) Dark field micrograph of �ġ� phase
When the sample is cooled at the cooling rate of 1.2 ��/s, we can see coarse acicular T1 phases precipitated in Fig.7(a). There is large amount of spherical compound phases Al3Li/Al3Zr and microsize spherical �ġ� phase precipitated, meanwhile we can find that there are �ġ� phases precipitated along the T1 phases in Fig.7(b). When the cooling rate is increased, finer precipitates can be observed in Fig.8 and Fig.9. The X-ray diffraction analysis was used to identify the precipitates and the results for the specimens cooled at the cooling rate of 1.2 ��/s, 9.5 ��/s and 18 ��/s, respectively are shown in Fig.10.
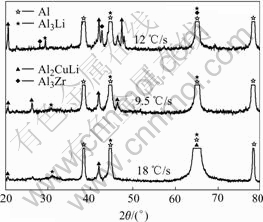
Fig.10 XRD spectra for specimens cooled at cooling rate of 1.2 ��/s, 9.5 ��/s and 18 ��/s
It can be seen in Fig.10 that when the samples are cooled down at different rates, the main secondary phases are T1 and �ġ�. From the X-ray diffraction analysis and microstructure observation, we can find that the quantity of the secondary phase decreases with the increase of cooling rate and the secondary phase is fine and dispersed. Compared with the precipitates during ageing process, the volume fraction of the precipitates during quench is low. So, the alloy maintains higher solid solubility and solid solution strengthening is the leading strengthening mechanism during the quench. It can be inferred that the more rapid the cooling rate, the higher the solid solubility. Furthermore, fine and dispersed precipitates also help to increase the strength. As the result, the hardness increases with the increase of the cooling rate.
Resistivity measurement has been employed to characterize the precipitation processes in aluminum alloys[13,14]. However, most of those studies were devoted to aging and the resistivity was measured after the heat treatment[15]. In order to overcome the problem, we measured the ratio of resistance change by in-situ measurement and do not consider the absolute value of resistance. The phase-transformation temperatures during continuous cooling can be obtained by the ratio of resistance change against temperature. By studying the phase transformation behavior of alloys, CCT curve can be constructed and used as reference for the right selection of quenching and ageing regimes.
4 Conclusions1) An effective measurement method to obtain CCT curve is developed in combination with the X-ray phase analysis, TEM analysis and resistance test. And, the CCT curve of a novel Al-Cu-Li alloy is measured.
2) When the cooling rate increases, phase- transformation temperature drops and the incubation period shortens. Meanwhile, the quantity of the secondary phase decreases with the increase of cooling rate and the secondary phase is fine and dispersed.
3) The solid solution strengthening is the leading strengthening mechanism during the quench and the hardness increases with the increase of the cooling rate.
Acknowledgements
The authors would like to acknowledge the financial support of the State Laboratory for Advanced Metals and Materials, and the instruction from Dr ZHENG Feng, Dr JIANG Xian-liang, Dr LIU Li-bin and Dr LI Zhi-cheng. The state laboratory for advanced metals and materials.
References[1] YIN Den-feng, ZHENG Zi-qiao. History and current status of Al-Li alloy research and development [J]. Materials Review, 2003, 17(2): 18-20. (in Chinese)
[2] YANG Yun-chun. Development and applications of Al-Li alloys [J]. Aerospace Materials and Technology, 1997, 1: 7-10. (in Chinese)
[3] YANG Shou-jie, LIU Zhong, SU Bing, DAI Sheng-long. Development of Al-Li alloys [J]. Journal of Material Engineering, 2001, 5: 44-47. (in Chinese)
[4] VANDER G F. Atlas of Time-Temperature Diagrams for Nonferrous Alloys [M]. ASM International, USA, 1991.
[5] STALEY J T. Quench factor analysis of aluminum alloy [J]. Materials Science and Technology, 1987, 3: 923-933.
[6] EVANCHO J W, STALEY J T. Kinetics of precipitation in aluminum alloys during continuous cooling [J]. Metallurgica Transactions, 1974, 1(5): 43-48.
[7] DAVYDOV V G, BER L B, KAPUTKIN E Y. TTP and TTT diagrams for quench sensitivity and ageing of 1424 alloy [J]. Materials Science and Engineering, 2000, A280: 76-82.
[8] DAVYDOV V G, BER L B. TTP and TTT ageing diagrams of commercial aluminum alloys and their use for ageing acceleration and properties improvement [J]. Materials Science Forum, 2002, 396-402: 1169-1174.
[9] ARCHAMBAULT P, GODARD D. High temperature precipitation kinetics and TTT curve of a 7xxx alloy by in-situ electrical resistivity measurements and differential calorimetry [J]. Scripta Mater, 20004, 2(7): 675-680.
[10] HERDING T H, KESSLER O, HOFFMANN F. An approach for continuous cooling transformation (CCT) diagrams of aluminum alloys [J]. Materials Science Forum, 2002, 396-402: 869-874.
[11] Metal Association of China, Nonferrous Association of China. Physical Property and Testing of Metal (The First Volume) [M]. Beijing: The Publishing Company of Metallurgy Industry, 1987. (in Chinese)
[12] HAN De-wei. Handbook of Measuring of Metallic Hardness [M]. Changsha: The Publishing Company of Central South of University, 2003. (in Chinese)
[13] ROBINSON J S, CUDD R L, TANNER D A, et al. Quench sensitivity and tensile property inhomogeneity in 7010 forgings [J]. Journal of Materials Processing Technology, 2001, 119: 261-265.
[14] VEERARAGHAVAN D, VASUDEVAN V K. Phase tranformations in two-phase TiAl/Ti3Al alloys during continuous heating and cooling, studied by electrical resistivity measurements [J]. Materials Science and Engineering, 1995, A192-193: 950-956.
[15] WEI B C, CHEN C Q, GU Y J, HUANG Z, ZHANG Y G. Mechanism of nucleation and precipitation in Li containing Al-Zn-Mg-Cu alloys [J]. Materials Science Forum, 2003, 331-337: 1061-1065.
Corresponding author: LI Hong-ying; Tel: +86-731-8836328; E-mail: Lhying@mail.csu.edu.cn
(Edited by YANG Bing)
