
J. Cent. South Univ. (2012) 19: 1370-1376
DOI: 10.1007/s11771-012-1152-9![]()
Energy saving effect of building envelope in summer
WANG Hou-hua(����)1, 2, GUO Rui(����)1, 2, XIAO Qiu-lian(����)1, 2
1. Key Laboratory of The Three Gorges Reservoir Region��s Eco-Environment of Ministry of Education,
Chongqing University, Chongqing 400045, China;
2. Faculty of Urban Construction and Environmental Engineering, Chongqing University,Chongqing 400045, China
? Central South University Press and Springer-Verlag Berlin Heidelberg 2012
Abstract:
To explore the energy saving effect of building envelope, the experiments were carried out through a comparison of basic cubicle in summer. Experiments show that if energy efficiency measures are applied only in the external walls and windows, the energy saving cubicles have an average energy efficiency ratio of 27.75% and 27.05% when the air change rates are 1.1 and 1.4 h-1 in summer, with both values being over the standard target value by 25%. And the indoor air temperature of the energy saving cubicle is below that of the basic cubicle. The daily mean temperature difference between the interior surface of insulation wall and no insulation reaches 1.47 ��, and the mean temperature difference is up to 8.52 �� between the interior surface and exterior surface of insulating glass and single glass. The two cubicles were simulated for energy consumption using VisualDOE4.0 software under real weather conditions in summer. The results show that the mean deviation is 10.02% between experimental and simulated energy efficiency ratio. The correctness and validity of simulation results of the VisualDOE4.0 software are proved.
Key words:
building energy conservation; energy efficiency rate; thermal performance; air change rate��
1 Introduction
There are two methods to research the energy saving effect of building envelope: simulation and experiment. To study the effect of building component on building energy consumption, the simulation software is a fast, scientific and reasonable method. With its good repeatability, it can save research funds and shorten the research period. Energy consumption simulation method is adopted in the study of thermal performance requirements for residential building envelope in the Yangtze River Basin [1-2]. It��s a better approach to the actual energy consumption with experimental method to study the impact efficiency measures on building energy consumption, but it is more expensive and experiment will take much time. The experimental study of the insulation material of stone wool is presented in Ref. [3]. SOUBDHAN et al
2 Experimental cubicles, measuring methods and instruments
2.1 Experimental cubicles
Two experimental cubicles were constructed and located on the roof of a three-storey building at building environment experiment center of Chongqing University, China. The reference cubicle envelope consisted of solid clay brick and single glass, both of them were common residential building envelope in the 1980s and 1990s. The other was called energy saving cubicle, whose envelope consisted of hollow brick with external insulation and insulating glass. The insulation material was 30 mm of thick polystyrene plastic extrusion plate (XPS). Both cubicles (3.6 m��3.3 m��3 m) had the same roof and floor structure and face south (Fig. 1). Thermal parameter and structure of envelopes can be gotten from Ref. [12]. There was an opening (165 mm��165 mm) that was at the height of 2.4 m on the south and north wall of each cubicle. The south opening had a ventilator and the north had an exhaust opening. Ventilation volume of ventilator could be controlled by the voltage regulator. The gap around the ventilator was sealed by sealants.
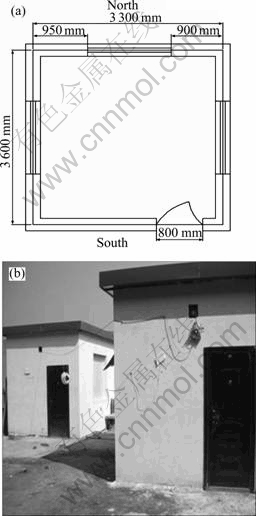
Fig. 1 Plan and elevation of room
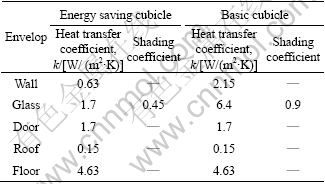
Both cubicles had the same direction of window, while the west and east windows were sealed by the material with the same thermal conductivity coefficient of the wall. The width and height of the window were 1 450 mm and 1 460 mm, respectively. The distance from the floor to the border of the window was 1 020 mm. The south door which was made of iron was 2 000 mm�� 800 mm. The two cubicles had the same heat pump air conditioner installed at the east wall. Energy saving cubicle and basic cubicle had the same window-to-wall ratio of 0.21. Table 1 presents the thermal performance of energy saving cubicle and basic cubicle envelope structure.
Table 1 Thermal parameters of energy saving cubicle and basic cubicle
2.2 Measuring methods
Parameters and measuring methods of the experiments are as follows:
1) To measure the indoor air temperature and humidity, three Tinytag data acquisition instruments were located vertically in the center of the room (1/4, 1/2 and 3/4 of the distance from the floor to the ceiling); data of temperature and humidity were collected automatically every 30 min from 8:00 to 20:00 and calculated by weighted average method.
2) To measure the outside air temperature and humidity, Tinytag data acquisition instrument was placed at a height of 2.4 m between the two cubicles and protected from rain and radiation. Outside air temperature and humidity were collected automatically every 30 min.
3) Electricity consumption and interior and exterior surface temperature of wall and window were measured and recorded every 1 h from 8:00 to 20:00. Each cubicle had an electric meter checked strictly by electrical organization and situated outside the cubicle. Thermocouples used to measure temperature were mounted on the interior and exterior surfaces of four wall directions and the north window for the two cubicles. Thermocouples were connected to potentiometer.
4) Air change rate can be obtained from the following equation:
![]() (1)
(1)
where n is air change rate, h-1; Q is the supply air volume of the ventilator, m3/h; V is the cubicle volume, m3; A is cross sectional area of the pipe, m2; u is the measuring velocity, m/s.
In order to measure the air velocity of the ventilator correctly, the velocity of outlet was measured by vane anemometer. The outlet of ventilator was connected to a length of pipe, and then connected to the vane anemometer and the pipe closely. After that, the voltage of electric regulator was adjusted to the setting value and the ventilator was started, then the wind speed at different voltages could be measured.
The ventilator had different air change rates at different voltages from experimental results in Ref. [12]. The indoor air change rates were 1.1 and 1.4 h-1 when the regulator voltages were 210 and 240 V in the summer experiments, respectively. The air conditioning operational mode was set as automatic mode, and the indoor air temperature was 26 �� in summer. Two fluorescent lamps were on for a whole day in the room, and the power of each lamp was 36 W.
2.3 Instruments
1) Tinytag data acquisition instrument was made in England, with the characteristics of high precision, high resolution (0.01��), large storage, large download speed and low power display. Temperature functional range is from -40 �� to +85 ��. Tinytag data acquisition instrument is suitable for measuring temperature and humidity of indoor and outdoor. Starting from the setting, time of readings can go on for 45 d.
2) Copper-constantan thermocouple (T-type) and potentiometer were used to measure the wall surface temperature. Reference node of the thermocouple was the ice bottle which was filled with ice water mixture, with its temperature being constantly 0 ��. The potentiometer was UJ33a type, with characteristics of high precision and high resolution. All the thermocouples were calibrated strictly before mounted, using the constant temperature water bath method. The absolute difference of reading was below 0.1 �� between thermocouple and standard thermometer.
3 Comparison and analysis of experimental and simulated results in summer
3.1 Experimental results in summer
This work includes two experiments considering different air change rates. The first went on for 8 d (from August 4th to 11th, 2010) with the indoor air change rate of 1.1 h-1 provided by the fan. The second went on for 10 d (from August 12th to 21st, 2010) with the indoor air change rate of 1.4 h-1. Table 2 presents the power consumption and daily energy efficiency rate of two rooms. Daily energy efficiency rate is calculated as
��=(E1�CE2)/E1 (2)
where E1 is the power consumption of basic cubicle during whole day, kW; E2 is the power consumption of energy saving cubicle during whole day, kW; �� is the daily energy efficiency rate.
The outdoor temperature on rainy days was lower than that on sunny day. In order to contrast and analyze experimental results, the results in lower temperature are not listed in Table 2.
Energy saving cubicle components consist of external insulation material and insulating glass. Table 2 presents the comparison results. Energy efficiency rate of energy saving cubicle is 23.7%-31.8% when indoor air temperature is constant at 26 �� and air change rate is 1.1 h-1. The average energy efficiency rate is 27.75%. Energy efficiency rate is 23.7%-31.8% when indoor air temperature is constant at 26 �� and air change rate is 1.4 h-1. The average value is 27.05% and energy saving effect is still noticeable. It should be mentioned that experiments were carried out in the hottest August in Chongqing, and the average outdoor temperature listed in Table 2 are higher than 35 �� in the test period. It can get quantitative analysis of the effect of air change rate on energy consumption from the comparability of experimental results each day. Taking energy saving cubicle for example, five-day power consumptions are 50.28 and 58.50 kW when the indoor air change rates are 1.1 and 1.4 h-1, respectively. The power consumption increases by 16.3% when the air change rate is 1.4 h-1. It is clear that building energy consumption will rise with the increase of indoor air change rate. The experimental result is consistent with theoretical one.
Table 2 Power consumption and daily energy efficiency rate of two cubicles
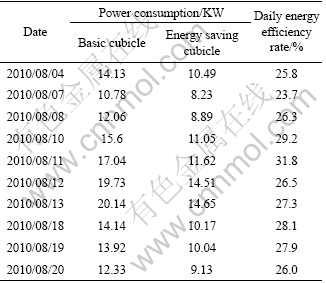
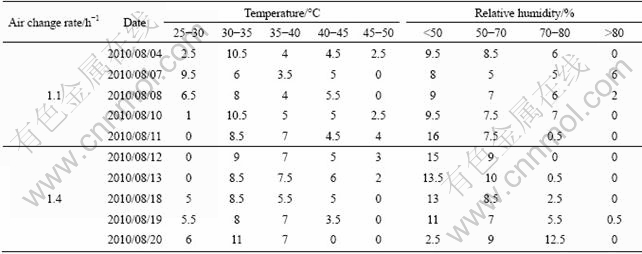
Table 3 presents the statistics under different temperatures and relative humidities during the test. Outdoor temperature section time on 10th is close to that on 11th in August, but that under relative humidity on 10th is obviously greater than that on 11th. Table 2 presents that energy efficiency rate on 10th is less than that on 11th. It can be concluded that when outdoor temperature distribution is similar, the higher the relative humidity is, the lower the energy efficiency rate will be. This is because at higher relative humidity, the greater air conditioning system will afford fresh air load. The distribution of relative humidity on 4th and that on 10th is similar (as listed in Table 3). But outdoor temperature in Table 3 and energy efficiency rate in Table 2 on 4th are lower than those on 10th. It can be concluded that when outdoor relative humidity distribution is similar, the lower the outdoor temperature is, the lower the energy efficiency rate will be. From the above analysis, it can be concluded that, for the insulating wall, when outdoor air temperature is higher and air relative humidity is lower, the energy saving effect of air conditioning system will be greater in the cubicle. For this reason, the envelope heat transfer at high temperature and low humidity area is improved, and the energy saving effect of air conditioning system becomes greater.
Table 3 Statistics times (h) at different temperatures and relative humidities distribution on test day
3.2 Comparison of experimental and simulated results in summer
In order to verify the correctness of simulation results in summer, the building model of Fig. 1 was taken as the energy consumption simulation model, which is located in Chongqing. The basic parameters of energy consumption simulation were set as follows: Outdoor meteorological data recorded for the same day were used as the outdoor meteorological parameters, air change rates were 1.1 and 1.4 h-1, indoor design temperature was 26 �� in summer, lighting load was 6.66 W/m2, and air- conditioning EER was 3.19. Thermal parameters of the building model envelopes are given in Table 1. The building model had a north window and the window to wall ratio was 0.21. The two cubicles were simulated separately for energy consumption by use of VisualDOE4.0 software. The simulation results of energy efficiency ratio can be calculated on different test days.
Figure 2 shows the comparison histogram of experimental and simulated energy efficiency ratio in summer in Chongqing. It can be seen that there are deviations between experimental and simulated energy efficiency ratio. The results show that the mean deviation is not more than 10.02%. Due to the small deviation, the simulated results are in good agreement with the experimental results. The correctness of the simulation results in summer is verified.
4 Analysis of summer experimental data
4.1 Exterior surface temperature of wall in direction of west and east
In Fig. 3, measured exterior surface temperature of wall in the direction of west and east for energy saving cubicle on August 10th in Chongqing is shown. This day is sunny. The moment when the outer surface temperature of east wall reaches its maximum temperature is about 11:00 and that of west wall is about 16:00. The exterior surface maximum temperature of east wall is lower than that of west wall. It is seen from Fig. 3 that the temperature has an intersection at about 13:00 pm between exterior surface of east wall and west wall. Exterior surface temperature of east wall is higher than that of west wall before 13:00, but it is contrary after the intersection (13:00). This could be explained by the fact that the rule of the sun rises and falls and the intensity difference of the solar radiation. Both of them lead to the exterior surface maximum temperature of east wall and west wall and the moments when the temperature reaches the maximum are different. This experimental result is in agreement with the simulated result of Ref. [13] about the comparison between exterior surface temperature of east wall and west wall in different directions. This indirectly verifies the correctness of the simulated results of Visual DOE4.0 software.
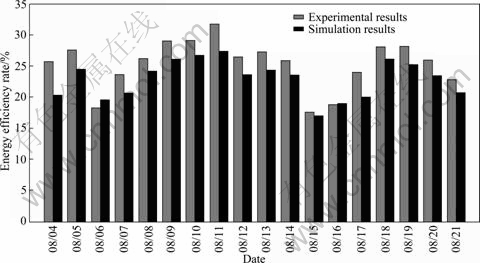
Fig. 2 Experimental and simulated energy efficiency rates from August 4th to 21st, 2010, in Chongqing
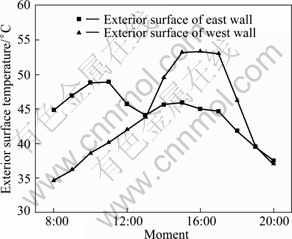
Fig. 3 Measured exterior surface temperature of east and west wall for energy saving cubicle on August 10th, 2010
4.2 Analysis of window surface temperature
Figure 4 shows the interior and exterior surface temperature variations of the window for the two rooms measured on August 4th. It can be seen that the temperature difference between interior surface and exterior surface of insulation glass at the energy saving cubicle is higher than that of single glass at the basic cubicle. The calculation shows that the mean temperature difference is up to 9.73 �� between interior surface and exterior surface of insulating glass, while the corresponding one is just 1.21 �� between interior surface and exterior surface of single glass. It is concluded that single glass almost does not have insulating capacity. The deviation of mean temperature difference is up to 8.52 �� between the two kinds of glasses. This could be attributed to the fact that the window glass is insulating glass in the energy saving cubicle and the thermal resistance of insulating glass is higher than that of single glass.
It can also be seen in Fig. 4 that the interior surface temperature and temperature fluctuation range of insulating glass in the energy saving cubicle are much lower those of in the basic cubicle. Consequently, using insulating glass, indoor thermal radiation can be reduced greatly and building energy consumption can also be decreased effectively. And with the improvement of the indoor thermal environment, indoor thermal comfort can be improved.

Fig. 4 Measured exterior and interior surface temperatures of north window for two rooms on August 4th, 2010
4.3 Temperature difference of interior and exterior surface of wall
Figure 5 shows the inside and outside measured temperatures of west wall for the two rooms on August 7th. It can be seen that compared to the basic cubicle, interior surface temperature of external wall is much lower and exterior surface temperature of external wall is much higher in the energy saving cubicle. The calculation shows that the maximum temperature difference is 3.95 �� between the interior surface of insulation wall and without insulation. The daily mean temperature difference is 1.47 �� between the interior surface of the insulation wall and without insulation. Experiments show that for the region of Chongqing, which is located in the upper and middle Yangtze River Basin, using external insulation wall not only can reduce building energy consumption effectively, but also can improve indoor thermal comfort greatly in summer. Taking into consideration the same sense of thermal comfort in a room, this can get the energy saving effect improved through increasing indoor air temperature appropriately in the energy conservation building with insulation measures. The results are completely accordant with simulated results in Ref. [13].
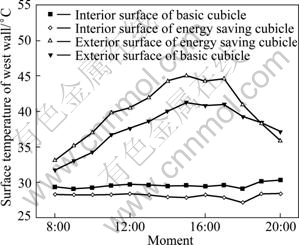
Fig. 5 Measured interior and exterior surface temperature for west wall on August 7th
4.4 Comparison of indoor air temperature
Figure 6 shows indoor air temperatures for the two rooms on August 10th. Although the indoor air temperature in the two cubicles was set at 26 �� during the experiment period, the temperature in the energy saving cubicle is below that in the basic cubicle. The difference of indoor air temperature, on average, is up to 0.3 �� between energy saving cubicle and basic cubicle. This is consistent with the measured results that interior surface temperature in the energy saving cubicle is below that in the basic cubicle in summer.
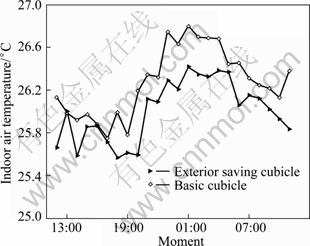
Fig. 6 Measured indoor air temperature for two cubicles on August 10th, 2010
5 Conclusions
1) Experiments show that the average energy efficiency rate of energy saving cubicle is greater than 27% in summer. They also show that if energy saving measures are applied only in the external walls and windows, energy efficiency ratio can meet the standard target that enclosures undertake 25% of the energy saving demand.
2) The results on the exterior surface maximum temperature are completely consistent with the simulation results. Besides, the mean deviation between experimental energy efficiency rate and simulated energy efficiency rate are not more than 10.02%. All data verify the correctness of simulation results of the VisualDOE4.0 software.
3) With the improvement of thermal performance of building envelope and the decrease of limit value of envelope heat transfer coefficient, it can improve energy efficiency rate of building in the high temperature and low humidity area in summer. The smaller the indoor air change rate, the greater the energy efficiency rate of building envelope.
4) Both of the interior surface temperature and indoor air temperature in the energy saving cubicle are lower than those in the basic cubicle. Based on these characteristics, when maintaining the same indoor thermal comfort and increasing indoor air conditioning temperature in the energy conservation building appropriately, this can make energy efficiency ratio increase by 8%-10%.
5) Experiments show that insulating measures of wall make a positive effect on energy saving effect in summer in Chongqing.
References
[1] WANG Hou-hua, ZHUANG Yan-yan, WU Wei-wei. Energy saving analyses on envelope thermal properties in hot summer and cold winter region [J]. Journal of Tongji University, 2010, 38(11): 1641-1646. (in Chinese)
[2] WANG Hou-hua, ZHUANG Yan-yan, WU Wei-wei. Residential building thermal performance energy efficiency in Yangtze River Basin [J]. Journal of Central South University of Technology, 2009, 16(S1): 159-165.
[3] KARAMANOS A, HADIARAKOU S, PAPADOPOULOS A M. The impact of temperature and moisture on the thermal performance of stone wool [J]. Energy and Buildings, 2008, 40(8): 1402-1411.
[4] SOUBDHAN T, FEUILLARD T, BADE F. Experimental evaluation of insulation material in roofing system under tropical climate [J]. Solar Energy, 2005, 79(3): 311-320.
[5] SWINTON M C, MAREF W, BOMBERG M T, KUMARAN M K, NORMANDIN N. In situ performance evaluation of spray polyurethane foam in the exterior insulation basement system (EIBS) [J]. Building and Environment, 2006, 41(12): 1872-1880.
[6] NUSSBAUMER T, GHAZI WAKILI K, TANNER C. Experimental and numerical investigation of the thermal performance of a protected vacuum-insulation system applied to a concrete wall [J]. Applied Energy, 2006, 83(8): 841-855.
[7] CABEZA L F, CASTELL A, MEDRANO M, MARTORELL I, P?REZ G, FERN?NDEZ I. Experimental study on the performance of insulation materials in Mediterranean construction [J]. Energy and Buildings, 2010, 42(5): 630-636.
[8] SERRA V, ZANGHIRELLA F, PERINO M. Experimental evaluation of a climate facade: Energy efficiency and thermal comfort performance [J]. Energy and Buildings, 2010, 42(1): 50-62.
[9] EUMORFOPOULOU E A, KONTOLEON K J. Experimental approach to the contribution of plant-covered walls to the thermal behaviour of building envelopes [J]. Building and Environment, 2009, 44(5): 1024-1038.
[10] FENG Ya. Thermal design standards for energy efficiency of residential buildings in hot summer/cold winter zones [J]. Energy and Buildings, 2004, 36(12): 1309-1312.
[11] YU Jing-hua, YANG Chang-zhi, TIAN Li-wei, LIAO Dan. Evaluation on energy and thermal performance for residential envelopes in hot summer and cold winter zone of China [J]. Applied Energy, 2009, 86(10): 1970-1985.
[12] XIAO Qiu-lian. Study on residential building envelope energy simulation and experiment in the Yangtze River Basin [D]. Chongqing: Chongqing University, 2009. (in Chinese)
[13] WU Wei-wei. Study on residential building envelope energy efficiency in hot summer and cold winter zone [D]. Chongqing: Chongqing University, 2008. (in Chinese)
[14] China Academy of Building Research. JGJ134��2001. Building standard for energy-efficiency of residential buildings in hot summer and cold winter zone [S]. Beijing: China Planning Press, 2001. (in Chinese)
[15] Construction Technology Development Center in Chongqing. Building energy conservation design standard training resource materials [M]. Chongqing: Chongqing Construction Energy Conservation Association, 2005: 127-190. (in Chinese)
(Edited by YANG Bing)
Foundation item: Project(2006BAJ01A05) supported by National Science and Technology Pillar Program during the 11th Five-year Plan Period of China
Received date: 2011-07-26; Accepted date: 2011-11-14
Corresponding author: WANG Hou-hua, Professor; Tel: +86-13638506927; E-mail: fordream2011@163.com
Abstract: To explore the energy saving effect of building envelope, the experiments were carried out through a comparison of basic cubicle in summer. Experiments show that if energy efficiency measures are applied only in the external walls and windows, the energy saving cubicles have an average energy efficiency ratio of 27.75% and 27.05% when the air change rates are 1.1 and 1.4 h-1 in summer, with both values being over the standard target value by 25%. And the indoor air temperature of the energy saving cubicle is below that of the basic cubicle. The daily mean temperature difference between the interior surface of insulation wall and no insulation reaches 1.47 ��, and the mean temperature difference is up to 8.52 �� between the interior surface and exterior surface of insulating glass and single glass. The two cubicles were simulated for energy consumption using VisualDOE4.0 software under real weather conditions in summer. The results show that the mean deviation is 10.02% between experimental and simulated energy efficiency ratio. The correctness and validity of simulation results of the VisualDOE4.0 software are proved.
