
Trans. Nonferrous Met. Soc. China 24(2014) 2041-2053
Update of Al-Fe-Si, Al-Mn-Si and Al-Fe-Mn-Si thermodynamic descriptions
Hai-lin CHEN1, Qing CHEN1, Yong DU2, Johan BRATBERG1, Anders  1
1
1. Thermo-Calc Software AB, SE-11364 Stockholm, Sweden;
2. State Key Laboratory of Powder Metallurgy, Central South University, Changsha 410083, China
Received 17 October 2013; accepted 4 May 2014
Abstract:
A thermodynamic assessment of the Al-Fe-Mn-Si quaternary system and its subsystems was performed by the Calphad method. First, the Al-Fe-Si ternary description was deeply revised by considering the most recent experimental investigations and employing new models to ternary compounds. Significant improvements were made on the calculated liquidus projection over the entire compositional range, especially in the Al-rich corner. The Al-Mn-Si system was refined in the Al-rich region by adopting new models for the two ternary compounds, ��-AlMnSi and ��-AlMnSi. The extended solubility of the ��-AlMnSi phase into the Al-Fe-Mn-Si quaternary system was modeled to reproduce the phase equilibria in the Al-rich region. Special cares were taken in order to prevent ��-AlMnSi from becoming stable in the Al-Fe-Si ternary system. The obtained thermodynamic descriptions were then implemented into the TCAL database, and extensively validated with phase equilibrium calculations and solidification simulations against experimental data/information from commercial aluminum alloys. The updated TCAL database can reliably predict the phase formation in Al-Fe-Si- and Al-Fe-Mn-Si-based aluminum alloys.
Key words:
Al-Fe-Si; Al-Fe-Mn-Si; aluminum alloys; thermodynamic modeling; solidification;
1 Introduction
The Al-Fe-Mn-Si quaternary system and its subsystems are of great importance to aluminum alloys since Fe, Mn and Si are the most common additives and/or impurities in aluminum alloys. These alloying elements have a fundamental influence on the phase formation and thus the mechanical properties of aluminum alloys. The addition of these elements in aluminum alloys may form the following binary and ternary compounds, Al6Mn, Al13Fe4, ��-AlFeSi (��5, Al8Fe2Si), ��-AlFeSi (��6, Al9Fe2Si2 or Al5FeSi) and ��-AlMnSi (��9). Most ternary compounds are labeled as �� together with a sequence number, such as ��1, ��2, ��3. throughout the manuscript. The four compounds, ��5- AlFeSi, ��6-AlFeSi, ��9-AlMnSi and ��8-AlMnSi, however, are denoted with their conventional names, respectively, ��-AlFeSi, ��-AlFeSi, ��-AlMnSi and ��-AlMnSi. Al6Mn may dissolve a noticeable amount of Fe and Al13Fe4 can contain a considerable amount of Mn. The ��-AlMnSi phase exhibits an extended solid solution into the quaternary Al-Fe-Mn-Si system and approaching the ternary Al-Fe-Si edge.
A thermodynamic assessment of the Al-Fe-Mn-Si quaternary system has not been available in literature until the recent work by LACAZE et al [1]. Their work has been conducted based on the COST507 database [2], in which thermodynamic modeling has been performed for the ternary subsystems, Al-Fe-Si, Al-Mn-Si and Al-Fe-Mn. As part of the assessment, the Al-Fe-Si ternary description has first been refined by the same group of investigators [3] by altering the thermodynamic descriptions of the Al-Fe-Si phases, ��, ��, ��2(��) and ��4(��). In the quaternary system, the solubilities of the ��-AlMnSi and ��-AlMnSi (��8) phases have been considered. Recalculations in the present work using the COST507 database with the published parameters [1,3] incorporated, however, revealed fatal problems. Errors/typos exist in the parameters for ��-AlMnSi since the published phase diagrams cannot be reproduced and this phase becomes obviously too stable. Although the phase equilibria associated with ��-AlMnSi in the Al-Fe- Mn-Si quaternary system can generally be reproduced after the ��-AlMnSi phase has been suspended, the ��-AlMnSi phase becomes stable in the Al-Fe-Si ternary system. The Al-Fe-Si ternary description in Ref. [3] appears reasonable while the Al-Fe-Mn-Si quaternary description in Ref. [1] is unacceptable.
Calphad is an important branch of computational material science [4,5]. Thermodynamic simulation of phase formation and calculated phase diagrams, as well as kinetic simulation of diffusion-controlled phase transformations and multi-particle precipitation, has been successfully used as an effective tool in alloy design and process optimization of aluminum alloys. The reliability of the predictions depends strongly on the quality of the thermodynamic and atomic mobility databases that are used. A thermodynamic database for multi-component aluminum-based alloy, TCAL (recently released version 2.0), and a kinetic database containing mobility data for the liquid and FCC phases in Al-based alloys, MOBAL (recently released version 2.0), have been developed by Thermo-Calc Software AB [6]. The present work is to develop a reliable thermodynamic description for the Al-Fe-Mn-Si quaternary system, including its subsystems Al-Fe-Si and Al-Mn-Si. This work is under a long-term internal project at Thermo-Calc Software AB, which aims at a continuous development of the TCAL database.
2 Refinement of Al-Fe-Si description
Thermodynamic assessments have been performed for the Al-Fe-Si ternary system several times. The most recent assessment over the whole composition range have been done by DU et al [7]. The two Al-rich ternary phases, ��-AlFeSi and ��-AlFeSi, were treated as stoichiometric compounds and their homogeneity ranges were assessed to be Al68-72Fe18-19.5Si10-12.5 and Al64.5-67.5Fe15.5-16.5Si17-19, respectively [8]. The homogeneity ranges are small but should be considered, since the phase equilibria involving the two phases are critically important aluminum alloys. Moreover, the liquidus surface needs to be improved in order to account for the phase formation during the solidification of aluminum alloys. Additionally, some discrepancies with experimental data in Al-rich corner have been identified. As aforementioned, ELENO et al [3] recently reassessed the Al-rich phase equilibria of the Al-Fe-Si system and refined the descriptions of ��-AlFeSi, ��-AlFeSi, ��2-AlFeSi and ��4-AlFeSi within the COST507 database. However, the Al-Fe-Si description in the COST507 database is relatively outdated compared with that of DU et al [7]. The present work thus chose to perform a further thermodynamic reassessment of the Al-Fe-Si system over the entire compositional range based on the work of DU et al [7], which has been accepted in the TCAL2.0 database, but the models for ��-AlFeSi, ��-AlFeSi, ��2-AlFeSi and ��4-AlFeSi were accepted from ELENO et al [3]. For ��-AlFeSi and ��-AlFeSi, the models were changed in order to consider the substitution between Fe and Si. As for ��2-AlFeSi and ��4-AlFeSi, the models proposed by DU et al [7] are more reasonable in the crystallographic point of view, but those by ELENO et al [3] facilitate the modeling of the homogeneities of these phases. Additionally, the model for ��3-AlFeSi was slightly modified from Al55Fe25Si20 to Al0.56Fe0.24Si0.20, not only to better account for its homogeneity (Al53-56Fe23.5-24.5Si20.5-22.5) experimentally determined by KRENDELSBERGER et al [8] but also to overcome the difficulty in positioning the liquidus surface of ��11-AlFeSi (Al0.60Fe0.25Si0.15) relative to ��3-AlFeSi. The model for ��11-AlFeSi was modified from Al85Fe30Si15 to Al0.65Fe0.25Si0.10 simply because the latter model explicitly reflects its composition.
MARKER et al [9] have most recently studied the phase equilibria of the Al-Fe-Si system by means of X-ray diffraction (XRD), optical microscopy (OM), scanning electron microscopy (SEM), electron probe microanalysis (EPMA) and differential thermal analysis (DTA). The isothermal sections at 800 ��C in the Al-rich corner and at 900 ��C in the Fe-rich part, and six vertical sections at 27%, 35%, 40%, 50% and 60% Fe and 5% Al were consequently constructed. The high-temperature modification of FeSi2 (ht) phase was reported to have a solubility of Al up to 8.5% and was stabilized by the Al addition down to much lower temperatures in the ternary system. The low-temperature modification of FeSi2 (rt), however, has a limited solubility of Al. As demonstrated by MARKER et al [9], the newly measured vertical sections cannot be accounted for using the description by DU et al [7] and significant deviations were observed. Additionally, MARKER et al [9] observed a new ternary compound ��12-Fe36Al48Si16 at both 800 ��C and 900 ��C and further experiments suggested that ��12 forms only via solid-state reactions.
In the present thermodynamic optimization, the experimental data that were utilized in the previous assessments by DU et al [7] and ELENO et al [3] were all considered. Besides, the liquidus data on those vertical sections constructed by MARKER et al [9], together with the solubility of the FeSi2 (ht) phase were taken into account. The new ternary phase ��12, however, was not considered in this modeling, since it has never been reported by other investigators and is insignificant to industrial aluminum alloys.
Using the obtained description, phase diagrams were recalculated and compared with the experimental data together with the previous calculations [3,7]. To save space, only selected examples were shown in this manuscript. Figures 1-3 present the vertical sections at 5% Fe, 10% Si, and 13.5% Si. For the sake of simplification, not all phases were labeled. Comparable agreements with experimental data were obtained by using the present description and the previous ones [3,7]. It should be mentioned that the ��11 phase was destabilized compared to that in the previous assessment [7] in order to accord with the assessment by KRENDELSBERGER et al [8]. As a result, the ��11 phase does not appear in the presently calculated vertical section at 10% Si in Fig. 1.
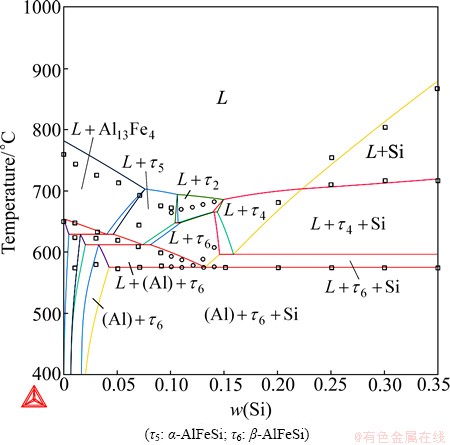
Fig. 1 Calculated Al-Fe-Si vertical section at 5% Fe

Fig. 2 Calculated Al-Fe-Si vertical section at 10% Si
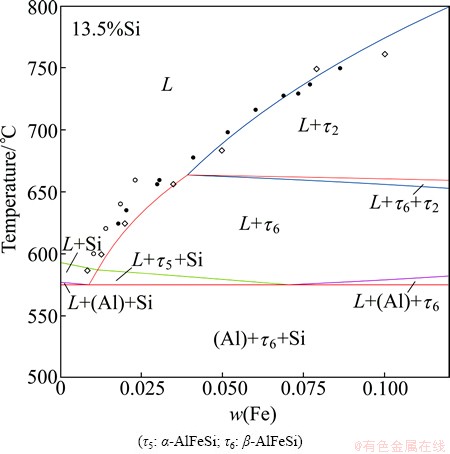
Fig. 3 Calculated Al-Fe-Si vertical section at 13.5% Si
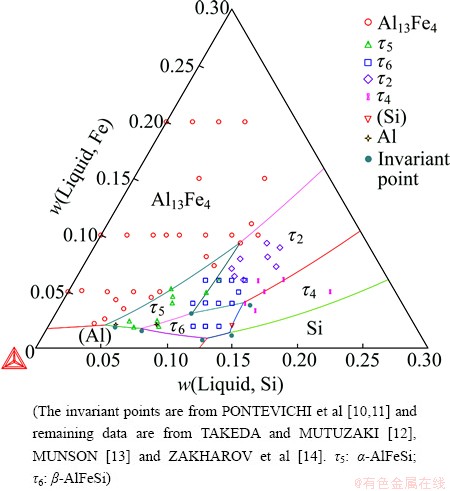
Fig. 4 Calculated Al-Fe-Si liquidus surface in Al-rich corner
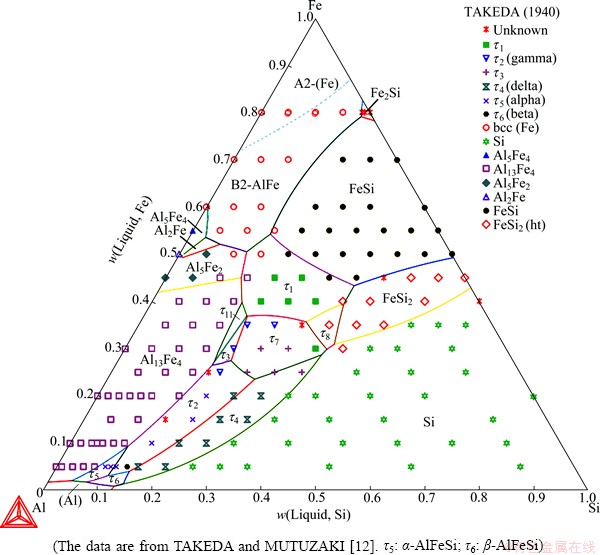
Fig. 5 Calculated Al-Fe-Si liquidus surface over entire compositional range
The Al-Fe-Si liquidus surface was well constructed in this work, as shown at the Al-rich region in Fig. 4 and over the entire composition range in Fig. 5. The Al-rich liquidus surface consists of the primary solidification regions of (Al), Si, Al13Fe4, ��2-AlFeSi, ��4-AlFeSi, ��-AlFeSi and ��-AlFeSi. Good agreements were observed with the invariant equilibrium compositions from PONTEVICHI et al [10,11] and the data of the primary solidification region of Al13Fe4 from TAKEDA and MUTUZAKI [12]. The experimental data corresponding to the primary solidification of ��, ��, ��2 and ��4 from TAKEDA and MUTUZAKI [12], MUNSON [13] and ZAKHAROV et al [14] are somehow scattered. Note that the experimental data of MUNSON [13] and ZAKHAROV et al [14] were read from the publication of ELENO et al [3] since the original papers were not accessible. Although these data cannot be fully fitted to, the calculated liquidus surface is believed to be reasonable since the invariant points were well reproduced (on both compositions and temperatures). The presently calculated liquidus surface is not only as good as that in the recent work of ELENO et al [3] in the Al-rich corner, but also reasonably reproduces the primary solidifications areas of most phases beyond the Al-rich region.
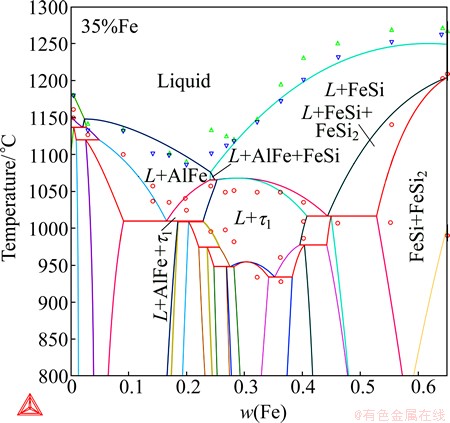
Fig. 6 Calculated vertical section at 35% Fe of Al-Fe-Si system, compared with experimental data from MARKER et al [9]
Discrepancies are observed in the center region. The main problem is that the calculated liquidus surface for ��1-AlFeSi is noticeably larger than that suggested by experimental data, probably indicating that this ternary phase is somewhat too stable. It should be noted that some ternary phases, e.g. ��2 and ��, have not been well distinguished from each other in the early investigations [12,15], as pointed out already by ARMAND [16] and KRENDELSBERGER et al [8]. Similar difficulties in phase identification might exist among the ternary phases, ��2, ��3 and ��7. Nevertheless, significant improvements were obtained compared with the description of DU et al [7]. It is believed (and has latter been confirmed in the validation, Section 4) that this description can much better simulate the solidification process of aluminum alloys. The improvements in the liquidus surface also resulted in a much better fitting to the vertical sections (5% Al, 27% Fe, 35% Fe, 40% Fe, 50% Fe and 60% Fe) that had been constructed by MARKER et al [9]. As an example, Fig. 6 compares the calculated vertical section at 35% Fe with the experimental data from MARKER et al [9] and the agreement is reasonable.
3 Refinement of Al-Mn-Si and Al-Fe-Mn- Si systems
A comprehensive thermodynamic assessment of the Al-Mn-Si system was performed by DU et al [17]. The description was later updated in order to adapt to the new Al-Mn binary description [18]. The updated parameters for the Al-Mn-Si system have been incorporated into the TCAL database and remains unpublished. The ��-AlMnSi phase was modeled as Al14Mn4(Al,Si)5 by DU et al [17,18]. The substitution between Al and Si on the last sublattice allows a much wider composition variation than the experimentally determined homogeneity range. In other words, the two end-members given by this model are far away from the phase composition, which increases the difficulty in the modeling, especially in the extrapolation into the Al-Fe-Mn-Si quaternary system. In this work, ��-AlMnSi was remodeled as Al16Mn4- Si1(Al,Si)2, following the work of LACAZE et al [1]. The ��-AlMnSi phase has been modeled as (Mn,Va)6- (Mn,Va)2Al12(Al,Si)6(Al,Si)2 [17,18], which resulted in 16 end-members. The model was too complex to allow a reasonable assessment of the Gibbs energy of every end-member. Therefore, this phase was remodeled in this work as Al6Mn3(Al,Mn,Si)3(Al,Si)1 according to its crystal structure [19] and the number of end-members was reduced to 6. In order to eliminate the impact on the phase equilibria due to the remodeling of ��-AlMnSi and ��-AlMnSi, the descriptions of neighboring phases were also adjusted. Figure 7 presents the Al-rich Al-Mn-Si liquidus surface, where the monovariant line L+ ��-AlMnSi+��-AlMnSi is slightly improved compared to the previous calculation [17]. Figure 8 shows the calculated vertical section at 4% Si, on which the DTA data from ROBINSON et al [20] and the unpublished data that were cited in the previous work [17] are imposed. The phase boundaries of L/L+��-AlMnSi, L/ L+��-AlMnSi and L+��-AlMnSi/L+��-AlMnSi+��-AlMnSi agree better with the experimental data after the refinement.
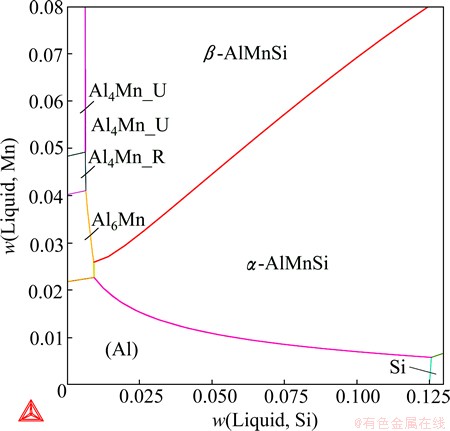
Fig. 7 Calculated Al-Mn-Si liquidus surface in most Al-rich corner
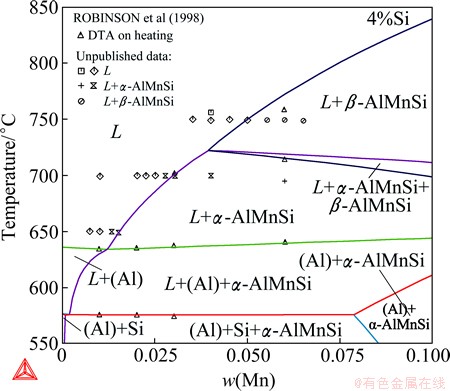
Fig. 8 Calculated Al-Mn-Si vertical section at 4% Si
The ��-AlMnSi phase exhibits an extended solid solubility of Fe into the Al-Fe-Mn-Si quaternary system and approaching the Al-Fe-Si ternary system [21]. The solution phase based on ��-AlMnSi plays a central role in the Al-rich phase equilibria of the quaternary system and has to be well modeled. Introducing Fe into the sublattice model results in a new model of Al16(Fe,Mn)4Si1(Al,Si)2 and two additional end-members, Al18Fe4Si1 and Al16Fe4Si3, for which thermodynamic parameters need to be evaluated. According to MONDOLFO [22], most of the manganese in ��-AlMnSi can be replaced by iron, up to a composition of 18% Fe, 0.9% Mn and 9.3% Si in mole fraction (31% Fe, 1.5% Mn and 8% Si in mass fraction). Therefore, the Gibbs free energy of the two metastable end-members were expected to be very close to that of the set of stable phases in the Al-Fe-Si system. An automatic optimization of the thermodynamic parameters without constrains would not work. This explains why ��-AlMnSi became stable in the Al-Fe-Si ternary subsystem in the assessment of LACAZE et al [1]. Special cares were taken in this work while assessing the Gibbs free energy of the two end-members, in order to prevent ��-AlMnSi from becoming stable in the Al-Fe-Si system.
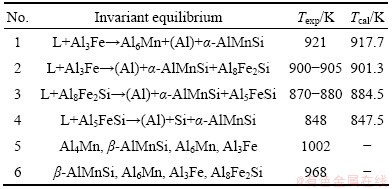
Figure 9 presents the calculated liquidus surface of the Al-Fe-Mn-Si system at 0.3% Mn, in which the boundary between the primary solidification regions of ��-AlMnSi and ��-AlFeSi well agrees with the experimental data from MUNSON [13]. Table 1 lists six invariant equilibria in the Al-Fe-Mn-Si quaternary system, which have been assessed in Ref. [22]. The first four, which are associated with (Al) and ��-AlMnSi, can be well reproduced. To reproduce the latter two, however, the ��-AlMnSi phase needs to be slightly destabilized based on the current description, which would make the primary solidification region of ��-AlMnSi shrink accordingly, but make no significant differences in predicting the phase formation in industrial aluminum alloys. Considering that the invariant equilibria (5) and (6) have not been well determined and they cannot take place in aluminum-rich alloys, the current description was kept to have a better liquidus surface. LACAZE et al [1] managed to reproduce the equilibrium (5), but calculated a different equilibrium (6) and failed to reproduce equilibria (3) and (4), even though they over optimized their parameters, which made ��-AlMnSi stable in the Al-Fe-Si system.
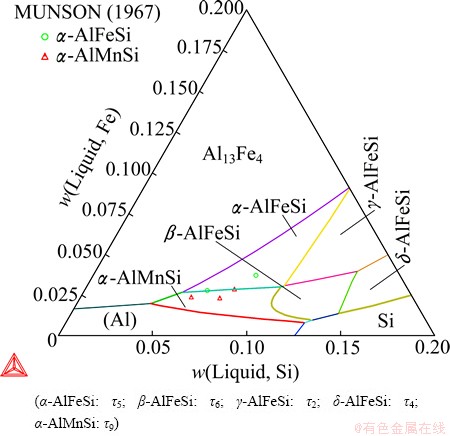
Fig. 9 Calculated Al-Fe-Mn-Si liquidus surface at 0.3% Mn
Table 1 Calculated invariant equilibria of Al-Fe-Mn-Si quaternary system by MONDOLFO (1976) [22]
4 Implementation in TCAL2.0 and validation against experimental data from industrial alloys
Through the above calculations and comparisons, the obtained Al-Fe-Si, Al-Mn-Si and Al-Fe-Mn-Si thermodynamic descriptions have been proved to be reliable in producing the phase equilibria in these systems. This work is under an internal project at Thermo-Calc Software AB aiming at a continuous development of the aluminum-based alloy thermo- dynamic database, TCAL, for guiding aluminum alloys design and process optimization. Since industrial aluminum alloys may contain other additives, especially the major alloying elements, such as Cu, Mg and Zn, a further validation must be performed within higher-order multi-component alloy systems or even real industrial alloy compositions. Therefore, the obtained Al-Fe-Si, Al-Mn-Si and Al-Fe-Mn-Si thermodynamic descriptions were incorporated into the TCAL2.0 database, which is the previously released version, and then a comprehensive validation of the updated database was performed by phase equilibrium calculations and solidification simulations against experimental data on commercial alloys from various literature sources.
For instance,  et al [23] performed extensive experimental investigations on a wide range commercial wrought aluminum alloys and cast aluminum alloys, by means of differential thermal analysis (DTA), optical metallography (OM) and scanning electron microscopy (SEM) with energy dispersive analysis of X-ray (EDX). Valuable experimental data/information were provided for validating the solidification simulations. They not only examined the as-cast microstructures and measured the phase transition temperatures, but also derived the solidification sequences, the phase transition reactions and estimated the phase fractions during the solidification process.
Examples for the solidification simulations of commercial aluminum alloys and the validations against the experimental results from et al [23] are to be presented in the following subsections. Through the examples, we intend to showcase how well the calculations using the updated TCAL database can account for the phase formation in industrial aluminum alloys, and more importantly, to demonstrate how to appropriately interpret the experimental results from multi-component alloys with the aid of Calphad calculations.
4.1 Wrought AA3003 alloy
The first example is the wrought AA3003 aluminum alloy, which is based on the Al-Fe-Mn-Si quaternary alloy system [24]. Figure 10 presents the Scheil solidification calculation of the AA3003 alloy using the Scheil module of the Thermo-Calc Software package [25]. In order to reliably compare the calculated results with the experimental results from et al [23], the real alloy composition (Al98.08Mn1.19Fe0.55Si0.18, mass fraction, %) in their experiments was used in the present calculation. Using the Scheil module, the corresponding equilibrium calculation will be automatically performed in additional to the Scheil calculation. In a plot of the total amount of solid phases, e.g. Fig. 10, the curve from the Scheil calculation is presented in solid line and from the equilibrium calculation in dashed line for comparison.
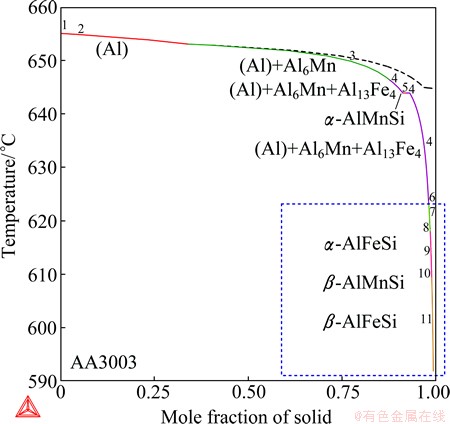
Fig. 10 Total solid phase fraction in Scheil (in solid line) and equilibrium (in dashed line) solidification simulations of wrought AA3003 aluminum alloy
In the alloys solidified at cooling rates from 0.5 ��C/s to 3.9 ��C/s, the two compounds Al6Mn and ��-AlMnSi were observed in the matrix of the (Al) solution. Both compounds dissolve Fe, but the compositions have not been reported. Based on the DTA experiments and microstructure examinations, probably as well as phase diagrams, et al [23] derived the complete solidification sequence:
(1) L = (Al), 655 ��C
(2) L = (Al) + Al6Mn, 653 ��C
(3) L + Al6Mn = (Al) + ��-AlMnSi, 641-634 ��C
(4) L = (Al) + ��-AlMnSi
where the temperatures are from DTA experiments at 0.5 ��C/s or 1.2 ��C/s. At a first glance, it seems that the present solidification calculation makes no sense at all. Especially, the three ternary compounds ��-AlFeSi, ��-AlMnSi and ��-AlFeSi, which were predicted to form at the late stages of the Scheil calculation, have not been experimentally detected. The solidification has been reported to end at 634 ��C at 0.5 ��C/s or 1.2 ��C/s, while the Scheil solidification seems endless and the calculation is arbitrarily terminated at 1% residual liquid (around 590 ��C).
Before drawing a conclusion, one should keep in mind that a real solidification process is usually expected to be between the Scheil calculation and the equilibrium calculation, and could much more approach to one of them than the other, depending on the alloy system, the alloy composition, and the experimental parameters such as the cooling rate. Therefore, Scheil solidification calculations are not always good for accounting for experimental solidification processes. In this case, for example, the real solidification process at lower cooling rates can be much better approximated with the equilibrium calculation. Figure 11 separately shows the results from the equilibrium calculation by plotting individual phase fractions versus the temperature. First of all, the Al13Fe4 phase disappears in the equilibrium calculation, which is in agreement with the experimental results. Moreover, the equilibrium solidification calculation ends at 644.7 ��C, which is close to the experimental completion temperature of 634 ��C. Note that one should not expect a precise fitting to the completion temperature, since the solidification is after all non-equilibrium. Lastly, the equilibrium calculation exactly predicts the solidification sequence, from reaction (1) to reaction (3). The calculated solidification immediately ends after the peritectic-type reaction (3), so the formation of extra phases that have been predicted at the late stages of the Scheil calculation is avoided.
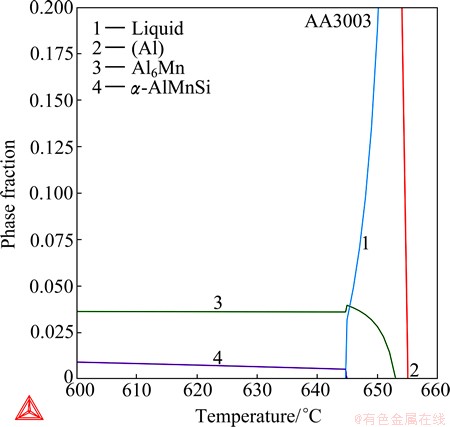
Fig. 11 Phase fractions versus temperature from equilibrium calculation of AA3003 wrought aluminum alloy
It is worth noting that the solidification completion temperature significantly decreases with increasing the cooling rate, from 634 ��C at 1.2 ��C /s, to 613 ��C at 3.9 ��C /s and 589 ��C at 17 ��C /s. The last value is quite close to the end of the Scheil calculation (about 590 ��C at 1% residual liquid). This suggests that the Scheil calculation might account for the experimental solidification at higher cooling rates, where the solidification becomes more non-equilibrium. Unfortunately, no microstructures have been presented for the alloy solidified at 17 ��C /s and it was not known if extra phases have indeed formed. It can still be concluded that equilibrium calculations can better account for solidifications at lower cooling rates while Scheil calculations can be employed to higher cooling rates in this case.
4.2 Wrought AA4004 alloy
This example presents the calculations for the wrought AA4004 aluminum alloy (real alloy composition: Al88.55Si9.8Mg1.35Fe0.3, mass fraction, %). During the solidification of an Al-Fe-Mg-Si-based aluminum alloy, Si, Mg2Si, ��-AlFeSi, ��-AlFeSi, and Q-AlFeMgSi (Al18Fe2Mg7Si10) may form in addition to the (Al) solution phase (where Q indicates quaternary phases). From this example, we can testify the validity of the Al-Fe-Mg-Si quaternary description with the updated Al-Fe-Si ternary description integrated.
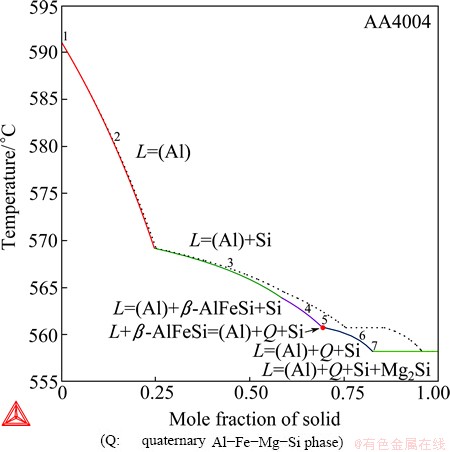
Fig. 12 Total solid phase fraction in Scheil (in solid line) and equilibrium (in dashed line) solidification simulation of AA4004 wrought aluminum alloy
As shown in Fig.12, the Scheil and equilibrium solidification calculations of alloy AA4004 are quite close to each other, in the phases that form, the phase formation sequences and even the transition temperatures. This feather is quite different from that in alloy AA3003 and it has practical significance to the real solidification. A small deviation of the Scheil calculation from the equilibrium calculation means that moderately changing the cooling rate would have a small impact on the phase formation sequence. This can be verified by the experimental evidences that the phase transformation temperatures remained almost the same in DTA at different cooling rates, 0.2, 0.8, 2.8 and 9 ��C/s [23]. It should be noted that the deviation between the two calculations becomes noticeable at late stages of the solidification and would result in different phase fractions. Also, due to the small deviation, both calculations may account for the experimentally observed microstructures and the derived solidification sequence [23],
(1) L = (Al), 590 ��C
(2) L = (Al) + ��-AlFeSi, 584 ��C
(3) L = (Al) + ��-AlFeSi + Si, 576 ��C
(4) L + ��-AlFeSi = (Al) + Q-AlFeMgSi + Si, 567 ��C
(6) L = (Al) + Q-AlFeMgSi + Si + Mg2Si, 554 ��C
The only discrepancy between the calculation and the experiment lies in whether ��-AlFeSi or Si formed first. According to the Al-Fe-Si liquidus surface as given in Fig. 4, which have been validated against experimental data, Si very probably forms first before the ��-AlFeSi phase did in this alloy because of the high Si/Fe ratio. Therefore, the phase formation sequence predicted by the solidification calculations is believed to be more reliable than that derived by et al [23]. In practice, an analysis solely based on finally solidified microstructures is usually difficult and incomprehensive. Calphad calculations can help to advance the analysis of experimental microstructures and to fully understand the phase formation sequences.
A transformation from ��-AlFeSi to the quaternary Q-AlFeMgSi phase was observed in the solidified microstructures [23], which evidenced the reaction (4). Following the peritectic-type reaction, there should be a direct solidification of the product phases, i.e. L = (Al) + Q-AlFeMgSi + Si (5). In practice, a peritectic-type reaction and the direct solidification often simultaneously take place [26]. If the solidification deviates more from the equilibrium, the peritectic-type reaction will be suppressed to a larger extent while the direct solidification will be favored. A Scheil calculation is the extreme case, where peritectic-type reactions are completely prevented from occurring since the transformation of solid phases has not been considered. As given in Fig. 12, the peritectic-type reaction (4) corresponds to a plateau on the equilibrium curve but just an infinitely small point on the Scheil simulation curve. In either case, the direct solidification stage is unavoidable unless the liquid has been completely consumed.
This stage is also needed in order to complete the solidification sequence from reaction (4) to reaction (6). Since the investigated alloy is actually a quaternary one, its solidification terminates at the five-phase eutectic reaction (6), which was presently calculated at 558 ��C. et al [23] reported the invariant reaction temperature to be 547 ��C in the first volume of their book but 554 ��C in the second volume. The latter is exactly the same as that evaluated by MONDOLFO [22] in an assessment of the Al-Fe-Mg-Si quaternary system and is a good agreement with the present calculation.
4.3 Wrought AA5182 alloy
The solidification in the wrought AA5182 aluminum alloy (real alloy composition: Al94.54Mg4.74- Mn0.34Fe0.28Si0.10, mass fraction, %) is more complex than that in Al-Fe-Mn-Si-based AA3003 and Al-Fe- Mg-Si-based AA4004, because of the competition among the Fe-, Mg-, Mn-, and Si-containing phases. However, a perfect agreement was obtained between the experiments and the Scheil calculation, on the phase formation, the solidification sequence and even the transition temperatures. Figure 13 presents the solidification simulations of this alloy. In this case, the Scheil calculation significantly deviates from the equilibrium calculation but can better account for the experiments [23], which is given below,
(1) L = (Al), at 632 ��C
(2) L = (Al) + Al6Mn, at 621 ��C
(4) L = (Al) + Al13Fe4, at 586 ��C
(6) L = (Al) + Al13Fe4 + Mg2Si + ��-AlMg
The solidification starts with the primary formation of (Al), followed by Al6Mn and Al13Fe4. Similar to the example of AA4004, there should be a reaction, (3) L + Al6Mn = (Al) + Al13Fe4, between reactions (2) and (4), as predicted by the present Scheil solidification simulation. The peritectic-type (although not a real peritectic) reaction corresponds to an infinitely small point on the Scheil simulation curve as given in Fig. 13, which means that the transformation from Al6Mn to Al13Fe4 is suppressed. In this example, the experimental solidification much more approaches to the Scheil calculation than the equilibrium calculation and this might suggest that the direct solidification of (Al) + Al13Fe4 is favored.
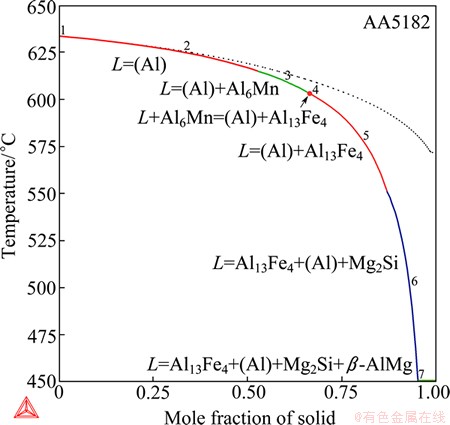
Fig. 13 Total solid phase fraction in Scheil (in solid line) and equilibrium (in dashed line) solidification simulation of AA5182 wrought aluminum alloy
During the late stages of the solidification, the Mg2Si and ��-AlMg phases form via eutectic reactions. The quaternary eutectic reaction (6) has been evidenced by the observation of the complex eutectic microstructure (Al), Al13Fe4, Mg2Si and ��-AlMg in the solidified alloy [23]. Before the reaction (6), however, in theory there should also be a four-phase eutectic reaction L = (Al) + Al13Fe4 + Mg2Si (5). et al [23] assumed that the reaction (6) started to occur at 557 ��C and lasted until the end of the solidification. Although the alloy contains five components, the five-phase eutectic reaction (6) acts very much like an invariant equilibrium probably because Mn has been depleted in the liquid, as revealed in the Scheil calculation. Therefore, the reaction at 557 ��C should correspond to a ��monovariant�� reaction, i.e. the four-phase eutectic reaction (5). The solidification ends at the quaternary ��invariant�� reaction (6), which is calculated to occur at 450 ��C. It is in a good agreement with the value of 448 ��C evaluated by MONDOLFO [22] in the assessment of the Al-Fe-Mg-Si quaternary system. Note that et al [23] failed to determine the solidification completion temperature but roughly estimated a value of 470 ��C based on the Al-Fe-Si ternary phase diagram of MONDOLFO [22], which was 20 ��C higher than the assessed value and was thus discarded.
4.4 Cast 319.1 alloy
This example is on the cast 319.1 aluminum alloy, which has a quite complex composition, 5.7% Si, 3.4% Cu, 0.92% Zn, 0.62% Fe, 0.36% Mn, 0.14% Ti and 0.10% Mg (mass fraction, %). Figure 14 presents the solidification simulations of this alloy, where the total solid phase fractions are imposed on the plot at specific stages of the solidification, estimated from the experimental DTA traces by et al [23]. Although the data are somewhat scattered, a reasonable agreement of the Scheil calculation with these data is observed. Moreover, not only all the phases that have been found in the microstructures are predicted by the Scheil calculation, but also the phase formation sequence is reproduced: the (Al) dendrites solidify primarily, the formation of ��-AlMnSi, ��-AlFeSi and Si follows successively, and Al2Cu and the quaternary Al-Cu-Mg- Si phase precipitate in the late stages. This is a remarkable agreement considering the complexity.
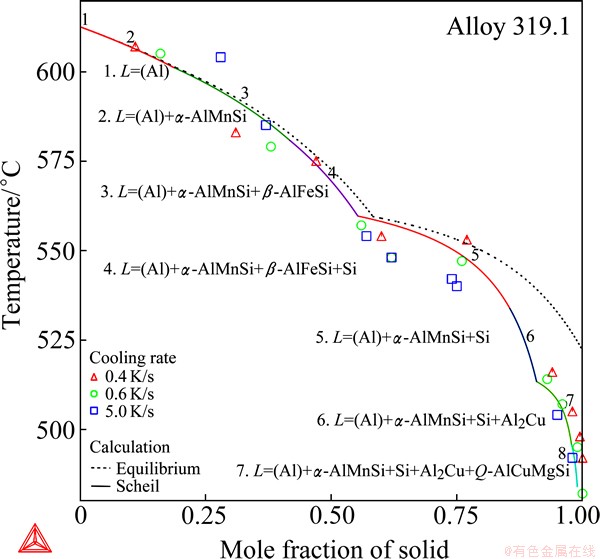
Fig. 14 Total solid phase fraction in Scheil (in solid line) and equilibrium (in dashed line) solidification simulation of cast A319.1 aluminum alloy
Despite of the good agreement in the phase formation sequence, however, not every calculated reaction for each stage of the solidification accords with that proposed by et al [23] as given below,
(1) L = (Al), 609 ��C
(2) L = (Al) + ��-AlMnSi, 590 ��C
(3) L = (Al) + ��-AlMnSi + ��-AlFeSi, 590 ��C
(4) L = (Al) + Si + ��-AlFeSi, 575 ��C
(5) L = (Al) + Al2Cu + Si + ��-AlFeSi, 525 ��C
(6) L = (Al) + Al2Cu + Si + Q-AlCuMgSi, 507 ��C
Only the first three reactions were confirmed. Actually, the above derived reactions are not consistent, since one phase disappears and another appears from reaction (3) to reaction (4) and also from reaction (5) to reaction (6). As aforementioned, it is difficult to comprehensively derive the solidification sequence from the analysis of the finally solidified microstructures, not to mention to postulate the phase transition reaction for each stage of the solidification. Any attempt based on only experimental microstructures could be tentative. Knowledge of phase equilibria of the alloy system and its subsystems must be comprehensively taken into account, which is, however, impractical in such a multi- component system without the aid of the Calphad method. One of the major merits of the Calphad method is that it enables one to extrapolate the phase equilibria to multi-component systems from well-assessed subsystems, so as to predict the phase formation in multi-component multi-phase alloys.
4.5 Cast 332.1 alloy
Figure 15 presents the solidification calculation of the cast 332.1 alloy (real composition: 9.9% Si, 2.82% Cu, 0.97% Zn, 0.91% Mg, 0.67% Fe, 0.25% Mn, 0.07% Ti; mass fraction, %). All the eight phases that have been experimentally identified [23] are confirmed by the Scheil solidification simulation. All the phases appearing in the calculation have been experimentally observed. Moreover, the calculation completely agrees with the proposed solidification sequence by et al [23]: (Al) solidifies primarily and immediately followed by ��-AlMnSi; ��-AlFeSi and (Si) form afterwards; at the late stages, Q-AlFeMgSi and Mg2Si, Q-AlCuMgSi and Al2Cu form successively. Note that et al failed to determine the sequence between ��-AlFeSi and (Si) and that between Q-AlFeMgSi and Mg2Si. The total solid phase fractions are imposed on the plot at specific stages of the solidification, estimated from the experimental DTA traces by et al [23]. The data from experiments at lower cooling rates (0.3 K/S and 0.5 K/S) can generally be approximated with the Scheil calculation. The data at higher cooling rate (4.5 K/S) are somehow scattered.
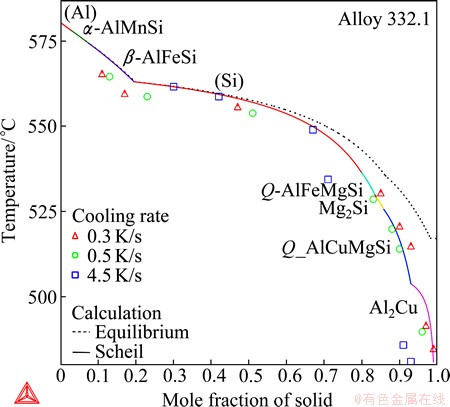
Fig. 15 Total solid phase fraction in Scheil (in solid line) and equilibrium (in dashed line) solidification simulation of cast A332.1 aluminum alloy
It makes no sense to compare the calculated reactions with those proposed by et al [23] in such a complex case (even more complex than the last example where the reactions cannot be fully derived), considering the fact that the proposed solidification sequence is incomplete. Based on the excellent agreements on the observed phases and the phase formation sequence, together with the phase fractions, it can be concluded that the present calculation reasonably accounts for the solidification. It is suggested to directly use the Scheil simulation to interpret the detailed reaction corresponding to each stage of the solidification.
4.6 Cast A413.1 alloy
The final example is on the die-cast A413.1 aluminum alloy (experimental composition: 11.0% Si, 1.1% Zn, 0.46% Fe, 0.18% Mn, 0.09% Cu, and 0.03% Mg; mass fraction), which contains most main alloying elements of aluminum alloys. The phase formation and the microstructure, however, are quite simple since the contents of Cu, Mg and Zn are too low to form compounds. Note that the Zn solubility in the (Al) solution is very high. Only Si, ��-AlFeSi and ��-AlMnSi have been experimentally observed in the solidified microstructures, in addition to the (Al) matrix.
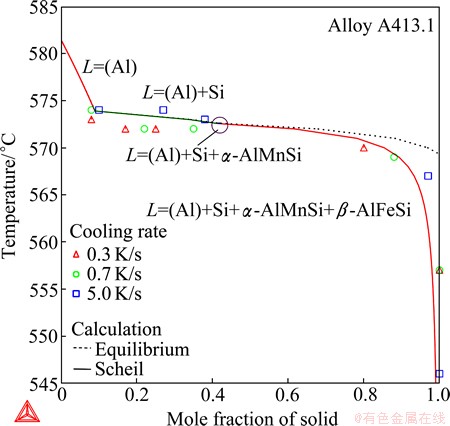
Fig. 16 Total solid phase fraction in Scheil (in solid line) and equilibrium (in dashed line) solidification simulation of cast A413.1 aluminum alloy
It is clear that the solidification starts with the formation of the (Al) dendrites, but the difficulties in the experiments had prevented et al [23] from unambiguously determining the formation sequence of the remaining phases, because the relevant phase reactions occur in a very narrow temperature interval. Solidification simulations were thus performed, as presented Fig. 16, in order to reveal the details of the solidification. The Scheil calculation agrees with the equilibrium calculation except for the late stage of the solidification. Both calculations predict the same phase reaction sequence as follows:
(1) L = (Al), 581 ��C
(2) L = (Al) + Si, 574 ��C
(3) L = (Al) + Si + ��-AlMnSi, 572.6 ��C
(4) L = (Al) + Si + ��-AlMnSi + ��-AlFeSi, 572.6 ��C
Si is the secondary phase following the primary solidification of (Al) due to the significantly high Si content. Since the stage (2) the slopes of the solidification curves abruptly become gentle (If reversing the axes, i.e. the solid phase fractions versus the temperature, the slop actually becomes steep), which indicates that the solidification becomes fast. Especially, the temperature interval from the start of the stage (2) to the completion of the solidification is less than 5 ��C for the equilibrium calculation. The Scheil solidification, however, is slowed down at the late stage (say less than 20% residual liquid) and the slope is getting more and more steep, which seems endless. The Scheil calculation can better account for the data of total solid phase fractions evaluated from the experiment [23], especially those at the higher cooling rate. The ��-AlMnSi phase starts to form at 572.6 ��C via the eutectic reaction (3), which is immediately followed by the five-phase eutectic reaction (4). This indicates that ��-AlMnSi starts to form slightly earlier than ��-AlFeSi by less than 0.1 ��C, which is indeed negligible. Basically, ��-AlFeSi and ��-AlMnSi form simultaneously. It should be mentioned that a slight change of the Fe/Mn ratio will reverse the formation sequence of the two phases, as expected and confirmed by additional calculations. Reaction (3) will become L = (Al) + Si + ��-AlFeSi when ��-AlFeSi forms earlier. This might be another factor which has puzzled the experimental investigators��A slight composition deviation or heterogeneity in the alloy will alter the experimental observations. Although reaction (4) starts to occur at the last, the eutectic formation of (Al), Si, ��-AlMnSi and ��-AlFeSi dominates the solidification procedure as evidenced in Fig. 16. The Scheil calculation ended with the eutectic solidification at about 545 ��C (with a residual liquid of 1%), which agrees well with the completion temperature of 546 ��C at 5 ��C/s [23]. Lowering the cooling rate makes the solidification shift toward the equilibrium calculation. As shown in Fig. 16, the solidification completed at much higher temperature (575 ��C) at lower cooling rates (0.3 and 0.7 ��C /s).
5 Conclusions
1) The Al-Fe-Si ternary description has been deeply revised over the entire compositional range and significant improvements were made on the calculated liquidus surface.
2) The Al-Mn-Si system was refined in the Al-rich region by adopting new models for ��-AlMnSi and ��-AlMnSi. The extended solubility of the ��-AlMnSi phase into the Al-Fe-Mn-Si quaternary system was modeled. A reliable Al-rich thermodynamic description was derived for the Al-Fe-Mn-Si quaternary system for the first time.
3) The obtained thermodynamic descriptions were implemented into the TCAL database and extensively validated by phase diagram calculations and solidification simulations. The resulting updated database can reliably predict the phase formation in multi-component alloy systems and industrial aluminum alloys.
References
[1] LACAZE J, ELENO L, SUNDMAN B. Thermodynamic assessment of the aluminum corner of the Al-Fe-Mn-Si system [J]. Metall Mater Trans A, 2010, 41: 2208-2215.
[2] ANSARA I, DINSDALE A T, RAND M H. COST 507-Definition of thermochemical and thermophysical properties to provide a database for the development of new light alloys, volume 2: Thermochemical database for light metal alloys [M]. Brussels: European Commission, 1998.
[3] ELENO L, VEZELY J, SUNDMAN B, CIESLAR M, LACAZE J. Assessment of the Al-corner of the ternary Al-Fe-Si system [J]. Mater Sci Forum, 2010, 649: 523-528.
[4] KAUFMAN L, BERNSTEIN H. Computer calculations of phase diagrams [M]. New York, USA: Academic Press, 1970.
[5] LUKAS H L, FRIES S G, SUNDMAN B. Computational thermodynamics: the Calphad method [M]. Cambridge, UK: Cambridge University Press, 2007.
[6] MASON P, CHEN H L. Applying computational thermodynamics to industrial aluminum alloys [J]. Aluminum, 2013, 1-2: 64-66.
[7] DU Y, SCHUSTER J C, LIU Z K, HU R X, NASH P, SUN W H, ZHANG W W, WANG J, ZHANG L J, TANG C Y, ZHU Z J, LIU S H, OUYANG Y F, ZHANG W Q, KRENDELSBERGER N. A thermodynamic description of the Al-Fe-Si system over the whole composition and temperature ranges via a hybrid approach of Calphad and key experiments [J]. Intermetallics, 2008, 16: 554-570.
[8] KRENDELSBERGER N, WEITZER F, SCHUSTER J C. On the reaction scheme and liquidus surface in the ternary system Al-Fe-Si [J]. Metall Mater Trans A, 2007, 38: 1681-1991.
[9] MARKER M C J,  B, EFFENBERGER H S, SCHMETTERER C. Phase equilibria and structural investigations in the system Al-Fe-Si [J]. Intermetallics, 2011, 19: 1919-1929.
[10] PONTEVICHI S, BOSSELET F, BARBEAU F, PERONNET M, VIALA J C. Solid-liquid phase equilibria in the Al-Fe-Si system at 727 ��C [J]. J Phase Equilib Diffus, 2004, 25: 528-537.
[11] BOSSELET F, PONTEVICHI S, SACERDOTE-PERONNET M, VIALA J C. Experimental measurement of the Al-Fe-Si isothermal section at 1000 K [J]. J Phys IV, 2004, 122: 41-46.
[12] TAKEDA H P, MUTUZAKI K. The equilibrium diagram of the iron-aluminum-silicon system [J]. Tetsu to Hagane, 1940, 26: 335- 361.
[13] MUNSON D. A clarification of the phases occurring in aluminum- rich aluminum-iron-silicon alloys with particular reference to the ternary phase ��-AlFeSi [J]. J Inst Met, 1967, 95: 217-219.
[14] ZAKHAROV A M, GU'DIN I T, ARNOL'D A A, MATSENKO Y A. Phase diagram of the aluminium-silicon-iron system in the concentration range of 10%-14% Si and 0-3% Fe [J]. Russ Metall, 1988, 3: 177-180.
[15] GWYER A G C, PHILLIPS H W L. The ternary system: Aluminum-silicon-iron [J]. J Inst Met, 1927, 38: 44-83.
[16] ARMAND M. On the phases in the ternary system aluminum-iron-silicon [J]. Comp Rend Acad Sci Paris, 1952, 235: 1506-1508.
[17] DU Y, SCHUSTER J C, WEITZER F. A thermodynamic description of the Al-Mn-Si system over the entire composition and temperature ranges [J]. Metall Mater Trans A, 2004, 35: 1613-1628.
[18] DU Y, WANG J, ZHOU J, SCHUSTER J C, SCHMID-FETZER R, OHNO M, LIU Z-K, SHANG S, XU H, ZHANG W. Reassessment of the Al-Mn system and thermodynamic description of the Al-Mg- Mn system over the whole composition range [J]. Int J Mater Res, 2007, 98: 855-871.
[19] ROBINSON K. The structure of ��(AlMnSi)-Mn3SiAl9 [J]. Acta Crystalogr, 1952, 5: 397-403.
[20] ROBINSON J A J, HAYES F H, SERNEELS A, WEITZER F, ROGL P. Smith thermal analysis studies of Al-rich regions of the Al-Mn, Al-Mn-Fe and Al-Mn-Si system [C]//COST 507, volume 1: Proceedings of the Final Workshop. Brussels: European Commission, 1998: 230-235.
[21] BARLOCK J G, MONDOLFO L F. Structure of some aluminum-iron-magnesium-silicon alloys [J]. Z Metallkd, 1975, 66: 605-611.
[22] MONDOLFO L F. Aluminum alloys: Structures and properties [M]. London: Butter Worths, 1976.
[23] L, CHAI G C, TAMMINEN J. Solidification characteristics of aluminum alloys, volumes 1 and 2 [M]. Oslo: Universitetsforlaget AS, 1990.
[24] WANG N, FLATOY J E, LI Y J, MARTHINSEN K. Evolution in microstructure and mechanical properties during back-annealing of AlMnFeSi alloy [J]. Transactions of Nonferrous Metals Society of China, 2012, 22: 1878-1883.
[25] ANDERSSON J O, HELANDER T, HOEGLUND L, SHI P, SUNDMAN B. Thermo-Calc & DICTRA, computational tools for materials science [J]. Calphad, 2002, 26: 273-312.
[26] KUNDIN J, CHEN H L, SIQUIERI R, EMMERICH H, SCHMID-FETZER R. Investigation of heterogeneous nucleation in a peritectic AlNi alloy [J]. Eur Phys J Plus, 2011, 126: 96.
Al-Fe-Si��Al-Mn-Si��Al-Fe-Mn-Si��ϵ����ѧ�����ĸ���
�º���1���� ��1���� ��2��Johan BRATBERG1, Anders 1
1. Thermo-Calc Software AB, SE-11364 Stockholm, Sweden��
2. ���ϴ�ѧ ��ĩұ������ص�ʵ���ң���ɳ410083
ժ Ҫ������Calphad������Al-Fe-Mn-Si��Ԫϵ��������ϵ��������ѧ���������ȣ�ͨ���������������µ�ʵ���о�����Լ��Բ�����Ԫ������Ӧ���µ�����ѧģ�ͣ�����Al-Fe-Si��ϵ������ѧ�����������ظ����������ɷַ�Χ�ڡ������Ǹ�Al�ǵ�Һ����ͶӰͼ�������Ԫ�������-AlMnSi�ͦ�-AlMnSi�����µ�ģ�ͣ�����Al-Mn-Si��ϵ��Al�ǵ�����ѧ������Ȼ��ͨ��ģ���-AlMnSi����Al-Fe-Mn-Si��ϵ�еĹ��ܶȣ��Ż�Al-Fe-Mn-Si��Ԫϵ��Al�ǵ�����ѧ���������Ż�ʱ���Ԧ�-AlMnSi�����⿼�Dz�����������������ȷ���䲻����Al-Fe-Si��Ԫϵ�б���ȶ����������õ�����ѧ��������TCAL���ݿ⣬ͨ��һϵ�е���ƽ�����������ģ�⡢�Լ�����ҵ���Ͻ��ʵ�����ݵıȽϣ�������õ�����ѧ��������ȫ�����֤�����º��TCAL���ݿ��ܹ��ɿ���Ԥ��Al-Fe-Si����Al-Fe-Mn-Si���Ͻ��е����γɡ�
�ؼ��ʣ�Al-Fe-Si��Al-Fe-Mn-Si�����Ͻ�����ѧģ�⣻����
(Edited by Hua YANG)
Corresponding author: Hai-Lin CHEN; Tel: +46-8-4105-7817; E-mail: hailin@thermocalc.se
DOI: 10.1016/S1003-6326(14)63310-0
Abstract: A thermodynamic assessment of the Al-Fe-Mn-Si quaternary system and its subsystems was performed by the Calphad method. First, the Al-Fe-Si ternary description was deeply revised by considering the most recent experimental investigations and employing new models to ternary compounds. Significant improvements were made on the calculated liquidus projection over the entire compositional range, especially in the Al-rich corner. The Al-Mn-Si system was refined in the Al-rich region by adopting new models for the two ternary compounds, ��-AlMnSi and ��-AlMnSi. The extended solubility of the ��-AlMnSi phase into the Al-Fe-Mn-Si quaternary system was modeled to reproduce the phase equilibria in the Al-rich region. Special cares were taken in order to prevent ��-AlMnSi from becoming stable in the Al-Fe-Si ternary system. The obtained thermodynamic descriptions were then implemented into the TCAL database, and extensively validated with phase equilibrium calculations and solidification simulations against experimental data/information from commercial aluminum alloys. The updated TCAL database can reliably predict the phase formation in Al-Fe-Si- and Al-Fe-Mn-Si-based aluminum alloys.
