

J. Cent. South Univ. (2021) 28: 1813-1828
DOI: https://doi.org/10.1007/s11771-021-4663-4

Filter algorithm based on cochlear mechanics and neuron filter mechanism and application on enhancement of audio signals
GAO Wa(����)1, KAN Yue(����)2, ZHA Fu-sheng(�鸻��)3
1. College of Furnishings and Industrial Design, Nanjing Forestry University, Nanjing 210037, China;
2. School of Mechanical and Power Engineering, Henan Polytechnic University, Jiaozuo 454003, China;
3. The State Key Laboratory of Robotics and System, Harbin Institute of Technology, Harbin 150001, China
 Central South University Press and Springer-Verlag GmbH Germany, part of Springer Nature 2021
Abstract:
A filter algorithm based on cochlear mechanics and neuron filter mechanism is proposed from the view point of vibration. It helps to solve the problem that the non-linear amplification is rarely considered in studying the auditory filters. A cochlear mechanical transduction model is built to illustrate the audio signals processing procedure in cochlea, and then the neuron filter mechanism is modeled to indirectly obtain the outputs with the cochlear properties of frequency tuning and non-linear amplification. The mathematic description of the proposed algorithm is derived by the two models. The parameter space, the parameter selection rules and the error correction of the proposed algorithm are discussed. The unit impulse responses in the time domain and the frequency domain are simulated and compared to probe into the characteristics of the proposed algorithm. Then a 24-channel filter bank is built based on the proposed algorithm and applied to the enhancements of the audio signals. The experiments and comparisons verify that, the proposed algorithm can effectively divide the audio signals into different frequencies, significantly enhance the high frequency parts, and provide positive impacts on the performance of speech enhancement in different noise environments, especially for the babble noise and the volvo noise.
Key words:
cochlea; neuron filter; audio signal processing; speech enhancement��
Cite this article as:
GAO Wa, KAN Yue, ZHA Fu-sheng. Filter algorithm based on cochlear mechanics and neuron filter mechanism and application on enhancement of audio signals [J]. Journal of Central South University, 2021, 28(6): 1813-1828.
DOI:https://dx.doi.org/https://doi.org/10.1007/s11771-021-4663-41 Introduction
Cochlea, which can distinguish sounds of different frequencies and enhance the high frequency part of sound signals, plays a critical role in the human auditory system [1]. Many authors use a variety of ways to simulate its performance for various purposes from the bionics point of view and have proposed many different filter algorithms for audio signal processing [2-4]. For example, the auditory filters, including the resonance filter, the rounded-exponential (ROEX) filter, the gammatone filter (GTF), and the corresponding improved auditory filters including the dual resonance non-linear (DRNL) filter, the gammachirp filter (GCF), the gammawarp filter, the all-pole gammatone filter (APGF), the one-zero gammatone filter (OZGF), etc., are presented to simulate the property of frequency tuning by modelling cochlea and fitting the cochlear electrophysiologic responses [5-9]. The Bark scales and the Mel scales which are widely used for filter banks in speech decomposition and feature extraction are proposed to simulate the properties of frequency tuning and auditory masking [10-12]. In recent years, these algorithms are applied to the fields of audio signal processing and hearing science for audio signal decomposition, speech recognition, and speech enhancements, etc [13]. However, the cochlear performance of non-linear amplification, which shows the enhancement in the high frequency part of audio signals, is rarely considered in studying the auditory filter algorithms. It can help human beings to obtain sound information much more effectively from complex environments [14, 15].
To solve this problem, the modelling of neuron filter mechanism is introduced in this research considering that the cochlea directly connects with the auditory neurons (ANs) by the synapses in the audio signal processing pathway of the human auditory system. The work of Fortune and Rose suggested that, the neuron filtering function comes from the short-term synaptic plasticity and the temporal filtering in neuron might be enhanced by the integration of short-term synaptic depression and facilitation [16]. TONG et al [17] proposed a two-compartment synaptic model to increase the information processing capacity of neurons by allowing inputs to be locally filtered and adjusted. HIRATANI et al [18] suggested that the synaptic plasticity approximates a sample-based Bayesian filtering algorithm known as particle filtering by constructing a simple dendritic neuron model. Currently, a growing body of research on synapses, including synaptic model, artificial synapses, etc., show the short-term synaptic plasticity, achieves the function of filter in neuron and enhances the input signals [19-21]. Based on the above analyses, since the ANs are able to keep the characteristics of cochlear outputs, the non-linear amplification of the cochlea can be indirectly simulated by probing into the synaptic change in the filter process of AN. In this way, the output of AN filter model can show the characteristics of cochlear outputs while sound signals are transmitted into human ear. It provides a feasible way to simulate the properties of frequency tuning and non-linear amplification simultaneously.
For vibrations are widely found in cochlea and neurons, the proposed filter algorithm is studied from the vibration point of view. Our previous work has presented a neuron filter model based on vibration theory, which shows the filter property by simulating the short-term synaptic plasticity [22, 23]. It also provides the basis for the further research on audio signal processing. The objective of this paper is to propose a filter algorithm to simulate the properties of frequency tuning and non-linear amplification simultaneously and explore its application of the audio signal enhancement. The remainder of this paper is organized as follows. Section 2 presents a filter algorithm based on cochlear mechanics and neuron filter mechanism by modelling the cochlear transduction and the AN filter process. Section 3 shows the parameter analysis of the proposed algorithm including the parameter space, the parameter selection rule and the error correction. Then Section 4 illustrates the performance of the proposed algorithm by the unit impulse responses and the comparisons with other auditory filters. In Section 5, the experiments about application of the proposed algorithm are carried out and some conclusions are given.
2 Methods
When the audio signals in the form of traveling waves are transmitted in the human auditory system, the transmission pathway is from the cochlea to synapses, and then auditory neurons. Two procedures for the audio signals, the mechanical transduction in cochlea and the filter process in AN, are modeled to simulate the properties of frequency tuning and non-linear amplification.
2.1 Mechanical transduction model in cochlea
The basilar membrane (BM) vibrates at different positions in response to sounds of different frequencies, and the tectorial membrane (TM) linked with outer hair cells (OHCs) behaves like a second, independently tuned resonator to achieve the active amplification of sound signals. Assume that the cochlea is filled by incompressible, inviscid and irrotational fluid. The BM is described as a collection of infinitesimal segments, and each segment of the BM can be seen as a single degree of freedom (SDOF) vibration system, as shown in Figure 1. The responses of these SDOF vibration systems reflect the cochlear frequency tuning property. The mechanical relationship among the BM, the OHCs and the TM in the cross section of cochlea, which can be thought of as a simplified model of the micromechanical model for the organ of Corti structures in Ref. [24], is illustrated in Figure 2.
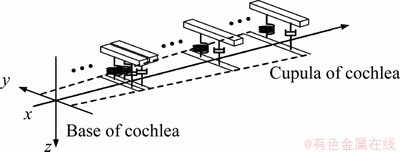
Figure 1 Equivalent vibration systems of BM segments
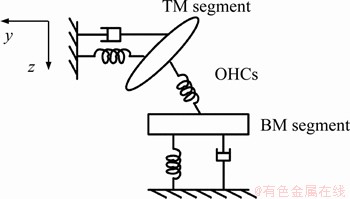
Figure 2 Mechanical relationship of BM, OHCs and TM in cochlear cross section
When sounds are transmitted, for each BM segment, the vibration can be given:

 (1)
(1)
where the terms mbm, kbm are the mass, the stiffness of the BM segment, respectively; h is the viscosity; mhy represents the fluid coupling between the BM segments; fhy represents the force generated by the cochlear internal fluid relative to the BM; and fohc represents the force generated by the OHCs. x and z are the position and the vibration displacement of BM segment, respectively; t is the time; l is the length of the BM segment along x-axis; fhy is given:
 (2)
(2)
where ahy is the negative acceleration generated by input signals; and chy is the suitable positive constant.
TM behaves approximately like the resonance at frequencies close to the characteristic frequencies of the BM. The vibration of TM segment is given:
 (3)
(3)
where mtm and ktm are the mass, the stiffness of TM segment, respectively; co is the coupling constant. At resonance, it leads:
 (4)
(4)
Thus, fohc can be written as:
 (5)
(5)
where ko is the stiffness.
Denote U(t) as the input. Putting all the components together, the cochlear responses obtained by the vibrations of BMs can be written as:
 (6)
(6)
where

2.2 Filter model of auditory neuron
Denote the sampling instant tn with t0=0 and t0<>1<>2<��<>n. n��N, and N is the set of integers. Eq. (6) can be changed into the form of the first-order differential equations as:
 (7)
(7)
For ANs deliver and encode information by the discrete sequences, assume that zn and yn are information segments carried by ANs. Eq. (7) is solved by the Runge-Kutta numerical method. It yields:
 (8)
(8)
where hs is the step size of Runge-Kutta numerical method, and ��(x)=2M(x)��Hhs; ��zn and ��yn are the increments of z and y for the n-th iteration, respectively. The numerical solution of Eq. (6) is shown by:
 (9)
(9)
As our previous work mentioned in Ref. [22], ��zn and ��yn are exchanged to simulate the temporal filtering of biological neuron. It yields:
 (10)
(10)
Substituting Eq. (8) into Eq. (10), the mathematical equation of the AN filter model is given by:
 (11)
(11)
where

 .
.
The matrix D describes the state of the short-term synaptic plasticity in AN. By adjusting parameters d11, d12, d21 and d22, D is able to show the strengthening or weakening of the short-term synaptic plasticity. The matrix R represents the initialized state of AN.
2.3 Mathematical description of proposed algorithm
According to the Theorem shown in our previous work Ref. [23], the parameters of D satisfy the conditions shown:
 (12)
(12)
Considering Eqs. (8) and (12) together with the absolute stability condition of Runge-Kutta numerical method, the step length condition is given:
 (13)
(13)
Then, the parameter rule of D, which shows the change of the short-term synaptic plasticity when the cochlear information properties are maintained by AN, is given as:
 (14)
(14)
Substituting Eq. (14) into Eq. (11), the mathematical description of the proposed algorithm is shown as:
 (15)
(15)
where R1=R, and ��0 represents the acuity of the auditiory neurons. When the input delay occurs, Eq. (15) can be rewritten as follows:
 (16)
(16)
where


and S represents the sane physical meaning as ��0; ��n, ��n��(0, 1); and j is the input delayed number.
3 Parameter analysis of proposed algorithm
3.1 Parameter space
When the ANs provide the same acuity for any input, the transfer function of Eq. (15) is given by Eq. (17):
 (17)
(17)
where d22 can be directly obtained by D and R. From the perspective of vibration, Eq. (17) describes an under-damped second-order oscillation system with dual conjugate complex poles. Hence, it satisfies Eq. (18):
 (18)
(18)
The positions of poles satisfy Eq. (19):
 (19)
(19)
where r is the modulus of the denominator characteristic equation of Eq. (17). When r is close to 1, the shape of the response curve has steep sides from the view of filter, and the response peak tends to infinity. Then assume that d12 is the independent variable in Eq. (19). d12 should have real solutions when it is applied for filter. Hence, it yields Eq. (20):
 (20)
(20)
Considering the system stability, the positions of characteristic roots should be located in the unit circle. Thus, 0��r11��2, r11��1 and it yields Eq. (21):
 (21)
(21)
As mentioned above, the parameter space of the proposed algorithm is determined by Eqs. (18), (20) and (21).
3.2 Selection strategy of parameters
While the parameters r11, r21 and d12 change in the parameter space, the shapes of the response curves will change accordingly. Denote r11=0.01 as the parameter initial value. The step size of r21 is 0.01. The input delayed number j is 1. Both the coefficients ��1 and ��1 are 0.1. Some examples of the response curves of the proposed algorithm when r21 increases in the parameter space are shown from right to left in Figure 3(a). The x-axis represents the normalized frequency, and the y-axis represents the amplitude of response. Obviously, the shapes of the response curves are asymmetry in Figure 3(a). The peaks get smaller when r21 increases in parameter space. On the low frequency side, the shape of the response curve on the right side of the peak is steeper than that on the left side of the peak. It meets the shape of the cochlear response from the electrophysiological view. Hence, the selection strategy of parameters is developed as follows.
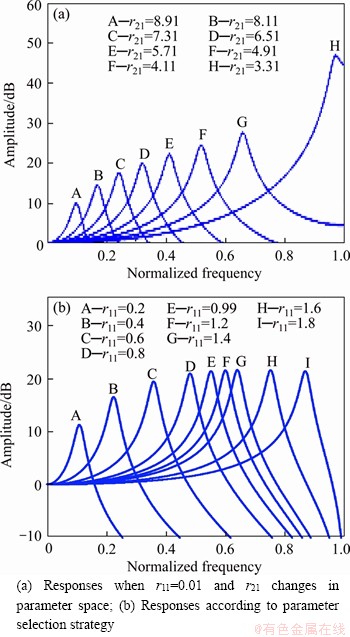
Figure 3 Responses of proposed algorithm:
Firstly, define P=r2=0.95 as the filter design coefficient. The parameter initial value r11 is 0.01. Let r11 increase progressively with the precision of 0.01 in the parameter space, and r11��1.
Then, for each fixed r11, r21 is determined by searching the minimum peak of amplitude response with the precision of 0.01 in the parameter space. d12 is limited to the parameter space and determined by Eq. (19).
According to the above parametric strategy, the amplitude-frequency responses of proposed algorithm are shown in Figure 3(b). The x-axis represents the normalized frequency, and the y-axis represents the amplitude. The response shapes and the peaks display some similarities to the cochlear physiological data. For example, the response shape shows a similar asymmetry as Figure 4 [24] and Figure 5 [25], and the amplitude and the peak envelope are close to that of the cochlear data shown in Figure 4 [24].
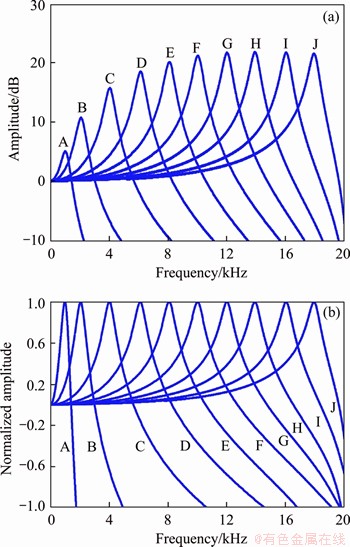
Figure 4 (a) Amplitude-frequency responses in auditory processing channels; (b) Normalized amplitude responses for channels
3.3 Parameter equations
The response peak frequency of the proposed algorithm and the cochlear characteristic frequency (CF) should be equal when the proposed algorithm provides the properties of frequency tuning and the non-linear amplification similar as the cochlea. It can be used for correcting the error between the peak frequency and the CF.
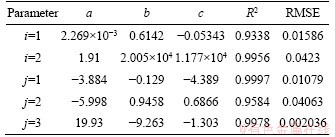
The sampling frequency is set as 44 kHz. According to the selection strategy mentioned above, the fitting equations describing the relationship between the parameter r11 and the peak frequency fp are given by Eqs. (22) and (23):
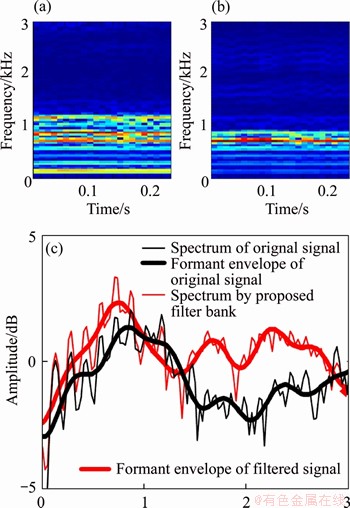
Figure 5 (a) Spectrogram of vowel ��a��;(b) Corresponding spectrogram after ��a�� filtering by proposed filter bank; (c) Spectra of a frame and corresponding formant envelopes before and after filtering by proposed filter bank
 (22)
(22)
 (23)
(23)
where i is the serial number of fitting equations; and ai, bi and ci are the fitting coefficients given in Table 1. When i=1, 0<>p<2000; when i=2,2000�� fp<20000. The fitting equations between r11 and r21 have the same mathematical expression, but with different coefficients and fitting serial numbers. Set j as the fitting serial number of the fitting equations between r11 and r21. When j=1 and j=3, 0<>11��0.1 and 1.4<>11<2, respectively, and the fitting equation is Eq. (22). When j=2, 0.1<>11��1.4 and the fitting equation is Eq. (23). The fitting coefficients are aj, bj and cj. The fitting performance coefficients, R-suqare and RMSE, with 95% confidence intervals are shown in Table 1.
Take the CF with its band between 2 and 20 kHz as an example. The responses of the proposed algorithm can be obtained by Eqs. (15), (22) and (23) when the CF is set as the input of Eq. (22). The relationship between the peak frequency and the CF is shown in Figure 6(a). The x-axis represents the CF, and the y-axis represents the peak frequency of the proposed algorithm. According to Figure 6(a), the two frequencies are unequal. To correct the errors, the relationship between the CF f and the peak frequency fp is given by fitting equation Eq. (24):

 (24)
(24)
where k=1, 2 and 3 are the serial numbers of fitting equations, and Bk, Ck, Dk, Jk, Kk, wi are the fitting coefficients. Eq. (24) can be used as the equation of error correction. The fitting coefficients are shown in Table 2. The error comparison between before and after the error correction is illustrated in Figure 6(b). The x-axis represents sampling points, and the y-axis represents normalized error. The number of sampling points is 2000. The blue solid curve and the red dashed curve show the errors before and after error correction respectively.
Table 1 Coefficients of fitting equations and fitting performances of Eqs. (22) and (23)
Obviously, the errors decrease significantly and the peaks of the proposed algorithm are distributed continuously along the frequency band in the form of one-on-one position. It also means that the CF is nearly the peak frequency of the proposed algorithm after error correction. Thus, the relationship between the parameters of the proposed algorithm and the CF can be obtained in order from Eq. (24) to Eqs. (22) and (23).
4 Simulation and discussion
4.1 Unit impulse responses
The proposed algorithm can be used for establishing different auditory processing channels with different CFs. Here take some channels as the examples to analyze the characteristics of the proposed algorithm by the unit impulse responses. When the CFs are 1, 2, 4, 6, 8, 10, 12, 14, 16 and 18 kHz, respectively, the parameters of the proposed algorithm are obtained by Eqs. (22), (23) and (24) for each channel. Then each channel is stimulated by the unit pulse signal.
Table 2 Coefficients of fitting equations and fitting performances of Eq. (24)
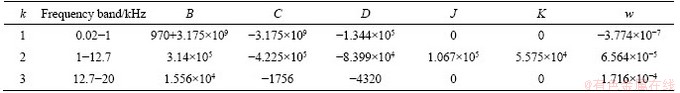
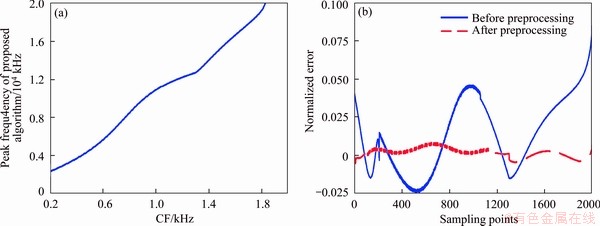
Figure 6 (a) Relationship between peak frequency of proposed algorithm and CF in the band of 2-20 kHz;(b) Comparison between before and after error correction
4.1.1 Responses in frequency domain
As illustrated in Figure 4, the frequency of the response peak in each auditory processing channel is almost equal to the CF. For each response, the shape is not symmetrical between the left and the right side of the CF, and the right of the peak shows steeper than the left. For all the responses shown in Figure 4, the envelope of the peaks illustrates the property of non-linear amplification and the convergence on the high frequency side. The difference between the maximum and the minimum is nearly 23 dB which is a little bit less than the gain data of BM response in Ref. [25]. When the CF decreases, the peak of the response shifts to a lower frequency; the magnitude and the bandwidth of the response are lower; and the resolution of the response is higher. The results mentioned above indicating the characteristics of the non-linear amplification simulated by the proposed algorithm meet the cochlear non-linear amplification to some extent.
4.1.2 Responses in time domain
The responses in time domain (TD) for the different auditory processing channels are shown in Figure 7.
As shown in Figure 7, when the CFs increase, the maximum amplitude and the vibration frequency of the response increase as well, and the time reaching the maximum and the increment of the maximum decrease. Calculating the vibration frequency of each response waveform can find that the frequency is equal to the corresponding CF. Take Figure 7(a) as the example. According to the time shown in x-axis, the vibration frequency of the waveform shown in Figure 7(a) is 1 kHz, which is equal to the CF in Figure 7(a). The above results are nearly consistent with some characteristics of BM impulse responses shown in Figure 8 of Ref. [25]. However, the envelope of the waveform in each channel is quite different from the cochlear response, and the whole response time from the start to the end of the proposed algorithm is the same for each channel. The phenomena are reasonable, for the proposed algorithm has introduced the AN filter model to indirectly obtain the outputs with cochlear properties, and the unit impulse responses essentially occurred at the AN filter model. Hence, the envelope of the unit impulse response and the response time for any input are the same.
4.2 Performance analysis and comparisons
According to the responses in the frequency domain (FD) and the time domain (TD), the detailed properties of the proposed algorithm are summarized as follows: 1) Figures 4(a) and (b) illustrate that the peak shape in the FD is sharp and the skirt falls off rapidly. 2) Figure 4(a) shows that the response shapes in the FD are not symmetric and the skirts on the high-frequency side of the CF are steeper than that on the low-frequency side.

Figure 7 Responses in time domain for auditory processing channels with different CFs:
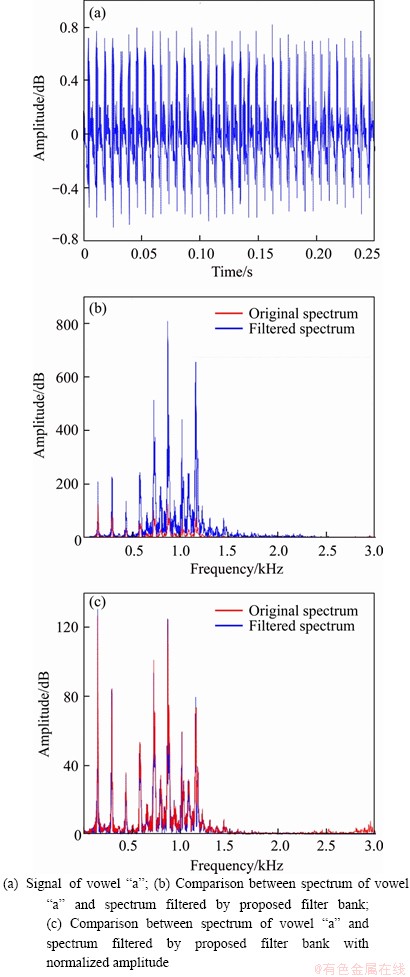
Figure 8 Audio signal and its spectra: (a) Signal of vowel ��a��;(b) Comparison between spectrum of vowel ��a�� and spectrum filtered by proposed filter bank;(c) Comparison between spectrum of vowel ��a�� and spectrum filtered by proposed filter bank with normalized amplitude
3) The envelope of the peaks shown in Figure 4(a) appears to be in the non-linear amplifying characteristic. 4) Figure 4(b) shows that the bandwidth of the response on the high-frequency side of the CF in the FD is larger than that on the low-frequency side. It means the resolution on the low-frequency side is better. 5) Figure 7 shows that the waveforms reflect partial cochlear characteristics, such as the vibration frequency.6) The responses in the FD and the TD of different channels are quite different. Both the peak frequency and the vibration frequency in the TD are equal to the CF of the channel. 7) The proposed algorithm can be described in terms of poles and zeros according to Eq. (16). It can be represented with one zero and one complex- conjugate pair of poles.
As the proposed algorithm can obtain the properties of frequency tuning and non-linear amplification, it is able to be used as an auditory filter. Here the comparison between the proposed algorithm and the three basic auditory filters, i.e., the resonance filter, the ROEX filter and the GTF, are illustrated in Table 3.
Table 3 Performance comparisons between developed algorithm and three basic auditory filters
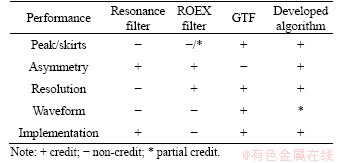
By scoring on five criteria from the view of simulating the physiological characteristics of the cochlea, the performance of the proposed algorithm is better than the other three filters. In addition, as the proposed algorithm can be represented by the second-order transfer function Eq. (16) in Laplace (Pole-Zero) domain, its transfer function is easier than that of the GTF. The proposed algorithm can be used for approximating auditory data and processing real sounds by establishing cascade or parallel filter banks as the resonance filter and the GTF.
5 Applications in audio signal enhancements
A filter bank with 24 channels is built using the proposed algorithm, and the largest CF is about 3.8 kHz. The CFs of the proposed 24-channle filter bank are shown in Figure 9(a), which illustrates the properties of frequency tuning and non-linear amplification. Figure 9(b) shows the frequency responses of the proposed filter bank when the non-linear amplification curve is squeezed to get the amplitude normalization. Figure 7(c), where the blue dotted lines show the CFs of the proposed 24-channles filter bank in low frequency band and the red lines show the corresponding normalized amplitude frequency responses, can be used to confirm the consistency of the CFs. To verify the feasibility and the superiority of the 24-channel filter bank based on the proposed algorithm in audio signal enhancement, different audio signals including pure tones, complex tones, and speech signals are employed to carry out the experiments.
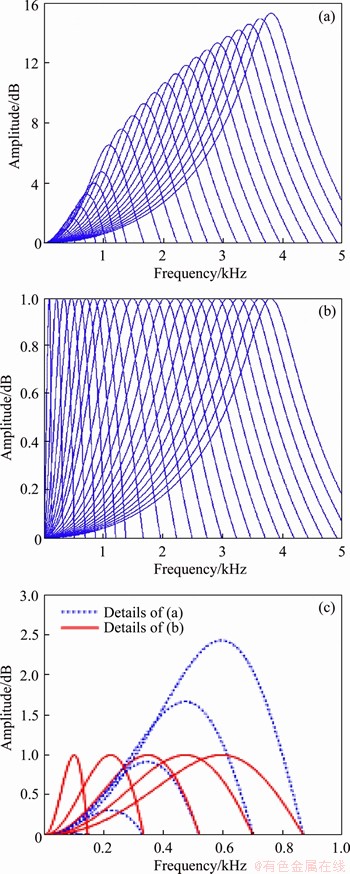
Figure 9 (a) Frequency responses of filter bank with 24 channels built by proposed algorithm; (b) Corresponding normalized amplitude frequency responses; (c) Details to show CFs of filter bank with 24 channels built by proposed algorithm and corresponding normalized amplitude frequency responses in low frequency band
5.1 Enhancement of audio signals without
noises
The audio signals and the results in experiments were discussed from the FD and the TD view, respectively. The spectra and the waveforms of the audio signals before and after filtered by the proposed filter bank were compared respectively. The comparisons with the processing results of the Bark filter bank and the Gammatone filter bank were also given and discussed to show the enhanced frequency tuning property of the proposed filter bank.
5.1.1 Comparisons of spectra
It is clear that the filtered spectrum shows obvious amplitude magnification on the high frequency side (Figure 8(b)). It means that the proposed filter bank is more sensitive for the signals with high frequencies. The spectra in Figure 8(c) are nearly identical in frequency positions and amplitudes. In addition, the pitch frequency obtained by the proposed filter bank shown in Figure 8(b) and (c) is nearly equal to that of the original spectrum. It means that the proposed filter bank can achieve an accurate frequency decomposition.
Obviously, the harmonic structures in high frequency band of the signal illustrated in the right subfigure of Figure 5(a) are much clearer than that in the left. As can be seen from Figure 5(b), the amplitudes of the formant envelopes at the high frequency are enhanced by the proposed filter bank. The above analyses illustrate that the proposed filter bank shows the characteristics of the original signal spectrum with enhancing the amplitude on the high frequency side.
5.1.2 Comparisons of waveforms
If the proposed filter bank can divide the frequencies of an audio signal correctly, the frequency component of the audio signal in each channel is equal to the CF in that channel. Meanwhile, the corresponding output shows an amplified amplitude, which is also the largest in the output signal components of the channel. To verify this, three pure tones with three different frequencies at 200, 1500 and 3000 Hz, were employed to compare the outputs in different channels of the proposed filter bank. The input pure tones are shown in the first line of Figure 10(a), and the filtered results of the three pure tones in three different channels with CF are is, 1500 and 3000 Hz are shown Figures 10(b), (c), (d), respectively.
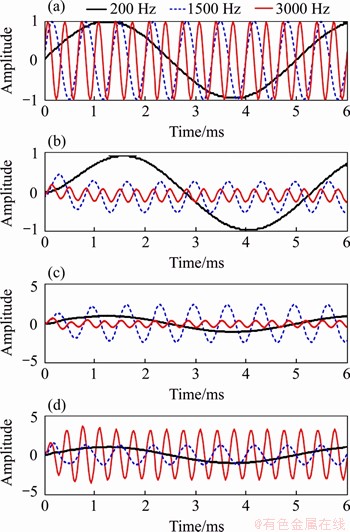
Figure 10 Comparisons between outputs in different channels: (a) Three pure tones with different frequencies at 200, 1500 and 3000 Hz; Filtered results of three pure tones in channels with CF of 200 Hz (b), 1500 Hz (c) and 3000 Hz (d)
Apparently, when the CF of the channel increases, the maximum amplitudes of the filtered waveforms grow with the increase of the frequency of input signals. For example, the maximum amplitudes of the waveforms obtained by the proposed channels with CF at of 200, 1500 and 3000 Hz in Figures 10(b)-(d) are approximately 1, 2.6, 3.2, respectively. Meanwhile, for each channel, the signal whose frequency is nearly equal to the CF can obtain the maximum amplitude on the waveform according to the outputs of the three channels as shown in Figure 10. For example, in the case of the input pure tone with frequency at 3000 Hz, the maximum amplitude of the red line shown in Figure 10(d) is greater than that of Figures 10(b) and (c). It also means that, for the proposed filter bank, even if all the frequencies of the input signals can be amplified in a channel, the maximum amplitude always occurs on the input component whose frequency is equal to the CF of the channel.
5.1.3 Comparisons with Bark filter bank and Gammatone filter bank
To test the feasiblility of the proposed filter bank in audio signal enhancement while it achieves the frequency decomposition of an audio signal, the comparisons with the Bark filter bank and the Gammatone filter bank which are usually used for simulating the cochlear properties in audio signal processing are studied. Two types of signals, the pure tones and the composite tones, were employed in experiments. The frequencies of the pure tones are 200, 1500 and 3000 Hz, respectively. The composite tone is made up of the three frequencies. The comparisons of the three filter banks, i.e., the proposed filter bank, the Bark filter bank and the Gammatone filter bank, for the pure tones and the composite tone are respectively shown in Figure 11.
For the pure tones, the output frequencies of the three filer banks are similar and equal to the input frequencies, and the maximum filtered amplitudes of the proposed filter bank are greater than that of the Bark filter bank and the Gammatone filter bank in the case of the inputs with high frequencies, as shown in Figures 11(b), (d) and (f). For example, in Figure 11(f), when the frequency of input pure tone is 3000 Hz, the maximum amplitude obtained by proposed filter bank is nearly twice as large as that obtained by the Bark filter bank and the Gammatone filter bank, while the maximum amplitude obtained by proposed filter bank is nearly equal to that obtained by the Bark filter bank and a little larger than that obtained by the Gammatone filter bank when the frequency of input pure tone is 200 Hz as shown in Figure 11(b). Meanwhile, for the composite tones, compared the red lines with the blue and the green in Figures 11(c), (e) and (a), the output frequencies of the proposed filter bank follow with that of the other two filter banks, which indicates that the composite tones can be divided into the components with its corresponding frequencies by the proposed filter bank. The property of the sound enhancement in high frequency range also shows up in the composite tones as shown by the red lines in Figures 11(e) and (g).
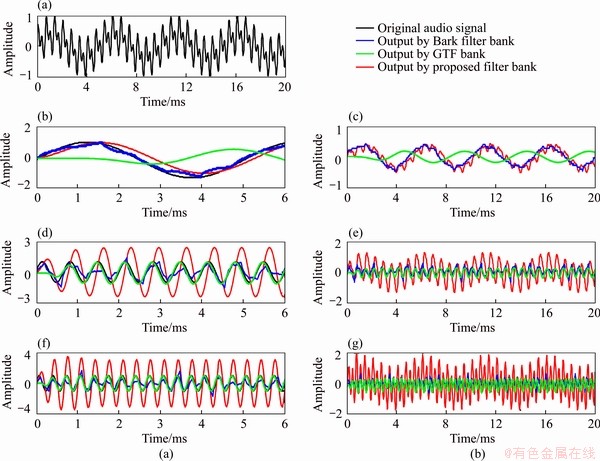
Figure 11 (a) Signal of composite tone; Comparisons for three pure tones with frequencies of 200 Hz (b), 1500 Hz (d) and 3000 Hz (f); Comparisons for composite tone outputs obtained by three filter banks in channels with CF of about 200 Hz (c), 1500 Hz (e) and 3000 Hz (g)
5.2 Enhancement of speech signal in different noise environments
To probe into the performance of the proposed filter bank in noise environments, the enhancement experiments and the comparisons with the bark filter bank and the fast wavelet transform (FWT) method are carried out. The proposed filter bank and the FWT method are denoted as Method I and Method II, respectively. The Daubechies wavelet is used and the decomposition level is 3. Then, the bark filter bank and the proposed filter bank are used into frequency decomposition for preprocessing in different noise environments, and the FWT method is selected to enhance the preprocessing signals. It is used to test the performance of different filter banks in speech enhancement while achieving the frequency decomposition, and is helpful for further studies on feature extraction, speech recognition in noise environments. The bark filter bank with the FWT method and the proposed filter bank with the FWT method are denoted as Method III and Method IV, respectively. Five different noises, including babble noise, volvo noise, white noise, factory noise and pink noise, are used here to mix with speech signals and the noisy speech signals with different signal-to-noise ratios (SNRs) were obtained for the enhancement experiments.
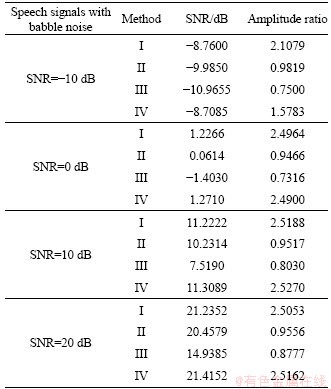
Take the speech signals with babble noises as examples first. The signals with different SNRs are shown in Figure 12(a). For the signals shown in each row of Figure 12(a), the corresponding outputs by the Method I, Method II, Method III and Method IV are illustrated respectively in the same rows of Figures 12(e). It is clear that, the enhanced results in Figures 12(b) and (e) show a better performance in noise suppression and have larger amplitudes in comparison with that in Figures 12(c) and (d). The detailed data obtained by the four methods are illustrated in Table 4 from the views of the SNR and the amplitude ratio respectively. The amplitude ratio by which reflects the contrast of the sound intensity is the rate of the amplitude of the enhanced signals to that of the original noisy signals. According to Table 4, obviously Method I can obtain not only better SNRs, but also nearly 2.51 times larger amplitude ratios than Method II. For example, when the SNR of the speech signal with babble noise is -10 dB, the SNRs of the enhanced signals by Method I and Method II are -8.76 and -9.985 dB, while the corresponding amplitude ratios are 2.1079 and 0.9819, respectively. Method IV shows better SNRs and amplitude ratios compared with Method III, and shows a little larger SNRs and nearly similar average amplitude ratios compared with Method I, while the output of Method III is less good than that of Method II. It means that, if the audio signals need to be divided into different frequencies by the filter banks in noise environments for further research, the proposed filter bank can provide an enhancement output with better SNR and amplitude ratio, while the bark filter bank is opposite.
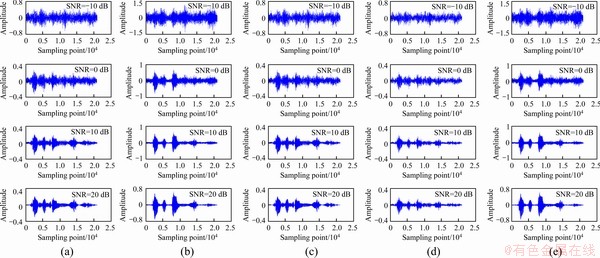
Figure 12 (a) Speech signals with babble noises with different SNRs; (b) Enhanced signals obtained by Method I;(c) Enhanced signals obtained by Method II; (d) Output signals obtained by Method III; (e) Output signals obtained by Method IV
Table 4 Performance of different methods in babble noise environments
The other four types of noisy speech signals with different SNRs were also processed as above, and a series of data were obtained. The SNRs of the signals enhanced by Methods I, II, III and IV are shown in Table 5. Obviously, Methods I and IV obtain better performance for the volvo noise and the factory noise. For example, in the case of original SNR -10 dB, the SNRs of the outputs by Methods I and II are -3.1751 and -10.2534 dB respectively for the volvo noise, and are -5.8133 and -10.1668 dB, respectively for the factory noise.
Table 5 SNRs of signals by different methods in other four noise environments
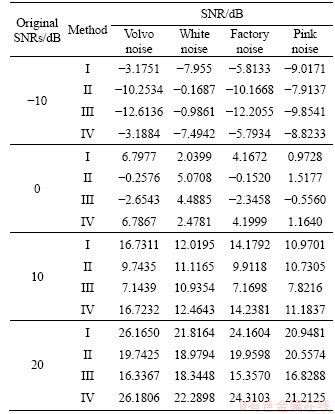
Besides, with regard to the noises of white and pink, Method I shows better performance than Method II when the original signal is with a slightly higher SNR, i.e., 10 and 20 dB. The SNRs of Methods I and IV are nearly similar while the SNRs of Method II are better than that of Method III for different noises. It means that, while achieving frequency division, the proposed filter bank does not affect the performance of outputs but the bank filter bank does significantly.
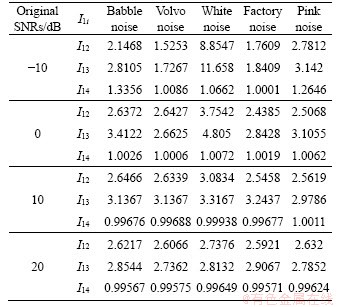
Then for further analysis of these data, let I1i=A1/Ai, where A represents the amplitude ratios and i represents the i-th method. The amplitude ratios of different types of noise environments are given in Table 6. Apparently, I12 and I13 are larger than 1; I14 fluctuates around 1; and the amplitude ratios of Method I is always larger than that of Methods I and III. Hence, the proposed filter bank improves the intensity of the speech signal while enhances the SNR. It also means that the process of frequency division by the proposed filter bank provides a positive impact on the performance of outputs. In addition, it is worth noting that, in the case of the white noise, the I12=8.8547 and I13=11.658 are more than 3 times larger than the average I12 (2.8855) and the average I13 (3.3396),and have decreasing trends when the original SNR increases. It indicates that, since the noises and the speech signals are amplified simultaneously by Method I, the enhanced noises are too large to filter effectively when the original SNRs are -10 dB and 0 dB.
Table 6 Amplitude ratio I1i of signal enhanced by different methods
By combining the experiment results and comparisons above, the proposed filter bank effectivity enhances the speech signals in the environments of babble noises, volvo noises and factory noises than the FWT method from the view of the SNR and the intensity. For the white noise and the pink noise, the proposed filter bank gets better results when the original SNRs are 10 and 20 dB, and the amplitude ratios are always larger than that of the FWT method. Moreover, if the speech with noises needs to be divided into different frequencies, the proposed filter bank shows better performance than the Bark filter bank, and provides a positive impact on audio signal preprocessing process.
6 Conclusions
This research proposed a filter algorithm based on cochlear mechanics and neuron filter mechanism and applied it to the enhancement of audio signals. To derive the mathematical description of the proposed algorithm and indirectly obtain the outputs with cochlear properties of frequency tuning and non-linear amplification, a cochlear mechanical transduction model was built and the neuron filter mechanism was modeled. The corresponding parameter analyses including the parameter space, the selection strategy and the error correction were demonstrated. The unit impulse responses and the performance in TD and FD were discussed to illustrate the characteristics of the proposed algorithm. Then this proposed algorithm was applied to building a 24-channel filter bank to enhance the audio signals. The experiment results on sound signals without noises and the comparisons with the Bark filter bank and the Gammatone filter bank illustrated that, the proposed algorithm can enhance the sound signals in the high frequency part and show the cochlear properties of the frequency tuning and the nonlinear amplification. The experiments on the speech signal enhancement in different noise environments show the effectiveness of the proposed algorithm for the babble noise, the volvo noise and the factory noise, etc., and the positive impact on audio signal preprocessing process. In the future, the proposed algorithm could be extended to the enhancement and the feature extraction of the speech signals in complex noise environments.
Contributors
The overarching research goals were developed by GAO Wa. KAN Yue and ZHA Fu-sheng conducted the literature review. GAO Wa established the models, proposed the algorithm, performed the experiments, and wrote the first draft of the manuscript. GAO Wa and KAN Yue reviewed the whole manuscript. All the authors have read and reviewed the final manuscript.
Conflict of interest
GAO Wa, KAN Yue, ZHA Fu-sheng declare that they have no conflict of interest.
References
[1] DRIVER E C, KELLEY M W. Development of the cochlea [J]. Development, 2020, 147(12): dev162263. DOI: 10.1242/ dev.162263.
[2] WIRTZFELD M R, POURMAND N, PARSA V, BRUCE I C. Predicting the quality of enhanced wideband speech with a cochlear model [J]. The Journal of the Acoustical Society of America, 2017, 142(3): EL319. DOI: 10.1121/1.5003785.
[3] RUSSO M, STELLA M, SIKORA M, PEKIC V. Robust cochlear-model-based speech recognition [J]. Computers, 2019, 8(1): 5. DOI: 10.3390/computers8010005.
[4] SUN Ying, WERNER V, ZHANG Xue-ying. A robust feature extraction approach based on an auditory model for classification of speech and expressiveness [J]. Journal of Central South University, 2012, 19(2): 504-510. DOI: 10.1007/s11771-012-1032-3.
[5] Al-Dayyeni, Wisam Subhi, P SUN, J QIN. Investigations of auditory filters based excitation patterns for assessment of noise induced hearing loss [J]. Archives of Acoustics, 2018, 43(3): 477-486. DOI: 10.24425/123919.
[6] UNOKI M, IRINO T, GLASBERG B, MOORE B C, PATTERSON R D. Comparison of the roex and gammachirp filters as representations of the auditory filter [J]. The Journal of the Acoustical Society of America, 2006, 120(3): 1474-1492. DOI: 10.1121/1.2228539.
[7] KATES J M, PRABHU S. The dynamic gammawarp auditory filterbank [J]. The Journal of the Acoustical Society of America, 2018, 143(3): 1603-1612. DOI: 10.1121/ 1.5027827.
[8] TABIBI S, KEGEL A, LAI Wai-kong, DILLIER N. Investigating the use of a Gammatone filterbank for a cochlear implant coding strategy [J]. Journal of Neuroscience Methods, 2017, 277: 63-74. DOI: 10.1016/j.jneumeth.2016. 12.004.
[9] KATSIAMIS A G, DRAKAKIS E M, LYON R F. Practical gammatone-like filters for auditory processing [J]. EURASIP Journal on Audio, Speech, and Music Processing, 2007, 2007: 1-15. DOI: 10.1155/2007/63685.
[10] NECCIARI T, HOLIGHAUS N, BALAZS P, PRUSA Z, MAJDAK P, DERRIEN O. Audlet filter banks: A versatile analysis/synthesis framework using auditory frequency scales [J]. Applied Sciences, 2018, 8(1): 96. DOI: 10.3390/ app8010096.
[11] SUBBA RAMAIAH V, RAJESWARA RAO R. A novel approach for speaker diarization system using TMFCC parameterization and Lion optimization [J]. Journal of Central South University, 2017, 24(11): 2649-2663. DOI: 10.1007/s11771-017-3678-3.
[12] JIA Hai-rong, ZHANG Xue-ying, BAI Jing. A continuous differentiable wavelet threshold function for speech enhancement [J]. Journal of Central South University, 2013, 20(8): 2219-2225. DOI: 10.1007/s11771-013-1727-0.
[13] LIU Fang-qi, DEMOSTHENOUS A, YASIN I. Auditory filter-bank compression improves estimation of signal-to- noise ratio for speech in noise [J]. The Journal of the Acoustical Society of America, 2020, 147(5): 3197. DOI: 10.1121/10.0001168.
[14] FALLAH E, STRIMBU C E, OLSON E S. Nonlinearity and amplification in cochlear responses to single and multi-tone stimuli [J]. Hearing Research, 2019, 377: 271-281. DOI: 10.1016/j.heares.2019.04.001.
[15] CHARAZIAK K K, DONG Wei, ALTOE A, SHERA C A. Asymmetry and microstructure of temporal-suppression patterns in basilar-membrane responses to clicks: Relation to tonal suppression and traveling-wave dispersion [J]. Journal of the Association for Research in Otolaryngology, 2020, 21(2): 151-170. DOI: 10.1007/s10162-020-00747-2.
[16] FORTUNE E S, ROSE G J. Short-term synaptic plasticity as a temporal filter [J]. Trends in Neurosciences, 2001, 24(7): 381-385. DOI: 10.1016/S0166-2236(00)01835-X.
[17] TONG Ru-di, EMPTAGE N J, PADAMSEY Z. A two-compartment model of synaptic computation and plasticity [J]. Molecular Brain, 2020, 13(1): 79. DOI: 10.1186/s13041-020-00617-1.
[18] HIRATANI N, FUKAI T. Redundancy in synaptic connections enables neurons to learn optimally [J]. Proceedings of the National Academy of Sciences of the United States of America, 2018, 115(29): E6871-E6879. DOI: 10.1073/pnas.1803274115.
[19] LIU Ya-qian, ZHONG Jian-feng, LI En-long, YANG Hui-huang, WANG Xiu-mei, LAI Deng-xiao, CHEN Hui-peng, GUO Tai-liang. Self-powered artificial synapses actuated by triboelectric nanogenerator [J]. Nano Energy, 2019, 60: 377-384. DOI: 10.1016/j.nanoen.2019.03.079.
[20] WAN Xiang, YANG Yi, FENG Ping, SHI Yi, WAN Qing. Short-term plasticity and synaptic filtering emulated in electrolyte-gated IGZO transistors [J]. IEEE Electron Device Letters, 2016, 37(3): 299-302. DOI: 10.1109/LED.2016. 2517080.
[21] HE Y, KULASIRI D, LIANG J. A mathematical model of synaptotagmin 7 revealing functional importance of short-term synaptic plasticity [J]. Neural Regeneration Research, 2019, 14(4): 621-631. DOI: 10.4103/1673- 5374.247466.
[22] ZHA Fu-sheng, CHEN Jia-xuan, LI Man-tian, GUO Wei, WANG Peng-fei. Development of a fast filtering algorithm via vibration systems approach and application to a class of portable vital signs monitoring systems [J]. Neurocomputing, 2012, 97: 1-8. DOI: 10.1016/j.neucom.2012.06.004.
[23] GAO Wa, ZHA Fu-sheng, SONG Bao-yu, LI Man-tian. Fast filtering algorithm based on vibration systems and neural information exchange and its application to micro motion robot [J]. Chinese Physics B, 2014, 23(1): 163-173. (in Chinese)
[24] RAMAMOORTHY S, DEO N V, GROSH K. A mechano-electro-acoustical model for the cochlea: Response to acoustic stimuli [J]. The Journal of the Acoustical Society of America, 2007, 121(5): 2758-2773. DOI: 10.1121/ 1.2713725.
[25] JULIEN M, KARL G. The effect of tectorial membrane and basilar membrane longitudinal coupling in cochlear mechanics [J]. The Journal of the Acoustical Society of America, 2009, 127(3): 1411-1421. DOI: 10.1121/1.329 0995.
(Edited by ZHENG Yu-tong)
���ĵ���
���ڶ�����ѧ����Ԫ�˲����Ƶ��˲��㷨�����������ź���ǿ�е�Ӧ��
ժҪ�����Ĵ������۽Ƕ����һ�ֻ��ڶ�����ѧ����Ԫ�˲����Ƶ��˲��㷨��������ģ�������˲����о��н��ٿ��ǵ��ķ����ԷŴ����ԡ�ͨ������������ѧģ����ģ����ϵ������źŴ������̣�����ͨ��������Ԫ�˲�ģ������ȡ���ɶ�����ѧģ�ʹ����ġ��߱�Ƶ�ʷֽ�ͷ����ԷŴ����Ե�������Ϣ���Ӷ�������ڶ�����ѧ����Ԫ�˲����Ƶ��˲��㷨����������㷨�IJ����ռ䡢����ѡ����Ժ�������������˷�����ͨ��ʱ���Ƶ��ij弤��Ӧ�����˸��㷨���ԡ�ʹ��������㷨����24ͨ���˲����鲢Ӧ���������ź���ǿ�������������������㷨�ܹ���Чʵ�������źŵ�Ƶ�ʷֽ⣬ͬʱ��ǿ�ź��еĸ�Ƶ���֣����ܹ���Ч��ǿ��ͬ���������µ������źţ������Ƕ���babble������volvo���������е������ź���ǿЧ�����á�
�ؼ��ʣ����ϣ���Ԫ�˲��������źŴ�����������ǿ
Foundation item: Project(17KJB510029) supported by the Natural Science Foundation of the Jiangsu Higher Education Institutions, China; Project(GXL2017004) supported by the Scientific Research Foundation of Nanjing Forestry University, China; Project(202102210132) supported by the Important Project of Science and Technology of Henan Province, China; Project(B2019-51) supported by the Scientific Research Foundation of Henan Polytechnic University, China; Project(51521003) supported by the Foundation for Innovative Research Groups of the National Natural Science Foundation of China; Project(KQTD2016112515134654) supported by Shenzhen Science and Technology Program, China
Received date: 2020-07-11; Accepted date: 2020-10-14
Corresponding author: KAN Yue, PhD, Lecturer; Tel: +86-18137209579; E-mail: kyh_7372@163.com; ORCID: https://orcid.org/0000- 0002-1635-9056
Abstract: A filter algorithm based on cochlear mechanics and neuron filter mechanism is proposed from the view point of vibration. It helps to solve the problem that the non-linear amplification is rarely considered in studying the auditory filters. A cochlear mechanical transduction model is built to illustrate the audio signals processing procedure in cochlea, and then the neuron filter mechanism is modeled to indirectly obtain the outputs with the cochlear properties of frequency tuning and non-linear amplification. The mathematic description of the proposed algorithm is derived by the two models. The parameter space, the parameter selection rules and the error correction of the proposed algorithm are discussed. The unit impulse responses in the time domain and the frequency domain are simulated and compared to probe into the characteristics of the proposed algorithm. Then a 24-channel filter bank is built based on the proposed algorithm and applied to the enhancements of the audio signals. The experiments and comparisons verify that, the proposed algorithm can effectively divide the audio signals into different frequencies, significantly enhance the high frequency parts, and provide positive impacts on the performance of speech enhancement in different noise environments, especially for the babble noise and the volvo noise.
