

J. Cent. South Univ. (2018) 25: 379-394
DOI: https://doi.org/10.1007/s11771-018-3744-5

Risk assessment model of tunnel water inrush based on improved attribute mathematical theory
YANG Xiao-li(��С��), ZHANG Sheng(��ʤ)
School of Civil Engineering, Central South University, Changsha 410075, China
 Central South University Press and Springer-Verlag GmbH Germany, part of Springer Nature 2018
Abstract:
Tunnel water inrush is one of the common geological disasters in the underground engineering construction. In order to effectively evaluate and control the occurrence of water inrush, the risk assessment model of tunnel water inrush was proposed based on improved attribute mathematical theory. The trigonometric functions were adopted to optimize the attribute mathematical theory, avoiding the influence of mutation points and linear variation zones in traditional linear measurement functions on the accuracy of the model. Based on comprehensive analysis of various factors, five parameters were selected as the evaluation indicators for the model, including tunnel head pressure, permeability coefficient of surrounding rock, crushing degree of surrounding rock, relative angle of joint plane and tunnel section size, under the principle of dimension rationality, independence, directness and quantification. The indicator classifications were determined. The links among measured data were analyzed in detail, and the objective weight of each indicator was determined by using similar weight method. Thereby the tunnel water inrush risk assessment model is established and applied in four target segments of two different tunnels in engineering. The evaluation results and the actual excavation data agree well, which indicates that the model is of high credibility and feasibility.
Key words:
Cite this article as:
YANG Xiao-li, ZHANG Sheng. Risk assessment model of tunnel water inrush based on improved attribute mathematical theory [J]. Journal of Central South University, 2018, 25(2): 379�C391.
DOI:https://dx.doi.org/https://doi.org/10.1007/s11771-018-3744-51 Introduction
With the rapid development of China��s transportation industry, tunnel constructions are increasingly exposed to geological disasters of water inrush, rock burst, landslides and so on. Water inrush is one of the common hazards in the process of tunnel construction, especially in karst areas, which seriously threatens the safety of workers�� life and properties. For instance, in history water inrush accidents have occurred many times in Huaying Mountain tunnel of Guang��an�CLinshui highway, Wulong tunnel, Qiyue Mountain tunnel and so on, each of which caused serious losses. Therefore, how to assess and control the risk of tunnel water inrush effectively has become a major research in engineering. Scholars at home and abroad have done a lot about the risk assessment of tunnel water inrush [1]. SHEN et al [2] deeply analyzed the factors involved with water inrush in Qiyue Mountain tunnel of the Yiwan Railway, established the risk assessment indicator system for tunnel water inrush risk evaluation based on AHP, and obtained a good effect. DU et al [3] assessed the water inrush risk of Wuchiba tunnel on the basis of ��karst tunnel experts evaluation system��. YANG et al [4], using seepage coupling mechanics theory,computational science and technology as well as high-tech microseismic measurement techniques, revealed the water inrush law in strata and accordingly forecasted the water inrush disaster in underground engineering. However, the defects of strong subjectivity, being susceptible to engineering geological conditions and hydrogeological conditions and great limitations widely exist in such methods. For example, all or most of the indicators�� values and weights in one system are determined subjectively, which is essentially a transformation from qualitative assessment to quantitative conclusion. This unequal change may cause large errors.
In view of these, the tunnel water inrush risk assessment model was proposed based on improved attribute mathematical theory [5], which identifies the risk of water inrush mainly by determining the possibility of water inrush occurrence. The main difference between the model and conventional risk assessment approaches lies in the following three aspects. 1) The nonlinear measurement function is used to improve the attribute mathematical theory in which the nonlinear change process is closer to the actual engineering situations [6]. 2) Evaluation indicators are determined according to the factors which have a most direct impact on tunnel water inrush. 3) Combined with the measured data, the similar weight method [7] is used to determine the weight of each indicator, which largely increases its objectivity and credibility.
2 Improved attribute mathematical theory
Attribute mathematical theory aims at studying the relationship between two or more qualitative things and solving the measurement problems of them, by which uncertainties in engineering can be well described. The theory forms the theoretical basis for comprehensive evaluation in solving complex engineering problems. It can be specifically described as follows. Considering the evaluation object set X={X1, X2, ��, Xn}, the evaluation indicator set I={I1, I2, ��, Im}, if xij represents the measured value of the evaluation indicator Ij which belongs to the evaluation object Xi, m-dimensional vector xi can be denoted as xi={xi1, xi2, ��, xim}. Considering the evaluation grade space C={C1, C2, ��, CK}, the K-th evaluation grade Ck (k=1, 2, ��, K�C1) represents less risk or lower security than the (K+1)-th evaluation grade, namely Ck<>k+1. Then C is an ordered set.
2.1 Nonlinear single indicator attribute measurement function
Single indicator attribute measurement ��ijk reflects the attribution ratio of the measured value xij to the evaluation grade Ck. Attribute measurement is generally determined by establishing its measurement function which represents the change of ��ijk accordingly with that of xij [8]. Traditional measurement function is defined mainly based on piecewise linear function in which there are two obvious flaws as shown in Figure 1. Firstly, in engineering it is impossible that the value of attribute measurement ��ijk will linearly change with the variation of the measured value xij. Linear curve is just the approximate curve. It is worth being considered whether there is a more reasonable curve which can further approach the engineering conditions. Secondly, there are always several mutation points in the curve. The presence of such mutation points tends to lead a considerable error between the evaluation results and the engineering conditions, greatly reducing the credibility of the evaluation results.
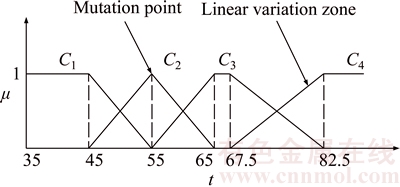
Figure 1 Linear measurement curve
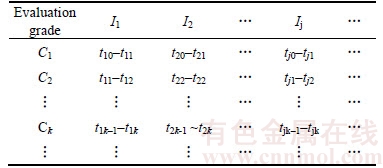
In this work the trigonometric functions are adopted to optimize the linear measurement functions, establishing the nonlinear single indicator attribute measurement functions whose determination is as follows. As listed in Table 1, when the value of indicator Ij lies on the interval [tjk�C1, tjk], the corresponding evaluation grade is Ck. Here tj0<>j1<>j2<��<>jk (j=1, 2, ��, m, k=1, 2, ��, K). Suppose
 (1)
(1)
 (2)
(2)
In Formula (2), k=1, 2,��, K�C1.
Nonlinear single indicator measurement
Table 1 Grade subdivision of single indicator
function ��ijk(x) is as follows.
 (3)
(3)
 (4)
(4)
 (5)
(5)
where j=1, 2, ��, m; k=2, 3, ��, K�C1. Thus the following single indicator attribute measurement matrix can be obtained.
 (6)
(6)
where the column vector ��ij={��ij1, ��ij2, ��, ��ijK}T; (j=1, 2, ��, m) is the single indicator attribute measurement vector.
2.2 Comprehensive multi-indicator attribute measurement
Comprehensive multi-indicator attribute measurement reflects the attribution ratio of the evaluation object which is determined by several indicators to the evaluation grade Ck. Comprehensive attribute measurement ��ik can be calculated by the following formula.
 (7)
(7)
where ��ij is the weight of indicator Ij, and the following relationship is satisfied.
 (8)
(8)
For the evaluation object set X={X1,X2, ��, Xn}, comprehensive multi-indicator attribute measurement matrix can be obtained according to formula (7).
 (9)
(9)
where the column vector ��i={��i1, ��i2, ��, ��iK}T (i=1, 2, ��, n) is the comprehensive multi-indicator attribute measurement vector.
2.3 Attribute recognition
Attribute recognition [9] is based on comprehensive multi-indicator attribute measurement, judging which grade the evaluation object Xi belongs to. The evaluation grade space C={C1, C2, ��, CK} is an ordered set. So, the confidence criterion [10] can be used for the attribute recognition of Xi. Attribute recognition process is as follows.
For ordered evaluation grade space C, the confidence is set as ��, and 0.5 <�ˡ�1.
When  ,
,
 (10)
(10)
The evaluation object Xi belongs to evaluation grade Cd.
When  ,
,
 (11)
(11)
The evaluation object Xi belongs to evaluation grade Cd.
3 Risk assessment model of tunnel water inrush
3.1 Determination of evaluation indicator set
Tunnel water inrush risk is affected by many factors within the scope of space where the tunnel is located [11], including the degree of surface water development, surface annual precipitation, river closure capability of surface vegetation, topography, adverse geological, formation lithology, geological structure, groundwater level and tunnel itself conditions [12, 13]. As a fundamental work, determine that the evaluation indicator set I plays a crucial role in establishing the risk assessment model of tunnel water inrush, which guarantees the accuracy of the model. The evaluation indicator set I should have the following characteristics.
1) Dimension rationality, namely totality and non-redundancy of indicators. With low dimension, the evaluation indicators can not fully reflect tunnel water inrush risk, causing model��s failure. With too high dimension, the model will be affected by less relevant factors, some of which in certain cases even may be converted into irrelevant factors. This will enhance the sensitivity of the model which not only reduces its accuracy, but also increases the amount of analysis and calculation.
2) Independence of each evaluation indicator. Evaluation indicators should be independent from each other to the utmost extent. If there is a large correlation between the two indicators p and q, the variation of indicator p is bound to affect the indictor q, and the effect is generally extremely complex and irregular. We can neither simulate the variation relationship between them, nor determine the degree of influence on each, which will greatly improve the randomness of the result.
3) The directness of evaluation indicator. The relationship between evaluation indicator and evaluation object should be the direct reflecting and being reflected. The directness has the following benefits. Firstly, it avoids the cross impact between indirect indicators. Secondly, evaluation indicator decides which risk grade the evaluation object belongs to without the help of intermediate medium, avoiding the impact of intermediate medium.
4) Quantifiable indicators. The attribution ratio of unquantifiable indicator to a certain risk grade can not be determined by establishing its measurement function. It only can be experientially determined and the measurement value is 0 or 1. In fact, the risk caused by a factor is more likely to hover between two risk grades, which can not be simply attributed to a certain risk grade. It is an advantage to consider the uncertainties in engineering as a problem of probability. So, it is necessary to try to ensure that the evaluation indicators can be quantified directly or by some means.
Essentially speaking, tunnel water inrush results from the interaction between the underground water flow network and water- blocking system as well as water storage system [14]. The geological disaster occurs when the power of the system is much greater than its resistance and releases at a sudden. Due to the inherent complexity and uncertainty in engineering, we do not have to take all factors into account. From the three aspects of water-bursting sources, water inrush paths and tunnel itself conditions, the impact of various factors on the tunnel water inrush and the mutual impact on each other were analyzed in detail. And then based on a reasonable simplification, the multi-factor relation web of tunnel water inrush is built as shown in Figure 2. According to the relation web, the evaluation indicator set I was determined under the principle of transverse independence and longitudinal immediacy. I={tunnel head pressure I1, permeability coefficient of surrounding rock I2, crushing degree of surrounding rock I3, relative angle of joint plane I4, tunnel section size I5}.
3.2 Evaluation indicator analysis
1) Tunnel head pressure I1
Tunnel head pressure generally refers to the original water pressure which can be affected by many factors directly or indirectly. Excessive head pressure is the most direct reason for the occurrence of tunnel water inrush accidents. Tunnel head pressure can be tested by water pressure gauge as shown in Figure 3 [15].
2) Permeability coefficient of surrounding rock I2
Permeability coefficient of surrounding rock is significantly affected by its physical properties and structural characteristics which generally can be roughly determined based on the type of rock [16], actually an empirical value. However, because of the disturbances of tunnel excavation to the surrounding rock, especially for the presence of karst pipelines in karst areas, the permeability coefficient of surrounding rock is always much larger than what is empirically determined. The coarse fissures formed by karst pipelines or excavation disturbances have great water permeability. As a result, groundwater flowing in the fissures often shows a state of Darcy flow�C non-Darcy flow as shown in Figure 4. The groundwater seepage models which are built on Darcy law are greatly limited when used in karst areas and a large deviation tends to appear in the results.
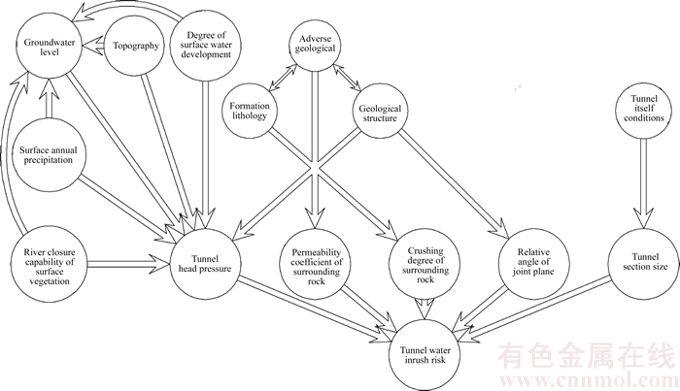
Figure 2 Multi-factor relation web of tunnel water inrush
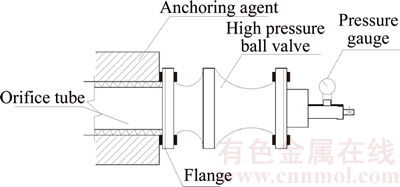
Figure 3 Water pressure gauge schematic
The determination method for permeability coefficient of multi-fissure rock was adopted in this work. It is on the basis of permeability tensor theory for fractured rock. The average width and distance of rock fissures as well as the normal direction of each fissure group are fully considered. The specific steps can refer to Ref. [17]. The greater the permeability coefficient of surrounding rock is, the higher the risk of tunnel water inrush will be.
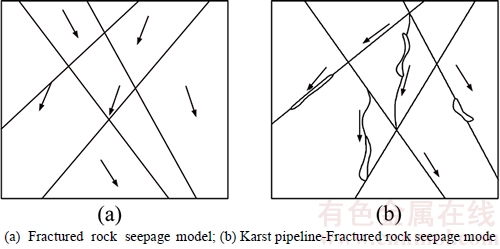
Figure 4 Rock seepage model:
3) Crushing degree of surrounding rock I3
The crushing degree of surrounding rock has a direct effect on the tunnel water inrush. Developed joint fissure in crushing rock is the important channel for groundwater flowing, and water flowing in the rock, in turn, will further increase the crushing degree of the rock [18, 19]. In addition, when the water flows into the fissures, excessive water pressure may cause the phenomenon of hydraulic fracture in the rock [20], which greatly increased the risk of tunnel water inrush. The crushing degree of surrounding rock can be represented by frequency of joints as shown in Table 2. The greater the frequency of joints is, the higher the risk of tunnel water inrush will be.
4) Relative angle of joint plane I4
The relative angle of joint plane refers to the angle between the axis of the tunnel and the main joint plane in surrounding rock. As we can see in Figure 5, when the angle is 0��, the normal direction of the joint plane is perpendicular to the direction of the tunnel axis. As a result, the flow resistance of the overlying water or lateral water to the tunnel is greater than that along the joint plane, and then the risk of tunnel water inrush is minimized [21]. Likewise, the risk of tunnel water inrush is maximized when the angle is 90��.
Table 2 Risk grade of crushing degree of surrounding rock
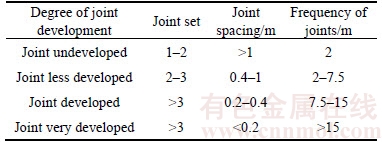
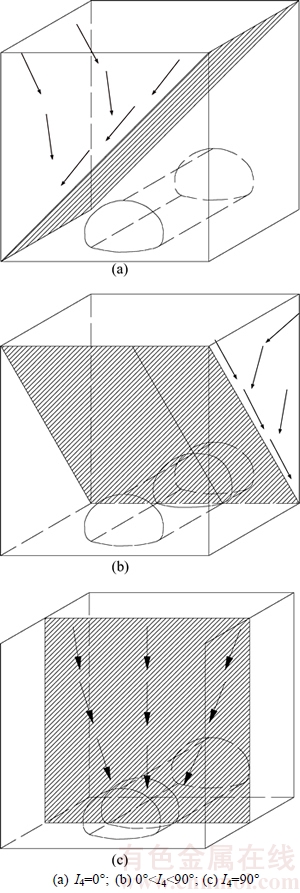
Figure 5 Relative angle of joint plane for tunnels:
5) Tunnel section size I5
Tunnel itself conditions also have a very important influence on water inrush risk, such as tunnel buried depth, tunnel length, tunnel section size and shape. The deeper the tunnel is buried and the longer it extends, the more geologic units and hydrological units it passes through. And the water inrush risk is greatly enhanced. However, in engineering we find that the risk of tunnel water inrush is not significantly linked to tunnel buried depth or tunnel length. This is because the geological and hydrological units that a tunnel passes through are quite different. In terms of the working face, the tunnel buried depth and length have no direct impact on water inrush.
In order to facilitate theoretical analysis, the tunnel section size is selected as the object to analyze the impact of tunnel conditions on the water inrush risk. The disturbances to the surrounding rock due to tunnel excavation greatly increase its permeability by promoting the formation of new fissures, destroying the pre- formed cemented stowing between old fissures and then reopening them. Taking the stress distribution in surrounding rock of underground circular tunnel [22] for example, as is illustrated in Figure 6, around the tunnel periphery axial stress of the surrounding rock ��r=0 and tangential stress ���� =2p where p represents the initial ground stress. It returns to the initial stress at 3�C5 times the radius of the tunnel, which indicates the disturbance range of the tunnel excavation. Therefore, tunnel with large section has a large disturbance range which means a greater possibility of connecting with the karst pipelines or coarse fissures, namely a higher risk of water inrush.
Based on the above analysis, the classification criterion for the risk assessment indicators of tunnel water inrush is determined in Table 3.
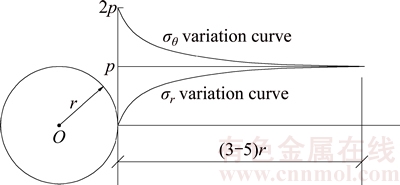
Figure 6 Stress distribution in surrounding rock of underground circular tunnel
3.3 Single indicator measurement function
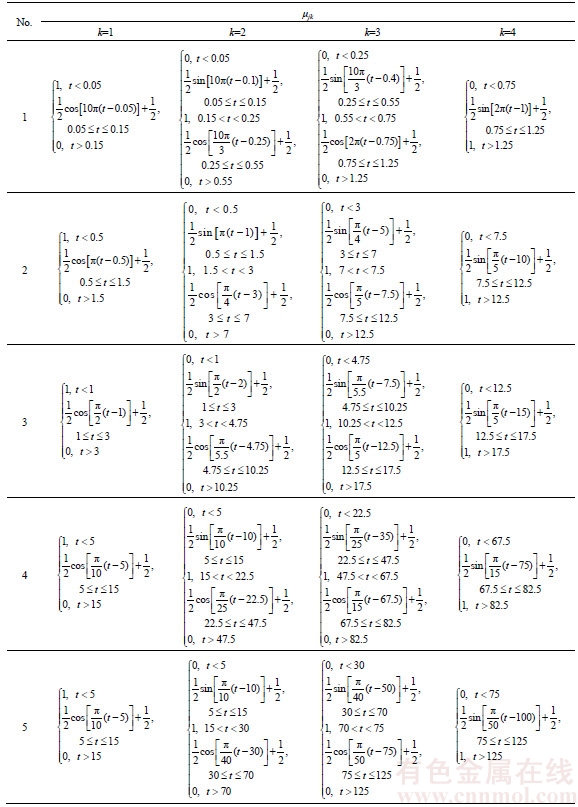
According to the five indicators (I1, I2, I3, I4, I5) listed in Table 3 as well as Formulae (3)�C(5), the single indicator measurement functions ��jk(t) are established as specifically shown in Figure 7. The corresponding expressions are shown in Table 4.
3.4 Weight determination by similar weight method
Determining the weights of indicators is one of the core issues in the multi-indicator comprehensive evaluation process. As a widely used method, subjective weighting method is used by comparing indicators with each other and giving evaluation separately, which are made by policy makers. Therefore, in the process it is required that each expert is highly familiar to the object and able to wholly grasp it. So, the uncertainty and subjectivity are great and inevitable. The risk assessment indicator system of tunnel water inrush is dealing with a very complex engineering problem, in which experts can not or have a great trouble to give the relative importance of each indicator empirically. Besides, the relative importance may change with different projects. Therefore, the similar weight method [23] is proposed to determine the weights of indicators based on the similarity coefficient method. It depends on the engineering parameters of various indicators, seeking to comprehensively and objectively judge the importance of each indicator.
For the pending weight ��j, we assume that ��j=1/m, j=1, 2, ��, m, that is to say, each indicator has the same importance. The comprehensive multi-indicator attribute measurement vector ��i reflects the overall evaluation of indicators with the average weight. Under the average weight, the closeness of a certain single indicator attribute measurement vector ��ij to ��i is closely related to its actual weight. The closer the two vectors are, the greater the actual weight of the indicator will be. So, the matter is transformed into solving the closeness of two non-negative vectors. The similarity coefficient method is adopted here. Suppose the water inrush risks of n different target segments in a tunnel are evaluated, and for similarity coefficient rj , similar weight ��j, solving process is as follows.
Table 3 Classification criteria for risk assessment indicators of tunnel water inrush
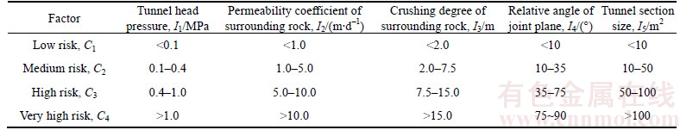
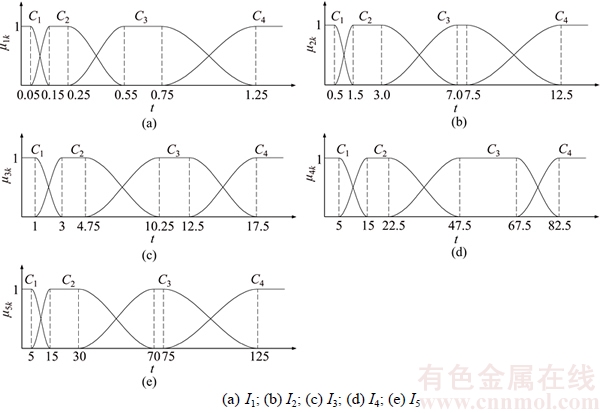
Figure 7 Attribute measurement function curve of indicators:
Table 4 Expressions of single indicator attribute measure function
 (12)
(12)
 (13)
(13)
 (14)
(14)
As a basis to determine the weights of indicators, both of the above two vectors ��ij, ��i are derived from the measured data in engineering which guarantees enough objectivity. In order to avoid accidental factors, the value of n should be fully increased with the premise of a reasonable operation efficiency, enhancing the credibility of the risk assessment model.
4 Engineering application of case one in practice
Wuchiba tunnel is located in Wuchiba, Baiguoba Town, Enshi City, Hubei Province and Qingkou, Tuanbao Town, Lichuan City, Hubei Province, China, which is the controlling structure of Enshi to Lichuan section of Shanghai�CChengdu Expressway [3]. The tunnel is designed separated with up and down passages, whose total length is 6708 m, inlet and outlet levels are respectively 1072.84 m and 1179.90 m and the maximum buried depth is about 488 m. Tunnel passes through karst formation and about two-thirds of the tunnel is located in karst areas, which is greatly threatened by water inrush.
Based on Wuchiba tunnel project, the risk assessment model of tunnel water inrush was established, evaluating the water inrush risk of YK256+000-YK257+200 section of the tunnel. As shown in Figure 8, monitored and tested data of target segments X1, X2, X3 and X4 are listed in Table 5.
4.1 Determining weights of indicators
According to the above, the single indicator measurement matrices of the target segments in Wuchiba tunnel can be obtained as the following.
 (15)
(15)
 (16)
(16)
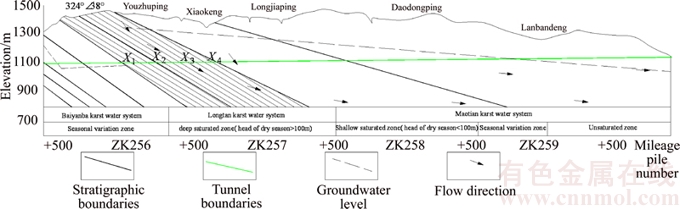
Figure 8 Partial geological profile of Wuchiba tunnel
Table 5 Parameters of target segments in Wuchiba tunnel

 (17)
(17)
 (18)
(18)
According to the similar weight method, namely ��j=0.2, the comprehensive attribute measurement matrix under the average weight can be obtained as the following.
 (19)
(19)
The similarity coefficient vector r can be obtained by Formulae (12) and (13):
 (20)
(20)
The indicator weight vector �� can be obtained by Formula (14):
 (21)
(21)
4.2 Risk assessment of target segments in Wuchiba tunnel
It is an important work to determine the confidence �� for the attribute recognition of the risk assessment model. It is not conducive to get the desired evaluation effect, whether the �� is assigned a too high or too low value. A high value will make the evaluation range of the model too broad, which greatly reduces the accuracy of the model. Likewise, a low value can not guarantee the authenticity of the results, even leading to an unreasonable result. In attribute recognition, the value of �� is generally between 0.6 and 0.7 [24]. According to the engineering characteristics of Wuchiba tunnel, ��=0.6. Formula (10) can be simplified as the following.
 (22)
(22)
Combined with Formula (21), the comprehensive multi-indicator attribute measure- ment matrix of the four target segments in Wuchiba tunnel can be obtained.
 (23)
(23)
where the column vectors are comprehensive attribute measurement vectors for the target segments X1, X2, X3, X4. Judging from Formula (22) and (23), the risk assessment results of X1, X2, X3 and X4 are, respectively, medium risk, medium risk, high risk and high risk.
4.3 Result verification
Excavation data [25] shows that the overlying layer of ZK256+000 to ZK256+300 section of the tunnel is the Upper Permian Changxing Formation (P2c) dark gray slightly weathered thick-bedded limestone containing flint where karst is slightly developed. Water inflow in dry seasons is no more than 10 L/s, causing a slight influence on the project. Water inflow in rainy seasons is no more than 50 L/s, which will affect the project. The risk of water inrush is medium. The ZK256+300 to ZK257+200 section of the tunnel crosses the Triassic Daye Formation relative impermeable layer of shale, entering the recharge zone of Tuanbao- Xiaoxi giant karst water system where karst is very developed. The tunnel is located in saturated zone. Water inflow during dry seasons is generally less than 50 L/s and there will be a significant increasing in water inflow during rainy seasons, which can be up to 300 L/s. The risk of water inrush is great.
The risk assessment results of X1, X2, X3, X4 and the excavation data agree well, which demonstrates that the risk assessment model of tunnel water inrush based on improved attribute mathematical theory is of rationality and applicability and can provide a reference for related projects.
5 Engineering application of case two in practice
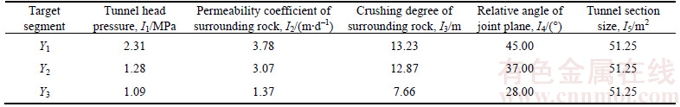
Daba tunnel entrance is located in Daba Township, Yongshun County and outlet is located in Zejia Town, Yongshun County, which is an important part of Longshan to Yongshun Expressway in Hunan Province, China. The tunnel is separated double holes tunnel and the clearance of tunnel is 10.25��5.0 m. Two holes are nearly parallel to each other and the net distance is 10�C32 m. Most part of the tunnel body passes through the carbonate limestone and dolomite with rich groundwater. In the joint developed zones, fault fracture zones and karst areas, it is a great chance for water inrush, which causes a great impact on the progress of the project. Considering the left tunnel, the target segments of Y1, Y2, Y3 on the ZK85+980 to ZK86+230 section of the tunnel are selected. Y1 is near the F6 fault, Y2 is near the F2 fault, and Y3 lies in the less weathered limestone, which is far away from the faults, as shown in Figure 9. The corresponding monitored and tested data are listed in Table 6.
5.1 Determining weights of indicators
Likewise, the single indicator measurement matrices of the target segments in Daba tunnel can be obtained as the following.
 (24)
(24)
 (25)
(25)
 (26)
(26)
where ��j=0.2, the comprehensive attribute measurement matrix under the average weight can be obtained as the following.
 (27)
(27)
The similarity coefficient vector r can be obtained by Formulae (12), (13):
 (28)
(28)
The indicator weight vector �� can be obtained by Formula (14):
 (29)
(29)
5.2 Risk assessment of target segments in Daba tunnel
According to Formula (22), the comprehensive multi-indicator attribute measurement matrix of the four target segments in Daba tunnel can be obtained.
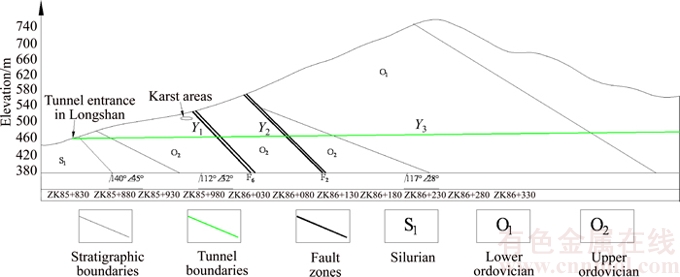
Figure 9 Partial geological profile of left tunnel of Daba tunnel
Table 6 Parameters of target segments in Daba tunnel
 (30)
(30)
Similarly, judging from Formulae (22) and (30), the risk assessment results of Y1, Y2, Y3 are respectively high risk, medium risk, medium risk.
5.3 Result verification
Excavation data show that near the F6 fault, the surrounding rock is weak with obvious chloritization. The rock mass is influenced by the geological structure. As a result karst and joint fissures are developed. The surface is relatively flat. So, the surface water seepage along the fracture zone is easier. The groundwater flows as pouring, which may cause water inrush in the tunnel and the risk is high. Near the F2 fault, the karst and joint fissures are less developed, mainly including corrosion cracks, small caves filled with clayey. The section is part of the hillside with steep terrain, which is difficult for surface water convergence and infiltration. Groundwater mainly consists of bedrock fissure water and karst water with the moderate water inflow. So, the risk is moderate. The surrounding rock of Y3 mainly consists of thick to very thick layer of slightly weathered limestone, which is relatively intact. This section is part of the ridge with high altitude, which is also difficult for surface water convergence and infiltration. So, the risk is moderate.
The risk assessment results of Y1, Y2, Y3 and the excavation data agree well, which proves once again that that the risk assessment model of tunnel water inrush based on improved attribute mathematical theory is of rationality and applicability.
6 Conclusions
1) Nonlinear measurement function was adopted to improve the attribute mathematical theory, eliminating the mutation points and linear sections in linear measurement functions. Then combined with the two subsystems of comprehensive multi-indicator attribute measure- ment and attribute recognition, the improved attribute mathematical theory was proposed. Compared with the traditional attribute mathematical theory, this nonlinear change process is closer to the actual engineering situations.
2) The impact of various factors on the tunnel water inrush as well as the mutual impact was analyzed in detail and in this way the multi-factor relation web of tunnel water inrush is built. According to the relation web, the evaluation indicator set of water inrush risk was determined under the principle of transverse independence and longitudinal immediacy. Then the similar weight method was used to guarantee the objectivity of each indicator��s weight, based on which the risk assessment model of tunnel water inrush was established.
3) The model was adopted to evaluate the water inrush risk of target segments X1, X2, X3, X4 which were distributed on ZK256+000 to ZK257+ 200 section of Wuchiba tunnel as well as the target segments Y1, Y2, Y3 of Daba tunnel. The risk assessment results and the excavation data agree well, which demonstrates that the model is of rationality and applicability and can provide a reference for related projects.
References
[1] LI C P, LI J J, LI Z X, HOU D Y. Establishment of spatiotemporal dynamic model for water inrush spreading processes in underground mining operations [J]. Safety Science, 2013, 55: 45�C52.
[2] SHEN X M, LIU P L, WANG J F. Evaluation of Water-inrush risks of karst tunnel with analytic hierarchy process [J]. Journal of Railway Engineering Society, 2010(12): 56�C63. (in Chinese)
[3] DU Y C, HAN X R, LI Z L. Professional evaluating system for karst tunnel gushing based on AHP and its application [J]. Carsologica Sinica, 2009(3): 281�C287. (in Chinese)
[4] YANG T H, TANG C A, TAN Z H, ZHU W C. State of the art of inrush models in rock mass failure and developing trend for prediction and forecast of groundwater inrush [J]. Chinese Journal of Rock Mechanics and Engineering, 2007(2): 268�C277. (in Chinese)
[5] MIAO C L, SUN L Y, YANG L. Evaluation method for coalmining-based cities ecosystem based on attribute mathematical model with Huainan City as an example [J]. Ecological Indicators, 2015, 48: 17�C21.
[6] XU J S, LI Y X, YANG X L. Stability charts and reinforcement with piles in 3D nonhomogeneous and anisotropic soil slope [J]. Geomechanics and Engineering, 2018, 14(1): 71�C81.
[7] XU J S, PAN Q J, YANG X L, LI WT. Stability charts for rock slopes subjected to water drawdown based on the modified nonlinear Hoek-Brown failure criterion [J]. International Journal of Geomechanics, 2018, 18(1). DOI: 10.1061/(ASCE)GM.1943-5622.0001039.
[8] YANG Z H, ZHANG R, XU J S, YANG X L. Engery analysis of rock plug thickness in karst tunnels based on non-associated flow rule and nonlinear failure criterion [J]. Journal of Central South University, 2017, 24(12): 2940�C2950.
[9] TUNG F, LITTLE J. Improving scene attribute recognition using web-scale object detectors [J]. Computer Vision and Image Understanding, 2015, 138: 86�C91.
[10] YEH Y C, SCHMEISER B W. VAMP1RE: A single criterion for rating and ranking confidence-interval procedures [J]. IIE Transactions (Institute of Industrial Engineers), 2015, 47(11): 1203�C1216.
[11] LI Z L, WANG X H, XIE L Z. Testing and applied research on grouting materials on karst tunnel water inrush [J]. Electronic Journal of Geotechnical Engineering, 2012, 17U: 2933�C2942.
[12] YANG X L, YAO C. Stability of tunnel roof in nonhomogeneous soils [J]. International Journal of Geomechanics, 2018, 18: 06018002. DOI: 10.1061/(ASCE)GM.1943- 5622.0001104.
[13] YANG X L. Lower bound analytical solution for bearing capacity factor using modified Hoek�CBrown failure criterion [J]. Canadian Geotechnical Journal, 2018, 55. DOI: https://doi.org/10.1139/cgj-2016-0694.
[14] Peng J, Li X Y. Water-inrush mechanism during construction and determination of safety distance from the water source in a karst tunnel [J]. Electronic Journal of Geotechnical Engineering, 2015, 20(8): 2345�C2354.
[15] ZHANG M Q, HUANG H J, MIAO D H, TIAN S M. Study on and determination of water pressure of the karst tunnel [J]. Journal of Railway Engineering Society, 2008(5): 53�C58. (in Chinese)
[16] RONG G, HOU D, LIU G, PENG J. Research of permeability distribution with burial depth in the fractured rock mass in valley slope [J]. International Journal of Earth Sciences and Engineering, 2013, 6(3): 442�C446.
[17] LU X B, ZHENG W, LIU Q J, ZHAN X H. A Method for Determining the Permeability Coefficient of Fractural Rock Based on the Percolation Model [J]. China Earthquake Engineering Journal, 2011(S1): 43�C47.(in Chinese)
[18] YANG X L, ZHANG R. Limit analysis of stability of twin shallow tunnels considering surface settlement [J]. KSCE Journal of Civil Engineering, 2018, 22. DOI: https://doi.org/10.1007/s12205-017-1398-8.
[19] LI T Z, YANG X L. Risk assessment model for water and mud inrush in deep and long tunnels based on normal grey cloud clustering method [J]. KSCE Journal of Civil Engineering, 2018, 22. DOI: https://doi.org/10.1007/s12205- 017-0553-6.
[20] ZHANG G X, LI X, LI H F. Simulation of hydraulic fracture utilizing numerical manifold method [J]. Science China, 2015, 9: 1542�C1557.
[21] LI T Z, LI Y X, YANG X L. Rock burst prediction based on genetic algorithms and extreme learning machine [J]. Journal of Central South University, 2017, 24(9): 2105�C2113.
[22] MUYA M S, HE B, WANG J T, LI G C. Simulation of stress distribution around tunnels and interaction between tunnels using an elasto-plastic model [J]. Journal of China University of Geosciences, 2007, 18(1): 90�C94.
[23] Yang X L, Zhang R. Collapse analysis of shallow tunnel subjected to seepage in layered soils considering joined effects of settlement and dilation [J]. Geomechanics and Engineering, 2017, 13(2): 217�C235.
[24] Yang X L, Li Z W, Liu Z A, Xiao H B. Collapse analysis of tunnel floor in karst area based on Hoek-Brown rock media [J]. Journal of Central South University, 2017, 24(4): 957�C966.
[25] WANG G B, YAN E C, YANG W D. Research on Development and Water Burst Mechanism of Karst in Wuchiba Tunnel [J]. Journal of Wuhan University of Technology, 2008(8): 152�C156. (in Chinese)
(Edited by YANG Hua)
���ĵ���
���ڸĽ�������ѧ���۵�����ͻӿˮ����ģ��
ժҪ������ͻӿˮ�ǵ��¹��̽����г����ĵ����ֺ�֮һ��Ϊ������������ͻӿˮ�ķ������������ڸĽ�������ѧ���۵�����ͻӿˮ����ģ�͡��������Ǻ������߶�������ѧ���۽����Ż������ͳ������Ԥ�⺯����ͻ����Լ����Ա仯�����ģ�;��ȵ�Ӱ�졣���ڶԶ������ص��ۺϷ�����ѡȡ5��������Ϊģ������ָ�꣬������ˮͷѹ����Χ����ϵ����Χ������̶ȡ����������ԽǶ��Լ��������������ͬʱ����������ָ�꼯��ά�Ⱥ����ԡ������ԡ�ֱ�����Լ���������ԭ����ϸ�����˲�������֮��Ĺ���������������Ȩ�ط�ȷ����ÿ��ָ���Ŀ��Ȩ�أ���������������ͻӿˮ��������ģ�͡����÷������õ�2����ͬ������4����Σ����۽����ʵ�ʿ�������Աȱ����������Ǻ����ã�˵��ģ�;��нϸߵľ��ȡ�
�ؼ��ʣ�����ͻӿˮ����������ģ�ͣ�������ѧ���ۣ������Բ�Ⱥ���������Ȩ�ط�
Foundation item: Project(2013CB036004) supported by National Basic Research Program (973) of China; Project(51378510) supported by National Natural Science Foundation of China
Received date: 2017-05-17; Accepted date: 2017-12-10
Corresponding author: YANG Xiao-li, Professor; Tel: +86�C14789933669; E-mail: yangky@aliyun.com; ORCID: 0000-0003-1593-3658
Abstract: Tunnel water inrush is one of the common geological disasters in the underground engineering construction. In order to effectively evaluate and control the occurrence of water inrush, the risk assessment model of tunnel water inrush was proposed based on improved attribute mathematical theory. The trigonometric functions were adopted to optimize the attribute mathematical theory, avoiding the influence of mutation points and linear variation zones in traditional linear measurement functions on the accuracy of the model. Based on comprehensive analysis of various factors, five parameters were selected as the evaluation indicators for the model, including tunnel head pressure, permeability coefficient of surrounding rock, crushing degree of surrounding rock, relative angle of joint plane and tunnel section size, under the principle of dimension rationality, independence, directness and quantification. The indicator classifications were determined. The links among measured data were analyzed in detail, and the objective weight of each indicator was determined by using similar weight method. Thereby the tunnel water inrush risk assessment model is established and applied in four target segments of two different tunnels in engineering. The evaluation results and the actual excavation data agree well, which indicates that the model is of high credibility and feasibility.
