
Trans. Nonferrous Met. Soc. China 29(2019) 279-286
Deformation inhomogeneity due to sample-anvil friction in cylindrical compression test
Xian-jue YE1, Xiao-juan GONG1, Biao-biao YANG1, Yun-ping LI1, Yan NIE2
1. State Key Laboratory for Powder Metallurgy, Central South University, Changsha 410083, China;
2. Yuanmeng Precision Technology (Shenzhen) Institute, Shenzhen 518000, China
Received 26 January 2018; accepted 16 May 2018
Abstract:
Finite element (FEM) analysis was used to systematically evaluate the inhomogeneity of deformation in cylindrical samples with various sample-anvil friction coefficients, m. It was found that the level of friction strongly influences the deformation homogeneity, which increases significantly with the friction coefficient although the overall geometry of the samples almost remains the same when m>0.4. The position, at which the effective strain along the maximum radial direction in a compressed sample is equal to the equivalent strain of the sample, does not vary greatly with respect to both equivalent strain of the sample and m. Hardness measurements of compressed cylindrical 5056B Al alloy samples revealed a change of effective strain distribution similar to that revealed by FEM analysis. There exists a quantitative relationship between the hardness and the effective strain if no recrystallization or recovery occurs during the compression process.
Key words:
compression; friction coefficient; barreling, cylinder; deformation inhomogeneity;
1 Introduction
Cylindrical samples are widely used for determining the flow stress in a material as a function of the strain applied by compressing the cylindrical sample between two flat anvils [1-9]. If there is no friction at the sample-anvil interface (hereafter, interfacial friction, m), the deformation in the cylinder is uniform and the free surface of the cylinder remains straight during compression. In reality, however, the interfacial friction restrains the radial displacement of the material near the interface and causes the remaining portion of the sample to bulge out, changing the shape of the free surface of the sample into a barrel-like shape. Barreling of the sample causes a deformation inhomogeneity inside the sample. Several studies have been carried out by adding lubricants for reducing the sample-anvil friction coefficient (hereafter, friction coefficient) during compression tests [10,11]. However, the disadvantage of this method is that the friction cannot be reduced to a negligible level, especially in high-temperature forming processes, because most high-quality lubricants used at ambient temperatures are organics that cannot withstand high temperatures. In addition, at high strain levels, the free surface of the sample comes closer to the anvil surface because of barreling; as the strain level increases, the free surface eventually comes in contact with the anvil surface. Hence, this free surface forms the outermost area of the contacting surface with the anvil when the strain reaches a certain level, possibly leading to sticking in this region. CHEN and CHEN [12] investigated the deformation inhomogeneity during a cylindrical compression test to calculate the intrinsic flow stress-strain behavior of the material using a theoretical model based on Hill��s general method because the stress-strain curve of a barreled sample deviates from the real response of the tested material. EVAN and SCHARNING [13] investigated the factors related to stress determination in cylindrical compression tests and carried out a systematic evaluation of stress error and a qualitative evaluation of strain distribution due to interfacial friction and adiabatic heating inside the sample. MIRZA and SELLARS [14,15] investigated the effects of various parameters such as friction and sample geometry on the measured response and deformation during a hot plane-strain compression test. However, these researches do not essentially coincide with the real process and include a quantitative evaluation of strain distribution with respect to factors such as friction coefficient either.
Many studies have also been carried out to evaluate the influence of friction on the flow stress in a barreled sample [16-19]. Although the works mentioned above have accounted for the effects of friction, these efforts were mainly focused on the influence of friction on the geometry and the mechanical response of the sample. It is well known that the effective strain inside a compressed sample is maximum at the sample center and that it increases with the friction coefficient. However, despite the fact that strain distribution can easily be determined by finite element (FEM) analysis [20-23], a detailed and systematic investigation of the strain distribution in a compressed cylindrical sample has not yet been carried out. In addition to FEM analysis, microstructure observation is usually carried out to characterize the deformation mechanism of materials.
The inhomogeneous distribution of strain inside the sample greatly impedes us in precisely characterizing the deformation mechanism. In most cases, the observations in the previous studies were carried out at center of the compressed samples. However, from our basic research, this location is unsuitable because the strain at the center would be twice the equivalent strain of the sample if the sample is compressed to approximately 60% of the nominal strain at a Tresca friction coefficient (m) of 0.5; hence, the microstructure observed at the center will not be representative of that corresponding to the equivalent strain of the sample. Therefore, when a cylindrical sample is compressed under varying conditions, determining the location for observing the deformation is a crucial problem.
In this work, we used the DEFORM-3D FEM analysis to simulate the geometry and strain distribution during the compression of a cylindrical sample. We compressed cylindrical 5056B Al-5Mg alloy samples at ambient temperature under different lubrication conditions and measured the hardness of the samples to verify the accuracy of the FEM results.
2 FEM analysis
A model of the sample, having the same size as the actual sample (8 mm in diameter and 12 mm in height), was simulated using DEFORM-3D v6.13 FEM analysis software. To reduce the computing time, only one-eighth of the cylindrical sample was considered for analysis; the mesh number of the simulation was 30000. The Tresca friction coefficient m for the simulations was varied from 0 (perfect sliding) to 1 (sticking) in increments of 0.1. The geometry variation and strain distribution at various strain levels were analyzed.
3 Experimental
Extruded 5056B Al-5Mg alloy was used as the sample material. Cylindrical samples, 8 mm in diameter and 12 mm in height, were cut by electro-discharge machining (EDM). Concentric ridges of 0.1 mm in depth were machined on the flat end surfaces of the sample so that the profile of the sample surface can be easily recognized after deformation. Compression tests were carried out at ambient temperature in a computer-aided hot-forging simulator (Thermecmaster-Z) at a true strain level of approximately 1.1 (approximately 70%). As we have already discussed the correction for the effect of temperature on the stress variation [24,25], the influence of interfacial friction inside the sample was analyzed independently. To achieve this, we had to avoid adiabatic heating inside the sample during deformation, which was done by maintaining a constant strain rate of 10-3 s-1 during the compression process. To control the friction coefficient, we conducted compression tests with five lubrication conditions: restriction test in the top surface of sample, no lubricating, plastic rubber, graphitic sheet, as well as compression lubricated by MoS2 spray between sample top surface and anvil. Before the compression test, the grooved top surface of the sample was painted with red ink so that the original top profiles are easily recognizable before the calculation of the friction coefficient is performed. Vickers hardness along the vertical symmetric line of the cross section of samples after compression was measured using a HMV microhardness tester (Shimadzu Company).
4 Results and discussion
4.1 Geometrical evolution
We used various values of Tresca friction coefficient m during compression to calculate the geometrical evolution of the cylindrical sample by FEM analysis. In this case, m was considered to be a constant, or in other words, independent of strain, during all compression tests. A schematic diagram of a typical end surface of a sample compressed at high strain levels observed along the direction of compressive force is shown in Fig. 1(a). Rt, Rc and Rm denote the radius of the top of the sample (after broadening during compression), contacting radius, and maximum radius of the deformed sample (at the centre of the sample), respectively. Hence, (Rc-Rt) is the width of the circular area formed from the original free surface area of the sample because of the barreling of the sample and the subsequent contacting of the free surface with the anvil. Figures 1(b), (c) and (d) show the simulation results of the sample geometry for m=0.5 at equivalent strains of 0.3, 0.65 and 1.5, respectively. The areas of the end surfaces before compression are indicated by the dashed lines. At equivalent strains of sample lower than approximately 0.5, the top surfaces of the samples after compression were mainly constituted by original end surfaces of the samples so that Rt was approximately equal to Rc. However, the simulation results indicated that at strain levels higher than approximately 0.6, Rc (and hence (Rc-Rt)) started to increase appreciably as the free surface of the specimen was added to the end surfaces of the specimen because of the barreling of the sample and subsequent contacting of the free surface with the anvil. The geometry of the sample deformed at m=0.9 and an equivalent strain of 1.5 was also obtained, as shown in Fig. 1(e). The primary geometrical parameters of the samples, Rm and Rc, were measured to be 4.416 and 4.068 mm in Fig. 1(d) and 4.416 and 4.067 mm in Fig. 1(e), respectively, indicating that these two samples had almost the same geometry despite a large difference in m when they were compressed. In contrast, Rt was measured to be 6.563 and 4.753 mm in Figs. 1(d) and (e), respectively, indicating that the deformation inhomogeneity in the sample with larger m is severer than that in the sample with less m. This is because in the sample with larger m (Fig. 1(e)), a larger part of the contacting surface was formed from the original free surface of the sample owing to the barreling of the sample and the subsequent contacting of the free surface with the anvil (the area of (Rc-Rt)) as a result of sever inhomogeneity in microstructure.
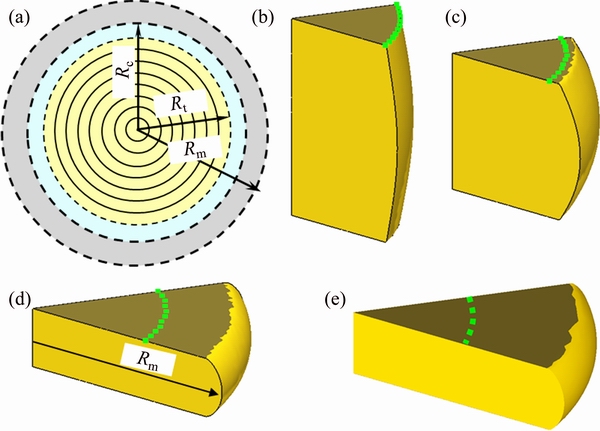
Fig. 1 Schematic diagram of typical end surface of sample compressed at high strain levels observed along direction of compressive force (a) and simulation results of sample geometry obtained using DEFORM for Tresca friction coefficient m=0.5 at strain levels of 0.3 (b), 0.65 (c), 1.5 (d) and for m=0.9 at strain level of 1.5 (e)
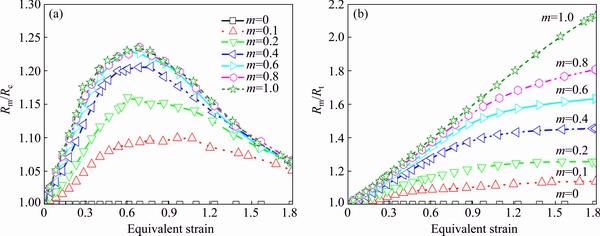
Fig. 2 Rm/Rc (a) and Rm/Rt (b) of sample calculated as function of equivalent strain
On the basis of the above discussion, we used parameters Rm/Rc and Rm/Rt, respectively, to denote the degree of overall geometrical change and deformation inhomogeneity due to interfacial friction. The simulation results, with m varying from 0 to 1, are shown in Figs. 2(a) and (b). In the case of a sample with no interfacial friction, both Rm/Rc and Rm/Rt remain 1 and the deformation is completely homogeneous. The larger the value of m is, the larger the values of these parameters are: a larger value of Rm/Rc indicates greater deviation from the friction-free geometry after deformation and a larger value of Rm/Rt indicates greater inhomogeneous deformation. As shown in Fig. 2(a), for m<0.4, Rm/Rc increases rapidly with m, whereas for m>0.4, Rm/Rc remains more or less constant at given strain levels. This implies that for m>0.4, the interfacial friction does not strongly influence the overall geometry of a compressed sample, which is in good agreement with above discussion (Figs. 1(d) and (e)). In an actual hot compression process, m is generally in the range of 0.4-0.7 [10]; hence, the overall geometry of the compressed samples during the hot compression process almost remains the same despite a large difference in the value of m of these compressed samples. However, from the variation of Rm/Rt as a function of the equivalent strain of the sample (Fig. 2(b)), where Rm/Rt increases steadily with m, it can be concluded that the deformation inhomogeneity increased greatly with m. The inhomogeneity of deformation inside the sample due to interfacial friction for m=0.5 at various strain levels can also be expressed explicitly, as shown in Fig. 3. With increasing strain level, points A-E located along the vertical symmetric line of the uncompressed sample began to distribute nonuniformly, especially at high strain levels. The relative positions of these points plotted as a function of the equivalent strain level are shown in Fig. 4. The relative positions of A and E remained constant because they were present at the center and the surface of the sample, respectively. However, the relative positions of points B, C and D varied considerably from 0.25 to 0.41, from 0.5 to 0.70, and from 0.75 to 0.91, respectively, indicating that the interfacial friction strongly influences the deformation homogeneity.
4.2 Effective strain distribution inside compressed sample
The interfacial friction strongly influences the distribution of strain inside the compressed sample because the local deformation at different locations inside the sample is different, as mentioned above (Figs. 3 and 4). We define the local strain inside a sample as an undirectional parameter of effective strain. The effective strain denotes the local deformation degree and varies locally inside the sample because of the inhomogeneity of the deformation. A quantitative analysis of the distribution of effective strain for the entire volume of the sample is difficult because of the complexity of flow behavior in the sample. Analysis is therefore focused on the effective strain distribution along the vertical symmetric line on the cross section of the sample (i.e., along Rm), as shown in Fig. 1(d). Figure 5 shows the simulation results of effective strain distribution after compressing the sample to an equivalent strain of 1 with m of 0.3, 0.5, 0.7 and 0.9, respectively. As shown in Fig. 5, with increasing m, the effective strain at positions closer to the centre (i.e., positions with low relative position values) increases considerably, and this influence gradually decreases from the centre to the surface (i.e., when the relative position values increase). The dashed line denotes the value of the equivalent strain of the whole sample, and the points at which the dashed line and the effective strain distribution lines for various values of m intersect indicate the locations where the effective strain is equal to the equivalent strain of the sample. In addition, even though there is a large variation in the value of m (0.3-0.9), the corresponding effective strain distribution lines intersect with the dashed line at almost the same location (approximately 0.8), as shown in Fig. 5. We also evaluated the effective strain evolution as a function of the equivalent strain of the sample for five points at relative positions of 0.1, 0.3, 0.5, 0.7 and 0.9 at m=0.5, as shown in Fig. 6. The effective strain at positions closer to the centre is higher and gradually decreases for positions fart away from the center. We conclude that because of the full or partial restriction of the interfacial friction on the original top surface of sample (Rt), the positions closer to the center experienced greater deformation than those farther away from the center. The dashed line in Fig. 6 represents the location of points at which the effective strain is equal to the equivalent strain of the sample. In Fig. 6, the dashed line runs in the area between the curves of relative positions of 0.7 and 0.9, and this observation is very similar to the observation made in Fig. 5 where the effective strain lines intersect with the dashed line (equivalent strain of the sample) at a relative position of approximately 0.8, especially at high strain levels. This implies that a location with an effective strain inside a compressed sample equal to the equivalent strain of the sample is independent of the equivalent strain or the compression reduction of the whole sample.
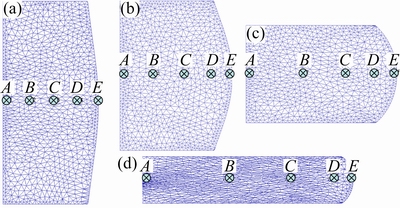
Fig. 3 Evolution of relative positions of A, B, C, D and E at compression reductions of 20% (a), 40% (b), 60% (c) and 80% (d) with m=0.5

Fig. 4 Change of relative positions of A, B, C, D and E as function of equivalent strain at m=0.5

Fig. 5 Strain distributions along center of sample after compressing to equivalent strain of 1
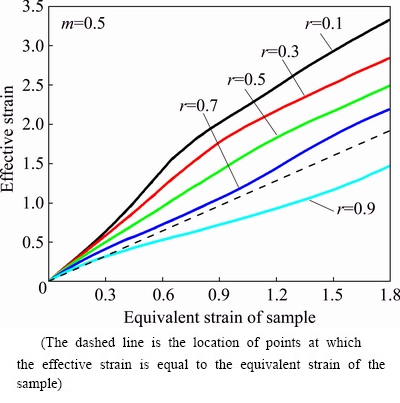
Fig. 6 Strain distributions at relative positions of 0.1, 0.3, 0.5, 0.7 and 0.9 as function of equivalent strain of sample
4.3 Experimental evaluation
To evaluate the strain distribution during real compression under the influence of interfacial friction, a series of compression tests on 5056B Al alloy samples were carried out at an equivalent strain of approximately 1.1 where the value of m was controlled by varying the lubrication conditions at the interface, as mentioned previously. Restriction compression (m=1) was carried out by two anvils where 0.2 mm-deep spiral grooves were made on the end surfaces of the sample. The friction coefficients were determined according to our previous research [25]. The Vickers hardness was measured along the vertical symmetric line and these measurements were plotted against the relative position, as shown in Fig. 7(a). Because the compression tests were conducted at ambient temperature, it is assumed that no dynamic recovery or dynamic recrystallization occurred inside the sample during and after compression, which will more or less lower the local hardness of the sample. In this way, the effective strain distribution along Rm can be expressed indirectly in terms of hardness at the corresponding positions. As shown in Fig. 7, at positions closer to the center, the hardness of samples with higher value of m was higher compared with that of samples with lower value of m; however, little difference in the hardness of samples could be observed for positions far from the center (relative position >0.6 approximately), which is in good agreement with the results shown in Fig. 5. The corresponding effective strain distributions at these friction coefficients were also calculated by FEM analysis, and the results are shown in Fig. 7(b). It is apparent that the variations of effective strain and hardness are very similar, implying that there exists a quantitative relationship between these two parameters.
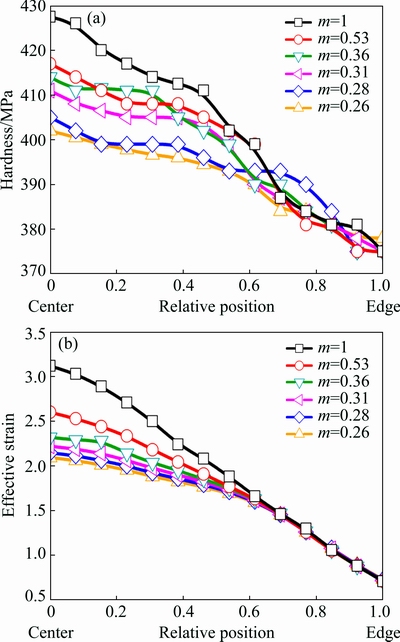
Fig. 7 Hardness distributions along vertical symmetric line of sample at equivalent strain of 1.1 with various friction coefficients (a) and corresponding effective strain distribution obtained using FEM analysis (b)
Dislocation stress �� is dependent on the shear modulus G, lattice constant b, and dislocation density �� [26]:
 (1)
(1)
where ��0 denotes the intrinsic strength of a material with low dislocation density, b is the lattice constant and a is a correction factor. In this work, �� is assumed to be the hardness of a material and ��0 is assumed to be the hardness of a material with low dislocation density or the hardness of material prior to deformation (approximately 328.2 MPa for 5056B Al alloy). As shown in Eq. (1), work hardening is proportional to the square root of the dislocation density. The material exhibits high hardness if there is a high dislocation density. In a deformed sample, the local effective strain distribution inside the sample is considered to be closely related to the dislocation density distribution accumulated during the deformation process. The relationship between the local effective strain inside the sample and the dislocation density �� of a deformed sample can be expressed as
��=��bx (2)
where x is the average dislocation slip distance, which can be considered as a constant in this work because the same samples were used in the compression processes. b is the absolute value of Burgers vector, having the same value as that of the lattice constant in Eq. (1). By combining Eq. (1) and Eq. (2), a direct relationship between the local hardness and the effective strain inside a deformed sample can be obtained as
��=��0+K��1/2 (3)
where K is a constant, given by
 (4)
(4)
Equation (3) indicates the existence of a linear relationship between the hardness of a deformed sample and the square root of effective strain in the sample. We plotted the measured hardness (Fig. 7(a)) and the square roots of the effective strains obtained (Fig. 7(b)) by FEM calculation, as shown Fig. 8. A roughly linear relationship between these two parameters was obtained, which is in good agreement with the relationship suggested by Eq. (3). In addition, it is important to note that the value of ��0 obtained by linear regression of the plot shown in Fig. 8 is approximately 323.4 MPa, which is extremely close to the value of ��0 (328.2 MPa) obtained experimentally. This indicates that the simulation results obtained in this work are highly reliable. The compression tests were conducted at ambient temperature and at an extremely low strain rate so that the time available for heat dissipation is sufficient to prevent adiabatic heating. The temperature distribution was almost homogeneous in the whole sample and no dynamic recrystallization or dynamic recovery occurred locally. Hence, the dislocation density distribution generated locally inside the deformed sample was not altered by the occurrence of these processes and, consequently, the relationship between the measured hardness and the calculated effective strain is in good agreement with that indicated by Eq. (3). However, in the cases of hot compression and high-speed cold compression processes, it will not be possible to derive an equation like Eq. (3) since dynamic recrystallization or dynamic recovery occurs locally from the position at high temperature and/or high local strain level will result in a drastic decrease in hardness and strain at the corresponding position.
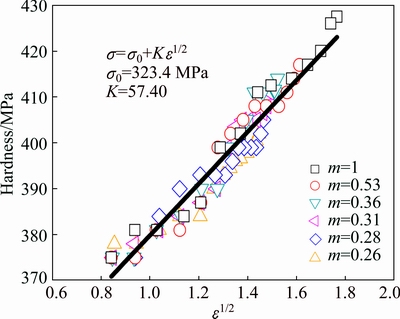
Fig. 8 Relationship between calculated effective strain inside compressed sample and measured hardness at corresponding points
5 Conclusions
(1) Although interfacial friction does not strongly influence the overall geometry of the compressed sample when the interfacial friction coefficient m>0.4, it strongly influences the strain distribution of the compressed sample, compared with that of a sample without interfacial friction.
(2) FEM analysis results indicate that the position at which the effective strain along Rm on the cross section of sample is equal to the equivalent strain of the sample does not vary in a great extent with both the equivalent strain of the sample and the friction coefficient.
(3) Hardness measurements along the vertical symmetric line of 5056B Al alloy samples with various friction coefficients are in good agreement with the effective strain distribution obtained by FEM analysis and it is observed that a quantitative relationship exists between these two parameters.
References
[1] WANG Feng-lin, LI Yun-ping, XIE Guo-qiang, WAKOH K, Yamanaka K, Koizumi Y, CHIBA A. Investigation on hot deformation behavior of nanoscale TiC-strengthened Cu alloys fabricated by mechanical milling [J]. Materials Science & Engineering A, 2016, 668: 1-12.
[2] LI Yun-ping, Koizumi Y, CHIBA A. Dynamic recrystallization in biomedical Co-29Cr-6Mo-0.16N alloy with low stacking fault energy [J]. Materials Science & Engineering A, 2016, 668: 86-96.
[3] LI Yun-ping, SUZUKI T, TANG Ning, Koizumi Y, CHIBA A. Microstructure evolution of SUS303 free-cutting steel during hot compression process [J]. Materials Science & Engineering A, 2013, 583: 161-168.
[4] Shi Zhao-xia, YAN Xiao-feng, DUAN Chun-hua, ZHAO Ming-han. Effect of strain rate on hot deformation characteristics of GH690 superalloy [J]. Transactions of Nonferrous Metals Society of China, 2017, 27(3): 538-550.
[5] Peng Jian, Wang Yong-jian, Zhong Li-ping, PENG Long-fei, PAN Fu-sheng. Hot deformation behavior of homogenized Al-3.2Mg-0.4Er aluminum alloy [J]. Transactions of Nonferrous Metals Society of China, 2016, 26(4): 945-955.
[6] LI Yun-ping, YE Xian-jue, LI Jia-xiang, ZHANG Yi, Koizumi Y, CHIBA A. Influence of cobalt addition on microstructure and hot workability of IN713C superalloy [J]. Materials & Design, 2017, 122: 340-346.
[7] LI Yun-ping, LI Jia-xiang, Koizumi Y, CHIBA A. Dynamic recrystallization behavior of biomedical Co-29Cr-6Mo-0.16N alloy [J]. Materials Characterization, 2016, 118: 50-56.
[8] LI Yun-ping, WU Shuo, BIAN Hua-kang, TANG Ning, LIU Bin, Koizumi Y, CHIBA A. Grain refinement due to complex twin formation in rapid hot forging of magnesium alloy [J]. Scripta Materialia, 2013, 68(3-4): 171-174.
[9] XU Zhao-Hua, LI Miao-quan, LI Hong. Plastic flow behavior of superalloy GH696 during hot deformation [J]. Transactions of Nonferrous Metals Society of China, 2016, 26(3): 712-721.
[10] GAO Zhen-yan, Grandhi R V. Microstructure optimization in design of forging processes [J]. International Journal of Machine Tools & Manufacture, 2000, 40(5): 691-711.
[11] Jiang Hai-tao, Tian Shi-wei, Guo Wen-qi, ZHANG Gui-hua, ZENG Shang-wu. Hot deformation behavior and deformation mechanism of two TiAl-Mo alloys during hot compression [J]. Materials Science & Engineering A, 2018, 719: 104-111.
[12] Chen F K, Chen Cheng-jun. On the nonuniform deformation of the cylinder compression test [J]. Journal of Engineering Materials & Technology, 2000, 122(2): 192-197.
[13] Evans R W, Scharning P J. Axisymmetric compression test and hot working properties of alloys [J]. Metal Science Journal, 2013, 17(8): 995-1004..
[14] Mirza M S, Sellars C M. Modelling the hot plane strain compression test: Part 1-Effect of specimen geometry, strain rate, and friction on deformation [J]. Metal Science Journal, 2001, 17(9): 1133-1141.
[15] Mirza M S, Sellars C M. Modelling the hot plane strain compression test: Part 2-Effect of friction and specimen geometry on spread [J]. Metal Science Journal, 2001, 17(9):1142-1148.
[16] LI W Q, MA Q X. Constitutive modeling for investigating the effects of friction on rheological behavior during hot deformation [J]. Materials & Design, 2016, 97: 64-72.
[17] Siebel E. Basics for calculating the force and work requirements of forging and rolling [J]. Stahl Eisen, 1923, 43: 1295-1301. (in German)
[18] Avitzur B. Metal forming: Process and analysis [M]. New York: McGraw-Hill, 1968: 102.
[19] Lee C H, Altan T. Influence of flow stress and friction upon metal flow in upset forging of rings and cylinders [J]. Journal of Engineering for Industry, 1972, 94(3): 775-782.
[20] AAL M I A E. 3D FEM simulations and experimental validation of plastic deformation of pure aluminum deformed by ECAP and combination of ECAP and direct extrusion [J]. Transactions of Nonferrous Metals Society of China, 2017, 27(6): 1338-1352.
[21] Zhang Kai, Marthinsen K, Holmedal B, Aukrust T, Segatori A. Through thickness variations of deformation texture in round profile extrusions of 6063-type aluminium alloy: Experiments, FEM and crystal plasticity modeling [J]. Materials Science & Engineering A, 2018, 722: 20-29.
[22] Li J C, Chen X W, Huang F L. Inhomogeneous deformation in bulk metallic glasses: FEM analysis [J]. Materials Science & Engineering A, 2015, 620: 333-351.
[23] LI A, PANG J, ZHAO Jun, ZANG Jian, WANG Fu-zeng. FEM-simulation of machining induced surface plastic deformation and microstructural texture evolution of Ti-6Al-4V alloy [J]. International Journal of Mechanical Sciences, 2017, 123: 214-223.
[24] LI Yun-ping, Onodera E, Chiba A. Evaluation of friction coefficient by simulation in bulk metal forming process [J]. Metallurgical & Materials Transactions A, 2010, 41(1): 224-232.
[25] LI Yun-ping, Onodera E, Matsumoto H, CHIBA A. Correcting the stress-strain curve in hot compression process to high strain level [J]. Metallurgical & Materials Transactions A, 2009, 40(5): 1255-1255.
[26] Roters F, Raabe D, Gottstein G. Work hardening in heterogeneous alloys��A microstructural approach based on three internal state variables [J]. Acta Materialia, 2000, 48(17): 4181-4189.
Բ����ѹ����������Ʒ-�о�Ħ���Ա��β������Ե�Ӱ��
Ҷ�Ծ�1��������1������1������ƽ1���� ��2
1. ���ϴ�ѧ ��ĩұ������ص�ʵ���ң���ɳ 410083��
2. ������Բ�ξ��ܼ����о�Ժ������ 518000
ժ Ҫ����������Ԫ����(FEM)ϵͳ�о���Ʒ��о�Ħ������m��Բ������Ʒ�ڱ��β������Ե�Ӱ�졣���������Ħ��ˮƽ�Ա��ξ����Ե�Ӱ��ʮ�����������ܵ�m> 0.4ʱѹ����Ʒ�����弸����״�������ֲ��䣬���β������Ի�����Ħ���������Ӷ������ѹ����Ʒ���������ЧӦ����ڵ�ЧӦ���λ���������Ʒ�ĵ�ЧӦ���Ħ���������Ա仯����5056B���Ͻ�Բ����ѹ��������Ӳ�Ȳ�������ЧӦ��ֲ��ı仯������Ԫ����������ơ�ʵ���������������ѹ��������û�з����ٽᾧ��ظ����������Ʒ��Ӳ������Ʒ�ڲ�����ЧӦ��֮����ڶ�����ϵ��
�ؼ��ʣ�ѹ����Ħ����������״����Բ���壻���β�������
(Edited by Bing YANG)
Foundation item: Project (2016JJ1016) supported by the Science Fund for Distinguished Young Scholars of Hunan Province, China; Project (201301G0105337290) supported by the Program of Innovation and Entrepreneur Team Introduced by Guangdong Province, China
Corresponding author: Yun-ping LI; Tel:+86-731-88830939; E-mail: lyping@csu.edu.cn
DOI: 10.1016/S1003-6326(19)64937-X
Abstract: Finite element (FEM) analysis was used to systematically evaluate the inhomogeneity of deformation in cylindrical samples with various sample-anvil friction coefficients, m. It was found that the level of friction strongly influences the deformation homogeneity, which increases significantly with the friction coefficient although the overall geometry of the samples almost remains the same when m>0.4. The position, at which the effective strain along the maximum radial direction in a compressed sample is equal to the equivalent strain of the sample, does not vary greatly with respect to both equivalent strain of the sample and m. Hardness measurements of compressed cylindrical 5056B Al alloy samples revealed a change of effective strain distribution similar to that revealed by FEM analysis. There exists a quantitative relationship between the hardness and the effective strain if no recrystallization or recovery occurs during the compression process.
