

J. Cent. South Univ. (2021) 28: 1875-1887
DOI: https://doi.org/10.1007/s11771-021-4736-4

Dynamic evolution of shear rate-dependent behavior of rock discontinuity under shearing condition
GU Lin-lin(������)1, WANG Zhen(����)2, 3, ZHANG Feng(�ŷ�)4, GAO Fei(�߷�)2, WANG Xiao(����)5
1. Department of Civil Engineering, Nanjing University of Science and Technology, Nanjing 210094, China;
2. School of Mechanical Engineering, Nanjing University of Science and Technology,Nanjing 210094, China;
3. State Key Laboratory of Disaster Prevention and Mitigation of Explosion and Impact,
The Army Engineering University of PLA, Nanjing 210014, China;
4. Department of Civil Engineering, Nagoya Institute of Technology, Nagoya 4668555, Japan;
5. School of Civil Engineering, Southeast University, Nanjing 210096, China
 Central South University Press and Springer-Verlag GmbH Germany, part of Springer Nature 2021
Abstract:
Rock blocks sliding along discontinuities can cause serious disasters, such as landslides, earthquakes, or rock bursts. The shear rate-dependent behavior is a typical time-dependent behavior of a rock discontinuity, and it is closely related to the stability of a rock block. To further study the shear rate-dependent behavior of rock discontinuities, shear tests with alternating shear rates (SASRs) were conducted on rock discontinuities with various surface morphologies. The dynamic evolution of the shear rate dependency was studied in detail based on the shear test results, and three stages were identified with respect to the shear stress and shear deformation states. The test results revealed that dynamic changes in shear stiffness and the energy storage abilities of the rock discontinuities occurred in relation to the shear rate-dependent behavior of crack growth, which increased with an increase in normal stress and/or the joint roughness coefficient. The stage of decreasing shear stiffness corresponded to a stage of noticeable shear rate-dependency, and the shear rate was found to have no influence on the initial crack stress.
Key words:
shear rate-dependent behavior; rock discontinuity; dynamic evolution; initial crack stress��
Cite this article as:
GU Lin-lin, WANG Zhen, ZHANG Feng, GAO Fei, WANG Xiao. Dynamic evolution of shear rate-dependent behavior of rock discontinuity under shearing condition [J]. Journal of Central South University, 2021, 28(6): 1875-1887.
DOI:https://dx.doi.org/https://doi.org/10.1007/s11771-021-4736-41 Introduction
Rock masses are divided into blocks by discontinuities such as faults and joints, and disasters such as earthquakes and landslides, and rock bursts can result from the sliding of a block along a discontinuity [1-4]. The monitoring of rock bursts and block sliding has shown the existence of time-dependent behavior [5]. The time-dependency of rock discontinuities increases the randomness of the disasters [6]; however, as the mechanisms involved remain unclear, forecasting related hazards is difficult.
Shear rate-dependent behavior is an important time-dependent behavior of rock discontinuities. As such, it has been the focus of many underground engineering studies that have aimed to understand and predict the occurrence of rock burst, rock collapse, and earthquakes associated with slip [7, 8]. In geology, the influence of the slip velocity on the frictional and stick-slip characteristics of discontinuities has been widely discussed, and it is known to be an important characteristic associated with the mechanism of earthquakes [9-12].
Many studies have used peak strength to evaluate the shear rate-dependent behavior.For example, JAFARI et al [13], and MIRZAGHORBANALI et al [14] reported a positive relationship between peak shear strength and the shear rate. ZHOU et al [15] indicated that with an increase in the shear rate, there was an initial increase in shear strength followed by a decrease. There are various reasons for obtaining conflicting results due to the complex factors, such as composition, surface morphology, normal stress, and the inhomogeneity of rock materials [16-19]. Moreover, the difference of samples and the slight difference of test may lead to some errors of the test result because of these complex influence factor.
A method, the alternative strain rate (ASR) test proposed by HASHIBA et al [20], studies the strain rate dependency of rock materials using a single sample, and the mechanism relating to the shear (strain) rate-dependent behavior of rocks was obtained by this method. In the study, alternated strain (shear) rate tests were employed to investigate the strain (shear) rate dependency of peak strength and its influential factors. However, although the dependence of shear strength on shear rates was extensively investigated, the results only showed that the shear strain rate had an influence on peak strength. Nevertheless, the studies found that the shear rate-dependent behavior varied dynamically with an increase in shear deformation during the shearing process. The stress-strain or stress-deformation diagrams relating to the test results demonstrated that strain (shear) rate dependency was closely related to the development of strain (deformation) or stress. Therefore, these results can be used to predict the characteristics of time-dependent behavior, such as creep and stress relaxation, in states with different stresses or deformations (strains). However, no further research has been carried out by these experimental investigations.
The surface morphology of rock discontinuities is an important factor affecting their shear rate-dependent behavior. In rock engineering projects, such as the construction of underground tunnels, joints or small-scale rock discontinuities are the main focus on determining the stability of rock blocks. However, the surface morphology of rock discontinuities has not yet been taken into account when conducting large-scale analyses of faults or slopes.
In this study, shear tests with alternating shear rates (SASRs) were carried out with cement-mortar discontinuity samples and natural (green schist) discontinuity samples, and the shear rate-dependent behaviors of the samples with different joint roughness coefficients (JRCs) were evaluated during the entire shearing process. The shear stiffness characteristics obtained from the shear tests were then used to further investigate the mechanisms involved in shear rate-dependent behavior.
2 Experimental
2.1 Sample
2.1.1 Cement-mortar discontinuity samples
Cement-mortar is considered to be a rock-like material, and it is often used to simulate rock or rock discontinuities owing to its good homogeneity. Studies have investigated the shear strength and time-dependent behavior of rock discontinuities by conducting tests on samples made of cement-mortar, and valuable results have been obtained [21-23].
In our tests, cement-mortar samples were used to investigate the shear rate-dependent behavior and clarify whether the mechanical properties were distinctly time-dependent. As shown in Table 1, a mixture with mass ratio of 1:2:4 (water, cement and sand) was used, and to reduce the differences between samples, pure water was used in the mixture. The diameter of sand grains used should not be larger than the minimum relief height of the rock discontinuity surface, as a coarse aggregate can influence the surface of the rock discontinuity as the surface fluctuation is sometimes very small.
Table 1 Physical-mechanical properties of cement-mortar

Therefore, fine sand with an average grain size of 0.25-0.35 mm was used in the mixture.
The steel molds used for the samples in the tests were manufactured in a mold vendor using high accuracy (0.1 ��m) computer numerical control. Barton��s standard profiles (1st, 4th, 7th, 10th) were used to cast and mold the samples [24]. The sample and Barton��s standard profiles (1st, 4th, 7th, 10th) are shown in Figure 1 [19], which also shows two iron molds (upper and lower parts) that were used to fabricate complete rock discontinuity sample. In Figure 1, Step 1 is to put the cement-mortar into steel mold and mix well; Step 2 is to shake the shaking table for an hour; Step 3 is to demould after 24 h; Step 4 is to standard cure for 28 d.
The cement-mortar was well stirred prior to being poured into the steel molds, and the molds were then shaken for an hour on a shaking table and then kept for 28 d in a standard curing room at a temperature of (20��1) ��C and humidity of 95%. Portland cement with a compression strength of more than 32.5 MPa was then acquired after 28 d in a standard curing room. The mechanical and physical properties of cement-mortar blocks were tested. The average density of one complete sample (including two blocks) was 2.03 g/cm3; the void ratio was 0.2, and the uniaxial compression strength (UCS) was 21.73 MPa. These results are also provided in Table 1, and they were used to identify the normal stresses relating to conducting SASRs.
2.1.2 Natural samples with rock discontinuities
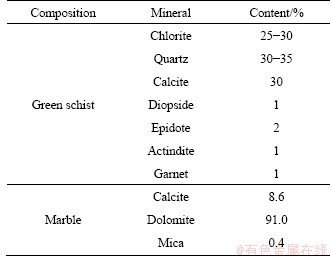
In this study, natural samples were obtained from a diversion tunnel of the Jinping II hydropower station. The mineralogy of the rock sample was investigated by a thin section identification method [23]. As shown in Table 2, the marble in the samples was composed of calcite, dolomite and mica. The green schist on the weak surface was mainly composed of chlorite, quartz, calcite and schistose structures with gray marble bands. Cementation was also observed in the natural sample with discontinuities. The surface of the rock discontinuity is shown in Figure 2 [22].
2.2 Testing equipment
In this study, a servo-controlled testing device for biaxial loading was employed to conduct shear tests and SASRs, as shown in Figure 3. The maximum compression loads in the vertical and horizontal directions were 500 and 300 kN, respectively. Two linear variable displacement transducers (LVDT), each with a range of 0-10 mm and a 1 ��m accuracy rate, were used to monitor the vertical and horizontal deformations. The loading rate was alternated over a very short time during the shear test, and recorded deformation data were the averages of the two measurements in each direction.
2.3 Test procedure
2.3.1 Direct shear tests
Cement-mortar samples with 1st (JRC=1), 4th (JRC=7), 6th (JRC=11), and 10th (JRC=19) Barton��s standard profile lines [24] were prepared to conduct the direct shear tests, which shows that normal stress (��n) was 30% (6.52 MPa) of the uniaxial compression strength (UCS). Normal stress was first applied to the predefined stress and was then held constant, and shear stress was applied at a constant shear rate of 0.01 mm/min until the sample underwent damage.

Figure 1 Preparation method for rock sample with artificial joint surface
Table 2 Mineral composition [23]
2.3.2 Shear test with alternating shear rates (SASRs) and data processing method
The shear rate was alternated between a slow shear rate (C1) and a fast shear rate (C2) at uniform deformation intervals (see lower part of Figure 4). Thick line indicates the experimentally obtained curve. The two thin lines indicate estimated curves for the two shear rates, C1 and C2, respectively. The white and black square represent locations where the shear rate is changed. The stress was found to increase and decrease abruptly when the shear rate was increased and decreased at the locations which were marked with different diamonds. Data processing was conducted according to the method proposed by HASHIBA et al [20]. A spline function [25] was used to plot the thin gray dotted-line and connect the black diamond symbols (see Figure 4), which represents the shear curve for the shear rate of C1. Similarly, the shear curve for the shear rate of C2 was drawn by connecting the white diamond symbols. A parameter, ns, was then proposed for evaluating the shear rate-dependent behavior throughout the shear tests. Two different shear stresses were obtained at the same deformation owing to the influence of the two shear rates, as seen in the dynamic stress-deformation curves. When the shear rate-dependent behavior was stronger, the difference between the two shear stresses was stronger, and the shear rate-dependent behavior was evaluated as follows:
 (1)
(1)
where ns-Dsis a coefficient used to evaluate the shear rate-dependent behavior of the rock discontinuity, ns, when the shear deformation was Ds; ��1-Dsis the shear stress at deformation Ds when the shear rate was C1; ��2-Dsis the shear stress at deformation Ds when the shear rate was C2; and ��s-2 is the shear strength (the maximum shear stress) when the shear rate was C2.

Figure 2 Geological profile and information of natural rock discontinuity sample
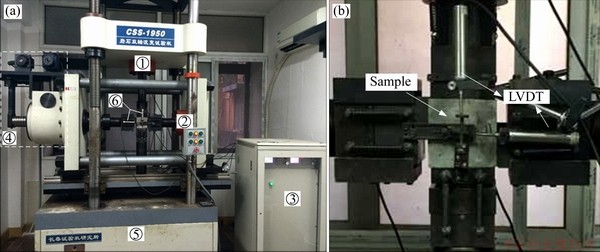
Figure 3 (a) Servo-controlled rheological testing device (CSS-1950) (��Normal force transducer; ��Horizontal force transducer; ��Servo controller; ��Horizontal loading system; ��Vertical loading system; ��Linear variable displacement transducer (LVDT)); (b) Sample and monitoring system
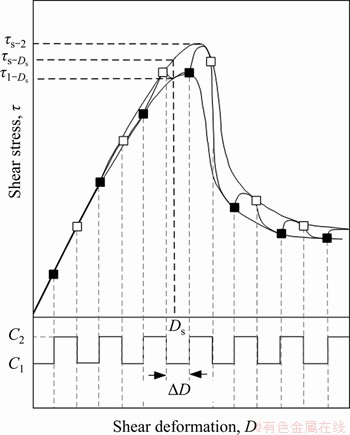
Figure 4 Schematic shear stress-shear deformation curve for alternate switching of shear rate from C1 to C2 at each predetermined interval ��D [19]
In this study, SASRs were conducted on both natural discontinuity samples and the cement-mortar samples with 1st, 4th, 6th and 10th profile lines, respectively. The ��n in SASRs was identified as 10%, 20%, and 30% of the UCS (actual values were 2.17, 4.35 and 6.52 MPa, respectively). The slow and fast shear rates were 0.001 and 0.01 mm/s, respectively, and the value of the uniform deformation intervals was 0.05 mm, which was obtained by the method proposed by HASHIBA et al [20]. The actual testing program used is listed in Table 3.
3 Results and discussion
3.1 Shear stiffness characteristics during shear tests
Crack growth damaged the sample and led to the non-linear shear deformation and stress curve characteristics [19], as shown in Figure 5. Shear stiffness can be used to reflect damage development in rock discontinuities, and calculated as follows:
 (2)
(2)
where ks is shear stiffness; ���� is the shear stress increment; ��D is the shear deformation increment.
According to the shear stiffness curves, four stages in the shear stress-shear deformation curve are identified as follows:
Stage I (OA in Figure 5): Climbing asperity was the main block movement mode during this stage. Crack closure was observed during this stage. The curves appeared to be concave (upwards) and shear stiffness was slightly increased.
Stage II (AB in Figure 5): Although an approximate linear relationship was observed from points A to B during this stage, stiffness increased and then decreased with the compression of asperities and crack growth. It indicated that the elastic stage of the shear stress-shear deformation curve was not strictly linear. Stage II was then divided into an elastic deformation stage (Stage II-1, AH) and a stage representing the stable development of the cracks (Stage II-2, HB). The development of cracks caused a decrease in shear stiffness: initial crack stress thus began at point H (at the point shear stiffness began to decrease).
Table 3 Information of alternated shear tests


Figure 5 Shear deformation-shear stress and shear stiffness curves:
Stage III (BC in Figure 5): There is a significant decrease in shear stiffness from points B to C, which indicated that the development of the cracks was unstable. During this stage, cracks in the asperities of the rock discontinuities developed rapidly. In addition, the shear stress-shear deformation curve changed from linear to convex. When shear stiffness decreased to 0, peak shear strength (��s) was then observed.
Stage IV (CD in Figure 5): When the shear stress reached peak strength, the cracks coalesced; asperities were sheared off; and the blocks began to slide along the surface. From points C to K, shear stiffness was lower than zero (Stage IV-1). This indicated that the release of energy in the sample led to automatic deformation of the rock blocks along the surface in a horizontal direction. As the deformation increased, the stiffness tended to become 0; the blocks began to slide along the surface; and the shear stress achieved residual strength (Stage IV-2). Finally, the groove was filled, and a new flatter slip surface appeared.
3.2 Dynamic evolution of shear rate dependence of rock discontinuity during shear test
3.2.1 Fluctuation characteristics during SASRs on cement-mortar sample with discontinuity
The results of the SASRs are shown in Figure 6, showing evident that fluctuations of the stress occurred with the alternation of shear rate. Experimental data are represented by thick black lines, while spline interpolation is represented by thin grey dot lines with C1=0.001 mm/s, C2=0.01 mm/s, ��D=0.05 mm; Equation (1) can be used to calculate the parameter ns, and larger value of ns shows a stronger dependence on the shear rate. Therefore, the parameter ns was used to evaluate the shear rate-dependent behavior of the rock discontinuity during the shear process. As shown in Figure 6, the value of ns increased and then decreased during the shear stress process. It was close to zero at the beginning of the shear test when there was negligible variation in the stress owing to a change in the shear rate, but after the stress level was close to the initial crack stress was exceeded, ns increased quickly. This indicated that crack growth was an important factor influencing the shear rate-dependent behavior of the rock discontinuities. When ns reached its maximum value, shear stress was close to that at point B in Figure 5. These curves were also divided into three stages according to the fluctuation characteristics and variations in parameter ns.
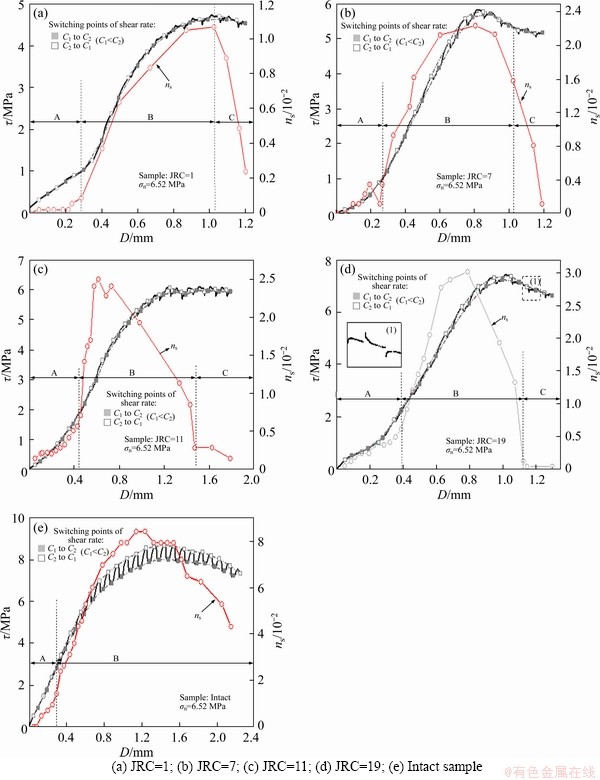
Figure 6 Shear stress and deformation curves of alternate shear rate tests and variations of parameter ns in shear processes when ��n=6.52 MPa:
Stage A (smooth stage): There were almost no stress variations or fluctuations relating to shear rate changes in area A during this stage. As shown in Figure 6, this stage related to Stages I and II-1 of the direct shear tests. The initial crack stress (point H) was the point of critical stress, and the curves began to exhibit an evident shear rate dependency. The curves in this stage were not sensitive to shear rate variations, which shows that shear rate-dependent behavior was not evidently prior to the initial crack stress occurrence, as it was mainly confined to elastic deformation or elastic energy. However, weak shear rate-dependent behavior can still be observed in Figure 6, which may be caused by local random crack growth.
Stage B (stage of evident fluctuations): Curves were greatly influenced by the shear rate following initial shear stress during this stage. The value of ns first increased and then decreased. The magnitude of its fluctuation was largest prior to attaining peak strength, and it then gradually decreased (area B in Figure 6). The value of shear stress when ns was at its maximum was close to that when shear stiffness was at its maximum. This stage began at the initial point of crack stress (point H in Figure 5), at approximately 30%-40 % of peak strength, and it ended when the cracks coalesced (corresponding to point K in Figure 5). This phenomenon indicates that the shear rate-dependent behavior was closely related to the development of cracks. Furthermore, when the JRC was large, it provided more ��space�� for crack development, and a larger number of asperities were cut during the shearing process. Therefore, the duration of Stage B was closely related to the JRC value. In addition, when the JRC was larger, the duration of Stage B was longer. It was also possible to observe recoverable elastic deformation and unrecoverable plastic deformation or crack growth. This stage corresponded with the stage of decreasing shear stiffness (from points H to K in Figure 5).
Stage C (oscillation stage): this stage occurred after peak strength had been reached. The switching of the shear rates caused a sudden change in the stress-deformation curve, which then quickly returned to the same stress-deformation trajectory line with no fluctuation features. As shown in Figure 6, the low rate shifts at C1 caused a decrease in the stress difference, and it then picked up and continued along the line of the usual deformation curve. In addition, the high rate shifted at C2 led to an increase in the stress difference before it then connected again to the usual curve. This stage corresponded with the sliding stage in the shear tests (Stage IV-2, KD in Figure 5) when only plastic deformation was observed and the shear stiffness was zero. Therefore, if the asperities had still existed and had not been completely cut off, this stage would not have been observed, as shown in Figure 6(e). In addition, if the residual JRC had continued to exist after carrying out the shear tests on an intact sample, Stage C would not have been observed when conducting SASRs on the intact sample. Therefore, greater deformation and a larger number of cracks were more likely to occur if the JRC of the rock discontinuity was large, which indicating that asperities of the rock discontinuity needed to be completely cut off to enable Stage C to be reached.
3.2.2 Results of SASR tests on natural discontinuity
The results of the SASRs conducted on natural samples were similar to the results presented above in Section 3.2.1. As shown in Figure 7, the curves had similar characteristics to those of the cement-mortar samples, and three stages were evident. As shown in Figure 7(a), the curves were not influenced by the shear rates when shear stress was low, as elastic deformation was the main component. However, when the shear stress approached the stress of point M in Figure 7(a) (where the test entered Stage B), evident cracks appeared with a loud ��bang�� sound, and fluctuations were observed. Owing to the high normal stress and rough surface, Stage C was not observed, as shown in Figure 7(a). However, from the curves in Figure 7(b), it is evident that the test entered Stage C after reaching peak strength.

Figure 7 Shear tests with alternated shear rates of natural rock discontinuity:
3.2.3 Influence of normal stress and JRC on SASRs
The fluctuations became more noticeable when the normal stress and JRC were larger (Figure 8) [19]. The maximum value of the parameter ns was calculated, and it was found to increase with an increase in the JRC value and ��n, as shown in Figure 9. Due to various JRCs of the natural sample, the above characteristics are not obvious. In addition, ��n and JRC interacted with each other and subsequently influenced the shear rate behavior of the rock discontinuities. For example, in the tests of samples under normal stress at 2.17 MPa (Figure 9), the value of ns in the tests with JRC=7 was larger than that of tests with JRC=11, but it was lower than that of tests with JRC=11 when ��n was 6.52 MPa. This indicates that when ��n was 2.17 MPa, the JRCs did not operate effectively; the asperities were cut off in the shear process were smaller than those in the tests with JRC=7; and the shear rate-dependent behavior was weaker. The contact area could be recorded using the surface data after shear tests as shown in Figure 10(a). The shear area could reflect the contact area during the shear process as the asperities was cut off along the line connected with the contact points, such as d1, d2, d3 in Figure 10. In Figure 10(c), the profile lines of the contact area in the tests with different normal stresses were d1<>2<>3, which means the contact area increased with the increase of the normal stress. The surfaces of the rock discontinuity were in full contact, and more asperities were cut off in the shearing process when normal stress was high (such as 6.52 MPa) in the tests, indicating that the shear rate-dependent behavior was more evident. The duration of Stage II was also influenced by the above-mentioned factors. Fluctuations were not as evident in Stages II and III and they appeared earlier. For example near the region of peak strength, when the JRC value was small.

Figure 8 Test results of shear tests with alternated shear rates under different normal stresses:

Figure 9 Relationships between maximum ns and normal stress (��n) of rock discontinuities with different JRC
When the JRC value and normal stress were large, the cutting of asperities gradually became the primary shear mode [19] and the fluctuations became more evident. Thus, a relationship was established between the fluctuations and the shear mode, and asperities were cut and friction appeared during the shearing process. If the cutting of asperities was the main mode of decreasing shear stiffness, the fluctuations would have been more noticeable. This result also indicates that the rock discontinuity had a strong shear rate dependency.
3.3 Mechanism involved in fluctuations during SASRs
Prior to shear stress reaching the initial crack stress, deformation was mainly caused by elastic deformation and closure of the surface. Although the switch in shear rates caused a sudden change, the elastic energy stored in the discontinuity provided enough energy to allow the rock discontinuity to maintain shear rates that were equal to the loading plate. The effects of the alternating shear rates on shear curves were not very noticeable, and minimal fluctuations were observed in the shear curves when elastic energy existed in the rock discontinuity. Thus, the curve remained smooth, even when the shear rates were alternated. The shear rate dependency of the rock discontinuity was limited before the initial crack stress.

Figure 10 Shear process of rock discontinuity under different normal stress (Shear area: d1��<>d2��d3):
When the shear stress reached the initial crack stress, the energy provided by the test equipment was divided into two areas. One part was stored in the rock discontinuity as elastic energy and the other was consumed by the development of cracks in the asperities. The development of cracks led to a decrease in shear stiffness and the energy storage ability. Thus, the energy stored in the rock discontinuity was not adequate to support the sample following the variation in shear rates. However, when the loading rate of the loading plate decreased within a short time, the shear rates of rock discontinuity would not immediately decrease. Therefore, the shear rates remained high. As shown in Figure 11, the velocity of the loading plates was smaller than that of the sample (v1<>2). The difference in the shear rates caused a decrease in contact pressure and a drop in shear stress (as monitored by the test equipment). When the loading rate increased, the velocity of the loading plates also suddenly increased, and the sample maintained the same rates as before: v1>v2. In addition, the contact pressure increased with the difference between the shear rates. In this stage, the deformation contained elastic and plastic deformation, which were caused by asperity cutting and crack development. After the shear rates had been alternated, the extra time was taken to release the energy and to develop cracks. Therefore, the curves began to warp, and they gradually entered the track line of the corresponding shear rate.

Figure 11 Mechanism of fluctuation in shear tests with alternated shear rates
After the asperities were sheared off, the cracks coalesced, and the block began to slide along the surface. The main deformation type was plastic deformation caused by sliding, and negligible crack development occurred. In addition, no elastic energy was stored during the test. Therefore, after the shear rate variation had occurred, the stress-deformation curve underwent a temporary shock, while the stress-deformation trajectory was not maintained at that rate. The time-dependent growth of crack was the main cause of the shear rate-dependent behavior of the rock discontinuity [26].
3.4 Some speculative results
3.4.1 Standard curves obtained from SASRs
Variations in the shear rate did not influence the shape of the shear stress and shear deformation curves prior to initial crack stress being reached while conducting the shear tests. Once the cracks began to develop, the shear rate influenced on the morphology of the curves greatly, as shown in Figure 12(a), the curves of the tests with different shear rates (C2>C1>C3) corresponded to different trajectories which correspond to Stage B or stages II-IV which mentioned in Sections 3.1 and 3.2.1. However, when the shear mode tended towards sliding, no cracks developed, and the curve shape resembled that shown in Figure 12(b). Furthermore, the alternation of shear rates caused a shock to the curve, and only one trajectory existed. The results of the SASRs thus prove that the shear rate dependency of a rock discontinuity is closely related to the time-dependent behavior of crack development.
3.4.2 Shear stiffness and crack growth
Crack growth caused a decrease in shear stiffness and reflected the energy storage ability of the rock discontinuity. The feature points that formed the basis for dividing the SASRs into three stages were almost similar to those of shear stiffness during the direct shear test. For example, the point separating Stages A and B corresponded to the initial crack point in Figure 5 and the maximum stiffness value, and the point representing entry into Stage C was the point at which shear stiffness was zero. The stage of decreasing shear stiffness also corresponded with Stage B in the SASRs, and a noticeable shear rate-dependent behavior was evident. Hence, it was necessary for the sample to store energy to exhibit shear rate-dependent behavior during the shearing tests. However, even though its energy storage ability was adequate prior to the initial crack stress, its shear rate-dependent behavior was not very noticeable, as no cracks developed. In general, crack growth and elastic energy resulted in the shear rate dependency of rock discontinuities.

Figure 12 Shear curves of shear tests with alternated shear rates:
3.4.3 Initial crack stress
The initial crack stress corresponded to the point at which shear stiffness was at its maximum, and the stress when the shear tests entered Stage B showed an evident shear rate-dependent behavior. Prior to the occurrence of initial crack stress, the alternation of shear rates had little effect on the shear curves, and no fluctuations were observed during the SASRs. It revealed that the shear rate had no influence on the initial crack stress.
4 Conclusions
The time-dependent behavior of a rock discontinuity differs under different stresses or deformation states. Shear rate-dependent behavior is a typical time-dependent behavior of a rock discontinuity, and it is important for the explanation of the occurrence mechanism of collapse, rockburst, and even earthquake motions. In this study, SASRs were conducted on cement-mortar and natural discontinuity samples, the shear rate-dependent characteristics of rock discontinuities were analyzed while conducting shearing tests, and the dynamic evolution of the shear rate-dependent behavior was evaluated in detail. The influences of normal stress and the JRC value on the shear rate-dependent behavior were also studied in detail. From the results, the following conclusions were drawn:
1) The results of SARS illustrated that the shear rate-dependent behavior changed dynamically throughout the shearing process. The curves associated with the SASRs can be divided into three stages according to their characteristics: a smooth stage, stage of evident fluctuations, and an oscillation stage. In the stage of evident fluctuations, the discontinuity exhibited noticeable shear rate-dependent behavior, but no shear rate-dependent behavior was observed during the smooth and oscillation stages. It was evident that the shear rate-dependent behavior had a close relationship with shear stress and deformation states.
2) The three stages determined during SASRs corresponded to shear stiffness stages. The stage of decreasing shear stiffness related to crack development and corresponded with the evident fluctuation stage. Therefore, shear rate-dependent behavior was evident based on the existence of cracks. Shear rate-dependent behavior thus had a close relationship with shear stiffness and crack growth during the shearing process.
3) Normal stress and the JRC were found to have strong influences on the shear rate-dependent behavior. Rock discontinuities can store large amounts of energy, and they provided more ��space�� for cracks to develop when normal stress and JRC values were large. Thus, the shear rate-dependent behavior became stronger, and the duration of the evident fluctuation stage was longer.
4) As minimal shear rate-dependent behavior was observed prior to initial crack stress, it was evident that the shear rate had no influence on the initial crack stress.
Contributors
GU Lin-lin provided the concept and edited the draft of the manuscript. WANG Zhen conducted the literature review, tests and wrote the first draft of the manuscript. ZHANG Feng developed the idea for the study. GAO Fei and WANG Xiao analyzed the data. All authors contributed to the writing and revisions.
Conflict of interest
GU Lin-lin, WANG Zhen, ZHANG Feng, GAO Fei, WANG Xiao declare that they have no conflict of interest.
References
[1] GOMBERG J, BEELER N M, BLANPIED M L, BODIN P. Earthquake triggering by transient and static deformations [J]. Journal of Geophysical Research: Solid Earth, 1998, 103(B10): 24411-24426. DOI: 10.1029/98jb01125.
[2] OPPIKOFER T, JABOYEDOFF M, BLIKRA L, DERRON M H, METZGER R. Characterization and monitoring of the Aknes rockslide using terrestrial laser scanning [J]. Natural Hazards and Earth System Sciences, 2009, 9(3): 1003-1019. DOI: 10.5194/nhess-9-1003-2009.
[3] ARAKI E, SAFFER D M, KOPF A J, WALLACE L M, KIMURA T, MACHIDA Y, IDE S, DAVIS E. Recurring and triggered slow-slip events near the trench at the Nankai Trough subduction megathrust [J]. Science, 2017, 356(6343): 1157-1160. DOI: 10.1126/science.aan3120.
[4] JARAMILLO C A. Impact of seismic design on tunnels in rock-Case histories [J]. Underground Space, 2017, 2(2): 106-114. DOI: 10.1016/j.undsp.2017.03.004.
[5] CHEN Bing-rui, FENG Xia-ting, MING Hua-jun, ZHOU Hui, ZENG Xiong-hui, FENG Guang-liang, XIAO Ya-xun. Evolution law and mechanism of rockburst in deep tunnel: Time delayed rockburst [J]. Chinese Journal of Rock Mechanics and Engineering, 2012, 31(3): 561-569. (in Chinese)
[6] BYKOV V G. Strain waves in the Earth: Theory, field data, and models [J]. Russian Geology and Geophysics, 2005, 46(11): 1176-1190.
[7] FAHIMIFAR A, SOROUSH H. Effect of time on the stress�Cstrain behaviour of a single rock joint [J]. Bulletin of Engineering Geology and the Environment, 2005, 64(4): 383-396. DOI: 10.1007/s10064-005-0003-4.
[8] PATERSON M S, WONG T F. Friction and sliding phenomena [M]// Experimental Rock Deformation��The Brittle Field. Berlin, Heidelberg: Springer-Verlag, 165-209. DOI: 10.1007/3-540-26339-x_8.
[9] BRACE W F, BYERLEE J D. Stick-slip as a mechanism for earthquakes [J]. Science, 1966, 153(3739): 990-992. DOI: 10.1126/science.153.3739.990.
[10] DIETERICH J H. Time-dependent friction in rocks [J]. Journal of Geophysical Research Atmospheres, 1972, 77(20): 3690-3697. DOI: 10.1029/jb077i020p03690.
[11] SCHOLZ C H. The mechanics of earthquakes and faulting [M]. Cambrige: Cambrige University Press, 1990, 17(1): 73-91. DOI: 10.1017/9781316681473.
[12] REBER J E, HAYMAN N W, LAVIER L L. Stick-slip and creep behavior in lubricated granular material: Insights into the brittle-ductile transition [J]. Geophysical Research Letters, 2014, 41(10): 3471-3477. DOI: 10.1002/2014GL059832.
[13] JAFARI M K, AMINI HOSSEINI K, PELLET F, BOULON M, BUZZI O. Evaluation of shear strength of rock joints subjected to cyclic loading [J]. Soil Dynamics and Earthquake Engineering, 2003, 23(7): 619-630. DOI: 10.1016/S0267-7261(03)00063-0.
[14] MIRZAGHORBANALI A, NEMCIK J, AZIZ N. Effects of shear rate on cyclic loading shear behavior of rock joints under constant normal stiffness conditions [J]. Rock Mechanics and Rock Engineering, 2014, 47(5): 1931-1938. DOI: 10.1007/ s00603-013-0453-0.
[15] ZHOU Hui, MENG Fan-zhen, ZHANG Chuan-qing, YANG Fan-jie, LU Jing-jing. The shear failure characteristic of the structural plane and its application in the study of slip rock burst [J]. Chinese Journal of Rock Mechanics and Engineering, 2015, 34(9): 1729-1738. DOI: 10.13722/j.cnki.jrme.2014. 0337. (in Chinese)
[16] CRAWFORD A M, CURRAN J H. The influence of shear velocity on the frictional resistance of rock discontinuities [J]. International Journal of Rock Mechanics and Mining Sciences & Geomechanics Abstracts, 1981, 18(6): 505-515. DOI: 10.1016/0148-9062(81)90514-3.
[17] ATAPOUR H, MOOSAVI M. The influence of shearing velocity on shear behavior of artificial joints [J]. Rock Mechanics and Rock Engineering, 2014, 47(5): 1745-1761. DOI: 10.1007/s00603-013-0481-9.
[18] ZHENG Bo-wen, QI Sheng-wen, ZHAN Zhi-fa, et al. Effect of shear rate on the strength characteristics of rock joints [J]. Journal of Earth Sciences and Environment, 2015, 37(5): 101-110.
[19] WANG Zhen, GU Lin-lin, SHEN Ming-rong, ZHANG Feng, ZHANG Guo-kai, DENG Shu-xin. Influence of shear rate on the shear strength of discontinuities with different joint roughness coefficients [J]. Geotechnical Testing Journal, 2020, 43(3): 20180291. DOI: 10.1520/gtj20180291.
[20] HASHIBA K, OKUBO S, FUKUI K. A new testing method for investigating the loading rate dependency of peak and residual rock strength [J]. International Journal of Rock Mechanics and Mining Sciences, 2006, 43(6): 894-904. DOI: 10.1016/j.ijrmms.2005.12.005.
[21] PATTON F D. Multiple modes of shear failure in rock.1st ISRM Congress [C]// The 1st Congress of the International Society of Rock Mechanics. Lisbon. 1966: 509-513.
[22] EINSTEIN H H, VENEZIANO D, BAECHER G B, O'REILLY K J. The effect of discontinuity persistence on rock slope stability [J]. International Journal of Rock Mechanics and Mining Sciences & Geomechanics Abstracts, 1983, 20(5): 227-236. DOI: 10.1016/0148-9062(83)90003-7.
[23] WANG Zhen, GU Lin-lin, SHEN Ming-rong, ZHANG Feng, ZHANG Guo-kai, WANG Xiao. Shear stress relaxation behavior of rock discontinuities with different joint roughness coefficient and stress histories [J]. Journal of Structural Geology, 2019, 126: 272-285. DOI: 10.1016/j.jsg.2019.06. 016.
[24] BARTON N. Suggested methods for the quantitative description of discontinuities in rock masses [J]. International Journal of Rock Mechanics and Mining Sciences & Geomechanics Abstracts, 1979, 16(2): 22. DOI: 10.1016/ 0148-9062(79)91476-1.
[25] CONTE S D, de BOOR. Elementary numerical analysis (an algorithmic approach) [M]. New York: McGraw-Hill College, 1972.
[26] POTYONDY D O. Simulating stress corrosion with a bonded-particle model for rock [J]. International Journal of Rock Mechanics and Mining Sciences, 2007, 44(5): 677-691. DOI: 10.1016/j.ijrmms.2006.10.002.
(Edited by ZHENG Yu-tong)
���ĵ���
���������½ṹ��������������ԵĶ�̬�ݻ�
ժҪ����ʯ�����ؽṹ�滬�����������ص��ֺ����绬�¡�������ұ��ȡ��ṹ��ļ���������������һ�ֵ���ʱЧ���ԣ�����������ȶ���������ء�Ϊ�������о��ṹ��ļ��������������ԣ��Զ��ֱ�����̬����Ľṹ�濪չ�˽���任�������ʵļ������飬�Լ��������м������������ԵĶ�̬�ݻ����̽�����ϸ�о��������ݼ���Ӧ���ͼ��б���״̬���仮��Ϊ�����Ρ�����������ṹ��ļ��иնȺ��������������Ķ�̬�ݻ���������չ�ļ���������������أ������ŷ���Ӧ���ͽṹ��ֲڶ�ϵ�������Ӷ����ӣ�������������������иնȽ��ͽξ���һ���ԣ����������ʴ�С������Ӧ��û��Ӱ�졣
�ؼ��ʣ��������������ԣ�����ṹ�棻��̬�ݻ�������Ӧ��
Foundation item: Projects(42002266, 51908288) supported by the National Natural Science Foundation of China; Project(2020M673654) supported by the Chinese Postdoctoral Science Foundation; Project(2019K284) supported by Jiangsu Post-doctoral Research Funding Program, China
Received date: 2020-09-16; Accepted date: 2021-03-10
Corresponding author: WANG Zhen, PhD, Lecturer; Tel: +86-13016950388; E-mail: wangzhen2012@njust.edu.cn; ORCID: https://orcid.org/0000-0002-8081-2003
Abstract: Rock blocks sliding along discontinuities can cause serious disasters, such as landslides, earthquakes, or rock bursts. The shear rate-dependent behavior is a typical time-dependent behavior of a rock discontinuity, and it is closely related to the stability of a rock block. To further study the shear rate-dependent behavior of rock discontinuities, shear tests with alternating shear rates (SASRs) were conducted on rock discontinuities with various surface morphologies. The dynamic evolution of the shear rate dependency was studied in detail based on the shear test results, and three stages were identified with respect to the shear stress and shear deformation states. The test results revealed that dynamic changes in shear stiffness and the energy storage abilities of the rock discontinuities occurred in relation to the shear rate-dependent behavior of crack growth, which increased with an increase in normal stress and/or the joint roughness coefficient. The stage of decreasing shear stiffness corresponded to a stage of noticeable shear rate-dependency, and the shear rate was found to have no influence on the initial crack stress.
