
Trans. Nonferrous Met. Soc. China 22(2012) s294-s301
Plastic damage of T-shape hydroforming
TENG Bu-gang1,2, YUAN Shi-jian1,2, CHEN Zeng-tao3, JIN Xue-run4
1. National Key Laboratory for Precision Hot Processing of Metals, Harbin Institute of Technology, Harbin 150001, China;
2. School of Materials Science and Engineering, Harbin Institute of Technology, Harbin 150001, China;
3. Department of Mechanical Engineering, University of New Brunswick, Fredericton, NB E3B 5A3, Canada;
4. FAW Car Co., Ltd., Changchun 130011, China
Received 28 August 2012; accepted 25 October 2012
Abstract:
The Gurson-Tvergaard-Needleman model (GTN model) was employed to analyze bursting behavior in the hydroforming of stainless steel T-shape. A free-bulging test combined with simulation was conducted to determine the critical porosity and the failure porosity in GTN model. The effects of the forming pressure and the axial feeding on damage development were investigated and the influences of stress triaxiality and the plastic strain on porosity variation were also studied. The results show that a higher forming pressure or a less axial feeding will lead to bursting failure. The stresses of the top of protrusion are in bi-axial tension state, while the stresses of the side wall of main tube are in hoop tension state and axial compression state, respectively. The plastic strain has a more significant influence on the porosity than the stress triaxiality under the lower internal pressure; however, the stress triaxiality will govern the growth of porosity under the higher internal pressure. The simulation results give a good agreement with the experimentally determined thickness, and the maximum thickness-thinning rate is about 36%.
Key words:
T-shape; hydroforming; GTN model; damage; bursting fracture; porosity; internal pressure;
1 Introduction
Hydroforming of tubes is an attractive near-net shape manufacturing technique as it can produce low weight, high strength and uniform parts while eliminating traditional stamping and welding operation [1,2]. In tube hydroforming, it is required that the tubular blank should be formed into a die cavity of desired shape without any kind of defects, such as bursting, wrinkling or buckling. Bursting failure is a major failure mode in tube hydroforming as the result of excessive high internal pressure or less axial feeding [3].
In general, a frequently used technique for evaluating busting failure in sheet metal forming is the forming limit diagram (FLD), where principal strain pairs are compared with a forming limit curve (FLC). However, the FLD suffers from some well-known weaknesses. The experimentally determined FLD is definitely dependent on the forming history and strain path to failure which constructs the FLC is assumed to be proportional [4]. So it cannot be used to predict the formability limit in tube hydroforming, which subjects to a complicated stress state [5].
The forming limit stress diagram (FLSD) represents a failure criterion formulated by principal stresses. FLSD is much less sensitive to the strain path effect than the FLD, because material strain hardening and material anisotropy are also considered [6]. KIM et al [7] developed the theoretical FLSD based on the local necking criterion to predict bursting failure in tube hydroforming processes. The proposed analytical approach based on the implementation of the FLSD was verified with a series of bulge tests in three different loading cases and showed a good agreement with the experimental results. SIMHA et al [8] and SORINE et al [9] used an extended stress-based forming limit curve (XSFLC), which is derived from the strain-based FLC for the tube obtained from free expansion tests, to predict necking pressures during hydroforming high-strength- low-alloy (HSLA) and DP600 steel tubes.
A micromechanics has been extensively used in order to analyze and predict ductile fracture by modeling void nucleation, growth and coalescence. Various continuum damage models for materials with microvoids have been developed over the past few decades, starting with the works of McCLINTOCK [10], RICE and TRACEY [11] and GURSON [12]. Among them, Gurson-Tvergaard- Needleman (GTN) [13,14] approach is one of the well- known microscale models for ductile fracture which is extensively used for different materials and processes. ABBASI et al [15] predicted the FLD of tailor welded blank using ABAQUS software, in which the GTN model was applied as a failure criterion. VARMA et al [16] analyzed the localized necking of free hydroforming aluminium alloy tubes using an anisotropic version of the Gurson model and studied the influence of loading conditions, such as prescribed fluid pressure or volume flow rate in conjunction with axial end feed. CHEN et al [17] investigated the stretch flange forming of Al-Mg sheet AA5182 by using a combined GTN/damage percolation model, and subsequently, gave a predictive formability band combined with SUN and WANG��s lower bound model [18]. BUTCHER et al [19] also used a variant of GTN model to study the fracture behavior of hydroforming of an advanced high strength steel tube (DP600), and the predicted burst pressure, formability and fracture location from the simulation are in good agreement with the experiment values.
The distribution of stress and strain in T-shape hydroforming can be precisely obtained by the numerical simulation, but the prediction of ductile fracture is still immature. It is significant to understand the effect of the related process parameters on bursting failure during hydroforming process. Here, the GTN model was employed to analyze bursting behavior in T-shape hydroforming. The effects of the forming pressure and the axial feeding on plastic damage were investigated. The porosity and stress history of typical positions were analyzed. The influences of stress triaxiality and the plastic strain on porosity variation were analyzed.
2 Damage model
The ductile failure process in metals involves void nucleation, growth and coalescence. Further, the development of porosity induces hydrostatic-stress- dependence on yield. GURSON [12] proposed an elastic-plastic continuum damage model which can represent the above effects. TVERGAARD [13] introduced three calibration parameters into the model: q1��1-1.5, q2��1 and  . In the present work, we assume q1=1.5, q2=1 and q3=2.25.
The Gurson�CTvergaard�CNeedleman (GTN) yield criterion is written as
 (1)
(1)
where ���� is von Mises stress;  and ��m are the flow stress and mean stress, respectively; f *is the current effective void volume fraction, which is a function established by TVERGAARD and NEEDLEMAN [14] to simulate the rapid void growth after coalescence:

 (2)
(2)
where fc is the value of the void volume fraction at the onset of void coalescence and fF is its value at final failure.
Damage evolution in the material is expressed as the sum of void growth and nucleation:
 (3)
(3)
The growth rate of voids is proportional to the hydrostatic component of the plastic strain rate,  , as follows:
 (4)
(4)
Void nucleation is considered to be strain-controlled, and the increase in porosity can be written as
 (5)
(5)
where fN is the volume fraction of void nucleating particles; ��N is the mean strain for nucleation; sN is the standard deviation of ��N, assuming a normal distribution in the damage model; ��p is the von Mises plastic strain;  is the von Mises plastic strain rate.
In this work, the values of f0, fN, ��N and sN for the material used in the GTN model are 0.0001%, 0.014, 0.3055 and 0.01 respectively [20]. The critical porosity fc and the failure porosity fF are determined by the inverse approach, in which the results of free-bulging of tube are compared numerically and experimentally.
3 Test material, facility and procedures
3.1 Material
The tube material was 1Cr18Ni9Ti (China). To determine the mechanical properties of the tube, tensile specimens were cut from the tube. The chemical composition and material properties of the 1Cr18Ni9Ti stainless steel are presented in Tables 1 and 2, respectively.
3.2 Hydroforming machine and setup
The special hydroforming machine used in the trials is illustrated in Fig. 1(a). It consists of a hydraulic press for closing the die, three horizontal cylinders, a pressure intensifier, a hydraulic drive system and a computer control system. The major parameters are: the maximum internal pressure=400 MPa, the closing force=3150 kN, the left and right horizontal axial force=800 kN and the middle horizontal axial force=500 kN, which provides the support for the counterpunch. The lower die used for the experiment is shown in Fig. 1(b).
Table 1 Chemical composition of 1Cr18Ni9Ti (China) (mass fraction, %)
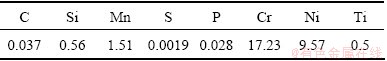
Table 2 Mechanical properties of tube used from tensile tests
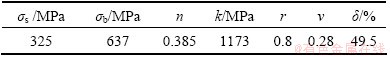
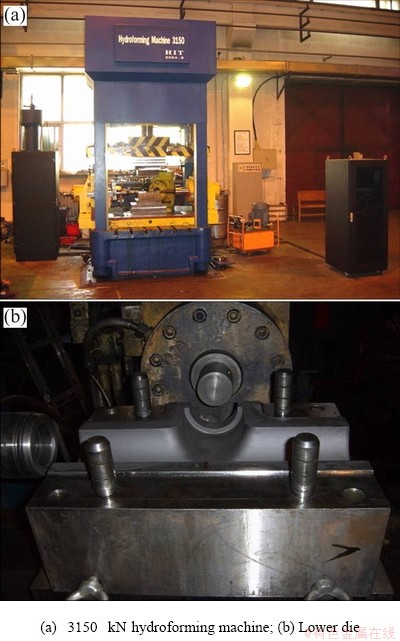
Fig. 1 Experimental equipment and setup
3.3 Procedure
The process of hydroforming involves the following steps: firstly, the tube is placed in the die; secondly, the tube is filled with liquid after the die is closed, and punches are used to seal; then, axial feed force is imposed by punches and some pressurize medium is added to form the tube at the same time. T-shape forming also needs a counterpunch to push the top of the protrusion to avoid premature rupture. A blank tube with outer diameter of 103 mm, initial length of 340 mm and wall thickness of 1.5 mm is used. The diameter of the protrusion is equal to that of the main tube, and the height of the protrusion is designed as 55 mm. The fillet radius between the main tube and the protrusion is 25 mm, and the initial distance between the counterpunch and the tube is 0. The lubricant used is formulated with MoS2 (spray type) and is applied to the die and outer tube surface. Figure 2 shows the hydroforming principle and geometric shape of T-shape.
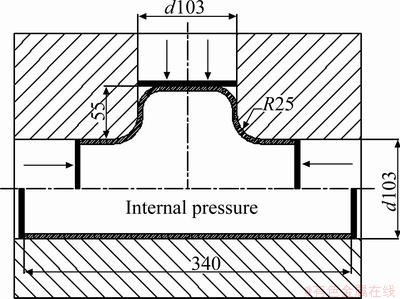
Fig. 2 Schematic diagram of T-shape hydroforming (unit: mm)
4 Simulation and experiment of T-shape hydroforming
4.1 FEM model
The finite element analysis code ABAQUS 6.8 is employed to study the T-shape hydroforming and to predict bursting failure. In the FE model, only half part of the tube is actually analyzed due to symmetry of the problem, as shown in Fig. 3. The die and punches are assumed to be rigid and modeled as discrete rigid surfaces, while the tube is modeled with 8249 C3D8R (eight-node brick element with reduced integration) elements. Contact between the tube and die is modeled using a penalty-based contact algorithm and the coefficient of friction of 0.07 is applied to the contact surface.
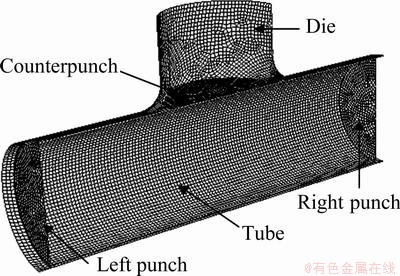
Fig. 3 FEM model of T-shape hydroforming
4.2 Free-bulging of T-shape
In order to determine the critical porosity, fc, and the failure porosity, fF, in GTN model, a free-bulging test of T-shape was firstly conducted. In the test, no axial feeding or counterpunch was used, and bursting occurred when the internal pressure reached 30 MPa. A free-bulging simulation of T-shape was investigated based on the GTN model, in which the initial failure porosity fF and critical porosity fc were both set as a larger value of 0.5. The maximum porosity versus the internal pressure is presented in Fig. 4, which shows that the maximum porosity is always located on the top of protrusion. It can be seen from the figure that the porosities are 0.0132 and 0.0262 corresponding to the pressure of 29.2 MPa and 29.6 MPa, respectively. The value reaches the failure porosity, fF =0.5, when the pressure is 30 MPa. So we can assume that when the porosity reaches 0.026, void coalescence will happen, and this value is selected as the critical porosity fc in the following simulation. The failure porosity fF is set close to fc, and a value of 0.03 is used, to guarantee that as soon as the material exceeds void coalescence, it reaches failure immediately. Figure 5 shows the simulation result compared with the experiment of free-bulging T-shape.
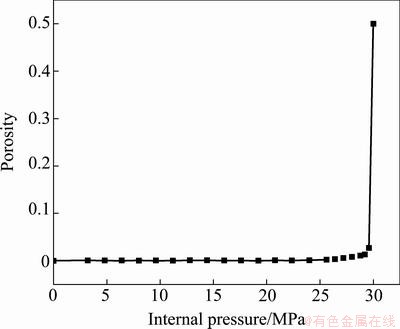
Fig. 4 Maximum porosity versus internal pressure
4.3 Bursting prediction of hydroforming T-shape
In hydroforming T-shape, the tube is pre-pressurized to 30 MPa to avoid buckling before the axial feeding is applied, and then the pressure is linearly increased to the designed value. In this work, three loading paths were designed to investigate the influence of forming pressure and axial feeding on the forming process. In order to study the influence of forming pressure, the final forming pressures of 70 MPa (loading path 1) and 80 MPa (loading path 2) were used, respectively, with the same axial feeding of 40 mm. In addition, with the forming pressure of 70 MPa, the axial feeding of 30 mm (loading path 3) was adopted, and compared with loading path 1 to investigate the influence of axial feeding.
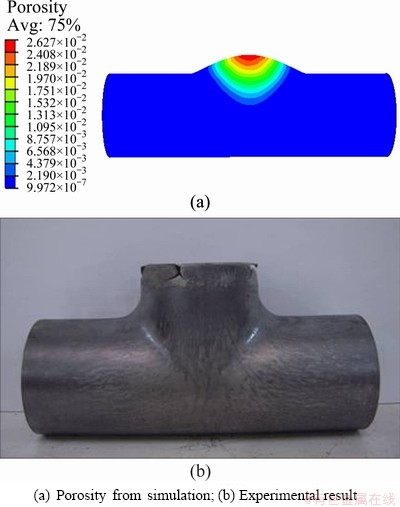
Fig. 5 Free-bulging of T-shape
Figures 6-8 show the porosity distribution and the corresponding experimental results of the T-shape formed under the different loading paths. It can be seen from Fig. 6 that, under loading path 1 (forming pressure of 70 MPa, axial feeding of 40 mm), a sound T-shape can be formed. When the pressure reaches 70 MPa, the maximum porosity of the tube is 0.027, which is less than both the critical porosity fc=0.026 and the failure porosity fF=0.03. However, as shown in Fig. 7, under loading path 2 (forming pressure of 80 MPa, axial feeding of 40 mm), when the pressure reaches 78 MPa and the relative axial feeding of 38.5 mm is applied, the maximum porosity reaches 0.03, which indicates that bursting failure has happened. In the experiment, rupture occurs when the pressure reaches 76 MPa. Figure 8 shows the results under loading path 3 (forming pressure of 70 MPa, axial feeding of 30 mm). When the pressure reaches 58 MPa and the relative axial feeding of 21 mm is applied, the maximum porosity reaches 0.03. In the corresponding experiment, rupture occurs when the pressure reaches 55 MPa and the axial feeding of 19 mm is applied.
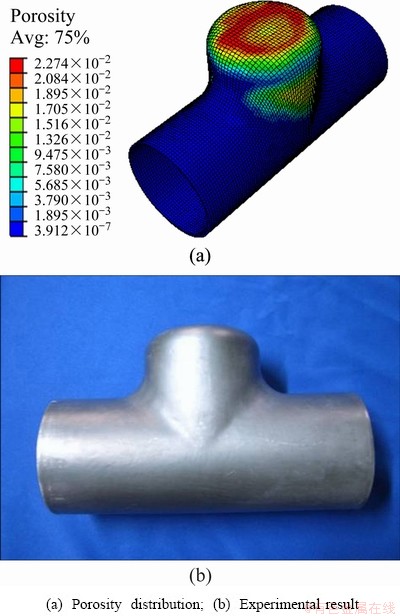
Fig. 6 Porosity distribution and experimental result under loading path 1
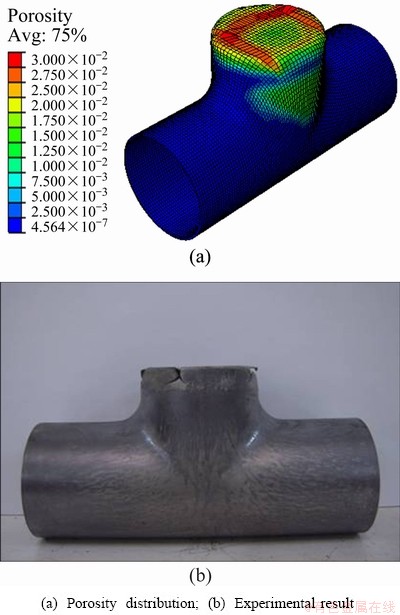
Fig. 7 Porosity distribution and experimental result under loading path 2
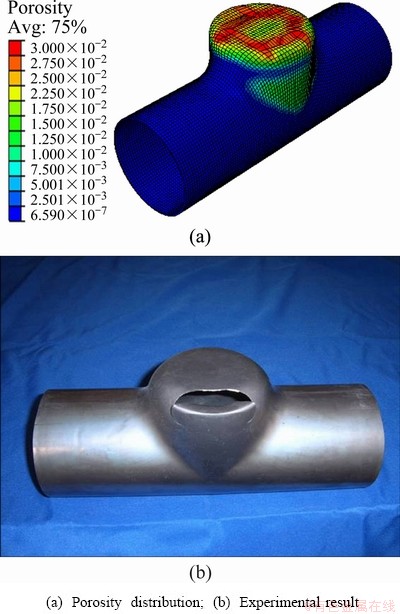
Fig. 8 Porosity distribution and experimental result under loading path 3
The maximum porosity at the final stage is always located on the top of protrusion, no matter if failure takes place or not. Therefore, the porosity history of these elements is extracted and is shown in Fig. 9. The comparison of porosity history under loading paths 1 and 2 is presented in Fig. 9(a). As demonstrated in the figure, a higher forming pressure of 80 MPa accelerates damage development and ductile fracture. Figure 9(b) illustrates the effect of axial feeding on damage evolution. It can be seen that a larger axial feeding of 40 mm can prevent bursting fracture, compared with the axial feeding of 30 mm.
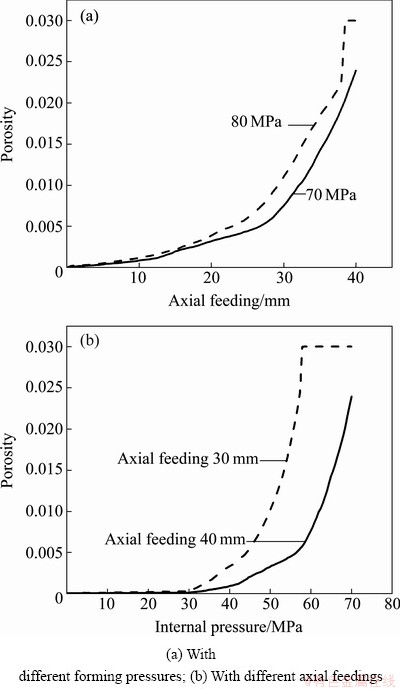
Fig. 9 Porosity history of element on top of protrusion
4.4 Result and discussion of hydroforming sound T-shape
4.4.1 Porosity
Figure 10 shows the porosity of the tube, under loading path 1, when the pressure reaches 61 MPa. In the initial stage, the maximum porosity is not located on the top of protrusion, but in the side wall of main tube. Porosities versus the internal pressure at these two points are presented in Fig. 11. The porosities of these two positions are all very small before the pressure reaches 30 MPa. It can be noticed that the position of the maximum porosity shifts to the top of protrusion from the side wall when the pressure exceeds 66 MPa. In the pressure range of 30 MPa to 56 MPa, the porosity of the side wall increases faster than that of the top of protrusion. The porosity of the top of protrusion then increases faster after the pressure exceeds 56 MPa.
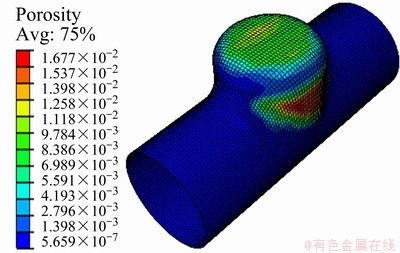
Fig. 10 Porosity distribution in initial stage
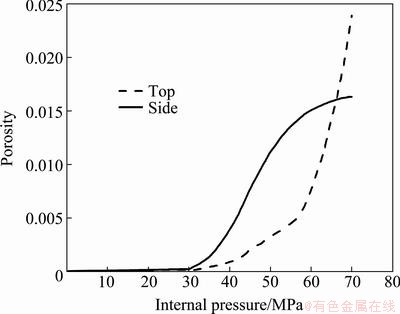
Fig. 11 Porosity of typical positions versus internal pressure
4.4.2 Stress
Figure 12 shows the stress history of these two typical positions during T-shape hydroforming process. At the initial stage, the stresses are all changed linearly before the axial feeding is applied. At the pressure of 30 MPa, axial stress of the top drops down due to axial feeding applied. Then, the stresses of the top increase steadily. It can be seen from Fig. 12(a) that hoop and axial stresses are all in tension state, and the hoop stress is always larger than the axial stress before the pressure reaches 60 MPa. The stress of the top is in equal-biaxial tension state when the pressure exceeds 60 MPa. Figure 12(b) illustrates the stress history of the side. It can be seen that the hoop stress is in tension state, while the axial stress is in compression state. Absolute value of the axial stress is larger than that of the hoop stress.
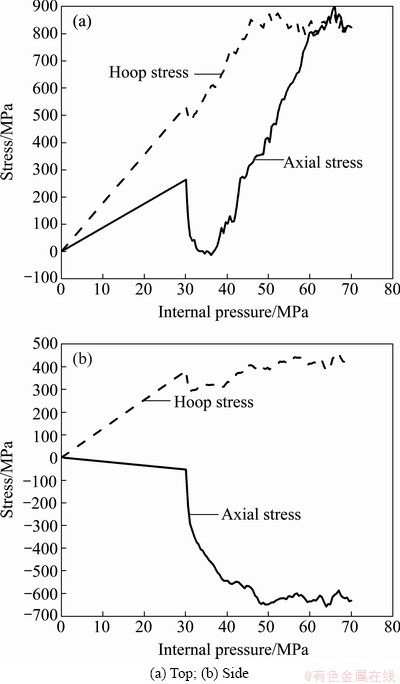
Fig. 12 Stress history of typical positions versus internal pressure
4.4.3 Stress triaxiality and plastic strain
Failure of ductile materials is often related to coalescence of microvoids. The stress triaxiality (ratio of the hydrostatic stress to von Mises equivalent stress) and the plastic strain are the two primary factors that influence the void growth, nucleation and coalescence. Figures 13 and 14 show the stress triaxiality and the equivalent plastic stain of these two points varying with the internal pressure. It can be noticed that before the pressure reaches 30 MPa, the stress triaxiality increases rapidly with pressure increasing, while the equivalent plastic stain increases slowly. At the pressure of 30 MPa, the stress triaxiality drops down due to axial feeding applied. Then, the stress triaxiality of the top increases steadily, while the side wall shows a relatively flat trend with pressure increasing. Figure 14 shows that the equivalent plastic stain of the side wall is always larger than that of the top after the pressure exceeds 30 MPa. The analysis of the porosity, the stress triaxiality and the equivalent plastic strain shows that the plastic strain has a more significant influence on the porosity than the stress triaxiality under the lower internal pressure. However, the stress triaxiality will govern the variation of porosity under the higher internal pressure. At the end of forming, the stress triaxiality of the top is about 0.67, which corresponds to the equal-biaxial tension value of 2/3.
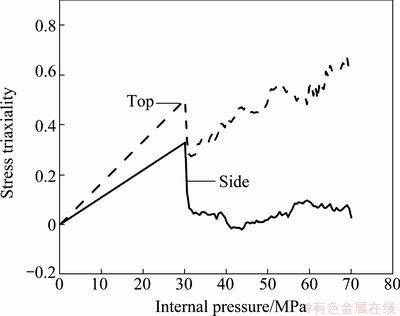
Fig. 13 Stress triaxiality of typical positions versus internal pressure
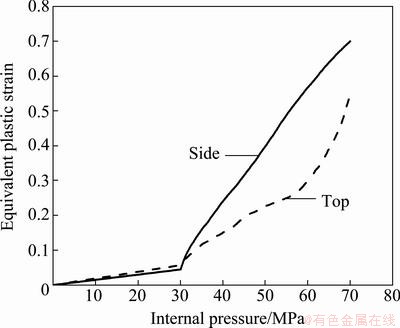
Fig. 14 Equivalent plastic strain of typical positions versus internal pressure
4.4.4 Thickness
Figure 15 presents the wall thickness distribution of the experimental product. The minimum thickness is 0.96 mm (the thinning rate of 36%), which locates at the top corner of the protrusion. The maximum thickness is 1.98 mm (the thickening rate of 32%), which locates at the feeding region near the end of tube. Figure 16 shows the plastic strain in the normal direction, obtained from the simulation. The minimum and maximum plastic strains are -0.463 and 0.345, respectively, and the corresponding thicknesses of 0.952 mm and 2.12 mm agree well with the experimental results.
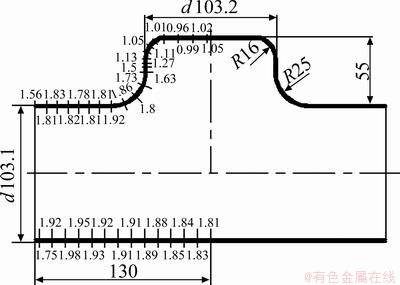
Fig. 15 Thickness distribution of experimental T-shape (unit: mm)
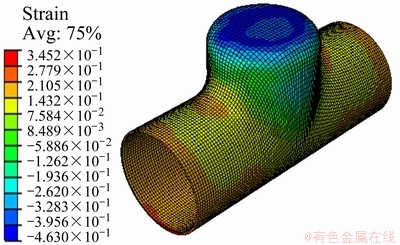
Fig. 16 Plastic strain distribution in normal direction
5 Conclusions
1) A higher forming pressure of 80 MPa or a less axial feeding of 30 mm will accelerate damage development, which will lead to bursting failure. A sound T-shape can be formed under the loading path with the forming pressure of 70 MPa and the axial feeding of 40 mm.
2) The stresses of the top of protrusion are in bi-axial tension state, and the hoop stress is always larger than the axial one. The hoop stress of the side wall of main tube is in tension state, while the axial stress is in compression state and absolute value of the axial stress is larger than that of the hoop stress.
3) Compared with the plastic strain, the stress triaxiality has a more significant influence on the growth of porosity under the higher internal pressure. At the end of forming, the stress triaxiality of the top is about 0.67, which corresponds to the equal-biaxial tension state.
4) The minimum and maximum thicknesses of the sound T-shape are 0.952 mm and 2.12 mm, respectively. The maximum thickness-thinning rate is about 36%, which is in a good agreement with the experiment results.
References
[1] YUAN Shi-jian, HE Zhu-bin, LIU Gang, WANG Xiao-song, HAN Cong. New developments in theory and processes of internal high pressure forming [J]. The Chinese Journal of Nonferrous Metals, 2011, 21(10): 2523-2533. (in Chinese)
[2] ALASWAD A, BENYOUNIS K Y, OLABI A G. Tube hydroforming process: A reference guide [J]. Materials and Design, 2012, 33: 328-339.
[3] PENG Jun-yang, ZHANG Wen-da, LIU Gang, ZHU Shi-qiang. Effect of internal pressure distribution on thickness uniformity of hydroforming Y-shaped tube [J]. Transactions of Nonferrous Metals Society of China, 2011, 21: s423-s428.
[4] BAI Y L, WIERZBICKI T. Forming severity concept for predicting sheet necking under complex loading histories [J]. Int J Mech Sci, 2008, 50: 1012-1022.
[5] STOUGHTON B T, ZHU X H. Review of theoretical models of the strain-based FLD and their relevance to the stress-based FLD [J]. Int J Plasticity, 2004, 20:1463-1486.
[6] HASHEMI R, ASSEMPOUR A, ABAD E M K. Implementation of the forming limit stress diagram to obtain suitable load path in tube hydroforming considering M-K model [J]. Materials and Design, 2009, 30: 3545-3553.
[7] KIM S W, SONG W J, KANG B S, KIM J. Bursting failure prediction in tube hydroforming using FLSD [J]. Int J Adv Manuf Technol, 2009, 41: 311-322.
[8] SIMHA C H M, GRANTAB R, WORSWICK M J. Computational analysis of stress-based forming limit curves [J]. Int J Solids Struct, 2007, 44: 8663-8684.
[9] SORINE M, SIMHA C H M, RIEMSDIJK I, WORSWICK M J. Prediction of necking of high strength steel tubes during hydroforming-multi-axial loading [J]. Int J Mech Sci, 2008, 50: 1411-1422.
[10] McCLINTOCK F A. A criterion for ductile fracture by the growth of holes [J]. J App Mech, 1968, 35: 363-371.
[11] RICE J R, TRACEY D M. On the enlargement of voids in triaxial stress fields [J]. J Mech Phys Solids, 1969, 17: 201-271.
[12] GURSON A L. Continuum theory of ductile rupture by void nucleation and growth: Part I-Yield criteria and flow rules for porous ductile media [J]. J Eng Mater Technol, 1977, 99: 2-15.
[13] TVERGAARD V. Influence of voids on shear band instabilities under plane strain conditions [J]. Int J Fract, 1981, 17: 389-407.
[14] TVERGAARD V, NEEDLEMAN A. Analysis of the cup-cone fracture in a round tensile test bar [J]. Acta Metall, 1984, 32: 157-169
[15] ABBASI M, BAGHERI B, KETABCHI M, HAGHSHENAS D F. Application of response surface methodology to drive GTN model parameters and determine the FLD of tailor welded blank [J]. Comput Mater Sci, 2012, 53: 368-376.
[16] VARMA N S P, NARASIMHAN R, LUO A A, SACHDEV A K. An analysis of localized necking in aluminium alloy tubes during hydroforming using a continuum damage model [J]. Int J Mech Sci, 2007, 49: 200-209.
[17] CHEN Z T, WORSWICK M J, PILKEY A K, LLOYD D J. Damage percolation during stretch flange forming of aluminum alloy sheet [J]. J Mech Phys Solids, 2005, 53: 2692-2717.
[18] BUTCHER C, CHEN Z T, WORSWICK M J. A lower bound damage-based finite element simulation of stretch flange forming of Al�CMg alloys [J]. Int J Fract , 2006, 142: 289-298.
[19] BUTCHER C, CHEN Z T, BARDELCIK A, WORSWICK M J. Damage-based finite-element modeling of tube hydroforming [J]. Int J Fract, 2009, 155: 55-65.
[20] MIGLANI S. Use of micromechanical modelling to assess the fracture characteristics of SS 304 reactor grade steel [D]. Patiala, India: Thapar University, 2008:82-92.
T����ͨ��Һѹ���ε���������
������1,2��Է����1,2��������3����ѧ��4
1. ��������ҵ��ѧ ���������ȼӹ����Ҽ��ص�ʵ���ң������� 150001��
2. ��������ҵ��ѧ ���Ͽ�ѧ�빤��ѧԺ�������� 150001��
3. �²�����˴�ѧ ��е����ϵ����������˶٣�NB E3B 5A3�����ô�
4. һ���γ��ɷ�����˾������ 130011
ժ Ҫ������GTN����ģ�ͣ������˲����T����ͨ�ܵ�������Ϊ��������ֵģ��ܼ�Һѹ��������ȷ����GTNģ�����ٽ����������ͼ�����������������˳���ѹ�������������������ݱ��Ӱ�죬������Ӧ������ȼ�����Ӧ��Կ����������Ӱ����ɡ��������������ѹ���ϸ�����������Сʱ���ܼ����ι����н���������ȱ�ݡ�֧�ܶ�������˫����Ӧ��״̬�����ܲ�ڴ��ڻ������졢����ѹ����Ӧ��״̬���ڳ��γ�ʼ�Σ���ѹ�ϵ�ʱ������Ӧ�����������仯��Ӱ��ϴ�Ȼ�����ڳ��κ��ڣ���ѹ�ϸ�ʱ��Ӧ������ȶԿ���������������нϴ�Ӱ�졣��ֵģ�⼰��������������ͬ�ıں�ֲ����ɣ���������ͨ�ܵ����ں������Ϊ36%���ҡ�
�ؼ��ʣ�T����ͨ��Һѹ���Σ�GTNģ�ͣ����ˣ����ѣ��������������ѹ
(Edited by YANG Hua)
Foundation item: Project (2011BAG03B03) supported by the National Key Technologies R&D Program of China: Development of Advanced Forming Technologies of High Strength Steel and Integration Applications in Target Car
Corresponding author: TENG Bu-gang; Tel/Fax: +86-451-86417917; E-mail: bgteng@hit.edu.cn
DOI: 10.1016/S1003-6326(12)61722-1
Abstract: The Gurson-Tvergaard-Needleman model (GTN model) was employed to analyze bursting behavior in the hydroforming of stainless steel T-shape. A free-bulging test combined with simulation was conducted to determine the critical porosity and the failure porosity in GTN model. The effects of the forming pressure and the axial feeding on damage development were investigated and the influences of stress triaxiality and the plastic strain on porosity variation were also studied. The results show that a higher forming pressure or a less axial feeding will lead to bursting failure. The stresses of the top of protrusion are in bi-axial tension state, while the stresses of the side wall of main tube are in hoop tension state and axial compression state, respectively. The plastic strain has a more significant influence on the porosity than the stress triaxiality under the lower internal pressure; however, the stress triaxiality will govern the growth of porosity under the higher internal pressure. The simulation results give a good agreement with the experimentally determined thickness, and the maximum thickness-thinning rate is about 36%.
