

J. Cent. South Univ. (2019) 26: 612-622
DOI: https://doi.org/10.1007/s11771-019-4032-8

An adaptive electrical resistance tomography sensor with flow pattern recognition capability
WANG Pai(����)1, LI Yang-bo(������)1, WANG Mei(��÷)1, QIN Xue-bin(��ѧ��)1, LIU Lang(����)2, 3
1. School of Electrical and Control Engineering, Xi'an University of Science and Technology,Xi��an 710054, China;
2. School of Energy, Xi��an University of Science and Technology, Xi��an 710054, China;
3. Key Laboratory of Western Mines and Hazards Prevention, Ministry of Education of China,Xi��an 710054, China
 Central South University Press and Springer-Verlag GmbH Germany, part of Springer Nature 2019
Abstract:
The all traditional electrical resistance tomography (ERT) sensors have a static structure, which cannot satisfy the intelligent requirements for adaptive optimization to ERT sensors that is subject to flow pattern changes during the real-time detection of two-phase flow. In view of this problem, an adaptive ERT sensor with a dynamic structure is proposed. The electrodes of the ERT sensor are arranged in an array structure, the flow pattern recognition technique is introduced into the ERT sensor design and accordingly an ERT flow pattern recognition method based on signal sparsity is proposed. This method uses the sparse representation of the signal to express the sampling voltage of the ERT system as a sparse combination and find its sparse solution to achieve the classification of different flow patterns. With the introduction of flow identification information, the sensor has an intelligent function of adaptively and dynamically adapting the sensor structure according to the real-time flow pattern change. The experimental results show that the sensor can automatically identify four typical flow patterns: core flow, bubble flow, laminar flow and circulation flow with recognition rates of 91%, 93%, 90% and 88% respectively. For different flow patterns, the dynamically optimized sensor can significantly improve the quality of ERT image reconstruction.
Key words:
Cite this article as:
WANG Pai, LI Yang-bo, WANG Mei, QIN Xue-bin, LIU Lang. An adaptive ERT sensor with flow pattern recognition capability [J]. Journal of Central South University, 2019, 26(3): 612�C622.
DOI:https://dx.doi.org/https://doi.org/10.1007/s11771-019-4032-81 Introduction
Two-phase flow is widespread existing in the nature and industrial production process, especially in the chemical industry, oil, mining, metallurgy, transportation and other industry areas [1]. Scientific significance and engineering application value will be realized to make effective and real-time measurement for various kinds of parameters reflecting the flow characteristics of the two-phase flow. Electrical resistance tomography (ERT) which belongs to one of the electrical process tomography technologies [2, 3] is suitable for the visual measurement taking liquid phase as the continuous phase in the two-phase flow or multi-phase flow and thus has a wide industrial prospect [4, 5].
The typical ERT system shown in Figure 1 mainly consists of three units: a resistance sensor (electrode array) unit, a measurement and data acquisition unit and the image reconstruction unit (master computer). The sensor unit senses the information of conductivity distribution in various media of the sensing field, and the measurement and data acquisition unit measures and collects the information obtained by the sensor and sends it to the computer. After that, the computer reconstructs the medium distribution image according to the image reconstruction algorithm.
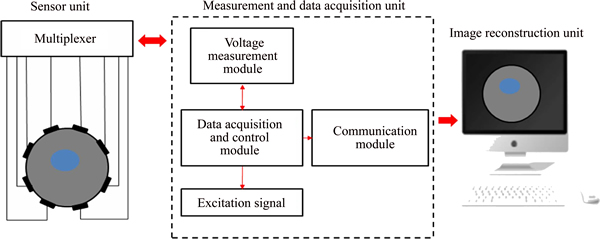
Figure 1 Composition of ERT system
Many scholars have initiated researches on ERT sensor design and achieved fabulous [6-10], such as ERT sensor with guard electrode [8], ERT sensor with conductive ring [9], and multi-turn sensor for three-dimensional imaging [10]. In recent years, the multi-mode ERT sensor emerged [11�C13].
These research results improve the performance of the ERT sensor, but most of these sensors have static structures [8-10]. The common drawback is that they cannot adaptively adjust the structure of the ERT sensor according to the flow rate and flow pattern of the two-phase flow. It is unable to meet the dynamic optimization requirements for ERT sensors during the real-time detection of the two-phase flow process [14, 15].
In view of this problem, an adaptive ERT sensor with a dynamic structure is developed. With the array structure of electrodes, the ERT sensor can adaptively adjust the sensor structure to optimize the performance of the sensor according to the time-varying flow pattern information. In order to make the ERT sensor get the function of automatic identification of the flow pattern, an ERT flow pattern identification method based on signal sparsity is presented. In this method, the sparse representation of the signal is used to present the sampling voltage of ERT system as a sparse combination and establish a mathematical model under the minimum L1 norm according to the sparsity of the signal to obtain the optimal solution for classifying different flow patterns. Compared with the traditional image-based ERT flow pattern identification method, this method saves time-consuming image reconstruction and improves the speed of flow identification. The experimental results show that the sensor could automatically identify four typical flow patterns, such as core flow, bubble flow, laminar flow and circulation flow with recognition rates of 91%, 93%, 90% and 88%, respectively. For different flow patterns, the dynamically optimized sensor can significantly improve the quality of ERT image reconstruction.
2 Theoretical foundation
2.1 Mathematical model of ERT
The mathematical model of ERT can be divided into forward and inverse problems. The forward problem of ERT involves solving the electrical potential distribution in the sensing field through the boundary conditions, with a given electrical conductivity distribution. According to the electromagnetic field theory and Maxwell equation, the following equations are satisfied at any point within the ERT sensing field.
 (1)
(1)
where I is the exciting current; �� is the conductivity; �� is the potential distribution in the sensing field; S1 and S2 are surface of the exciting electrode and the measuring electrode; S3 is the insulation surface of the sensor; n is the outer normal vector on any one point of the boundary.
The inverse problem of ERT involves reconstructing the conductivity distribution of the sensing field by the image reconstruction algorithm, with a given voltage distribution measured at the boundary. According to the principle of Radon transform, the ERT inverse problem meets:
 (2)
(2)
where  is the reconstructed conductivity; S(x, y) is the normalized sensitivity matrix; which is related to the actual electrical conductivity distribution in the sensing field; U is the normalized voltage measured at the boundary. After discretization and ignoring the "soft field" characteristics, Eq. (2) can be simplified as following:
 (3)
(3)
where S characterizes the mapping between U and (the reconstructed image). Therefore, any image reconstruction algorithm based on Eq. (3) cannot avoid the measurement error induced by the "soft field" effect.
2.2 Soft field characteristics of ERT
The so-called ��soft field�� refers to the uniform distribution of the ERT sensing field, which can be influenced by the distribution of the measured medium (location and area occupied by the field) and the difference between the two-phase medium conductivity. The voltage of the electrode pair measured at the boundary of the sensing field may change when the conductivity changes in the sensing field. In order to evaluate the sensitivity level, the concept of sensitivity was introduced [16]. The practical significance of the sensitivity is that the voltage measured at boundary changes when the conductivity of one unit changes in the sensing field. The sensitivity can be calculated according to the Gese-lowitz compensation principle [17].
2.3 Influence of flow pattern on characteristics of ERT soft field
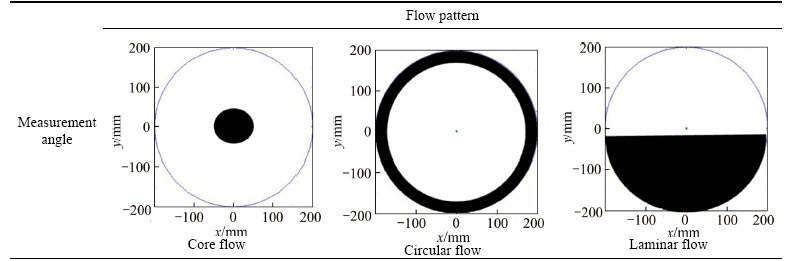
The influence of flow pattern on ERT soft field characteristics is analyzed by a finite element method. The simulation conditions are as follows: 16-electrode system under the adjacent excitation mode [10], the radius of the sensitivity is 200 mm, the conductivity of the continuous phase medium and the discrete phase medium is respectively ��1=0.1 mS/mm and ��2=0.001 mS/mm, the excitation current I=1 mA. Due to the circular sensing field, the distribution of sensitivity under the adjacent excitation mode is symmetrical. So only the sensitivity distribution of the three typical measurement angles is investigated when one pair of electrodes is excited. The sensitivity distribution of three flow patterns from three different measurement angles, such as core flow, circulation flow and laminar flow, is shown in Table1.
As shown in Table 1, the flow pattern has a big effect on the distribution of sensing fields. 1) The smaller the diameter of the core flow is, the closer the flow pattern is to the central region of the sensing field and the lower the detection sensitivity of the flow pattern; 2) The larger the diameter of the circulation flow, the closer the flow pattern is to the edge of the sensitive field and the higher the detection sensitivity of the flow pattern; 3) The closer the laminar flow distribution is to the edge of the sensitive field, the higher the detection sensitivity of the flow pattern is. From the above analysis, it can be seen that the detection sensitivity of the ERT sensor with the same structure to different flow patterns is different. So ERT sensor with traditional static structure cannot adapt to the real-time changes in two-phase flow pattern.
3 Design of adaptive ERT sensor
3.1 Structural design of adaptive ERT sensor
The structure of the adaptive ERT sensor proposed in this work is shown in Figure 2. The initial structure of the adaptive ERT sensor is shown in Figure 2(a) and its electrode is arranged in array, which consists of N-layer electrodes differently located on the tube wall and each layer contains N electrodes of the same size. The sensor can determine whether the electrodes are connected by different flow pattern information, so as to dynamically adjust the structure parameters of electrodes, such as the size, shape, position and numbers of the electrode and achieve the purpose of adapting the sensor structure for different flow patterns. The blue electrode is the one that is selected for measurement, and the gray electrode is the one that is not involved in the measurement. Each measuring electrode is composed of two electrodes connected with each other. In Figure 2(b), it shows a structure of an adaptive ERT sensor optimized on basis on a flow pattern. The blue electrode is the one that is optimized for measurement, and the gray electrode is the one that is not involved in the measurement after optimization. The blue electrode constitutes an ERT sensor with guard electrode [8]. Its measurement electrode is located in the middle layer of the sensor, and each measurement electrode is composed of four electrodes connected with each other. Its guard electrode is located on the upper and lower sides of the measurement electrode and each guard electrode is composed of six electrodes connected with each other.
Table 1 Sensitivity distribution of three flow patterns from three different measurement angles
The structure control system of the ERT sensor based on flow pattern recognition is shown in Figure 3. The measurement voltage obtained by the ERT sensor is used to identify the flow pattern, the result of the flow pattern recognition is fed back to the controller. The controller dynamically optimizes the ERT sensor structure according to the result of the flow pattern recognition and obtains a new measured voltage value for image reconstruction so as to obtain more accurate image reconstruction results.
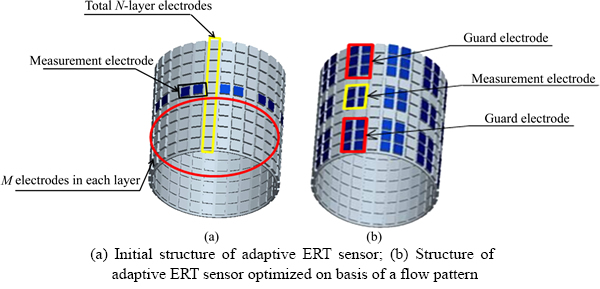
Figure 2 Structure model of an adaptive ERT sensor:
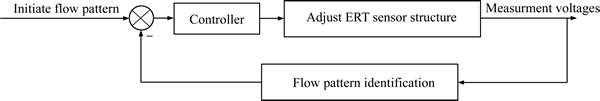
Figure 3 Structure control system of ERT sensor based on flow pattern recognition
3.2 ERT flow pattern recognition method based on signal sparseness
The sparse representation of a signal can be expressed as follows [18, 19]. Suppose that there is one M-dimension signal x in a finite real number space and ��i (i=1, 2, ��, N) is a set of basis vectors in the space, so x can be expressed as
 (4)
(4)
where ��={��1, ��2, ��, ��N} is a matrix of M��N and satisfies M<
The 16-electrode ERT system is used to measure the voltages (104-dimensional vector/ frame) of four typical flow patterns, such as core flow, bubble flow, laminar flow and circulation flow, and normalized them to form a dictionary ��. Each type of typical flow pattern contains 150 frames normalized measurement voltage vectors, then a subset of the ith class of flow pattern:
 (5)
(5)
where  (j=1, 2, ��, 150) represents the jth normalized measurement voltage vector in the ith flow pattern, so the dictionary �� is a 104��600 matrix:
 (6)
(6)
From Eq. (6) it can be seen that the test voltage vector U can be expressed linearly by the column vector of the dictionary ��:
 (7)
(7)
Since the number of nonzero components in the coefficient vector �� is much smaller than the number of columns in the voltage dictionary, Eq. (7) is an undetermined set of equations. The solution to Eq. (7) is to convert it into a minimization problem under L1 norm:
 (8)
(8)
After �� in Eq. (8) has been solved, what flow pattern of the voltage signal can be determined by the position of the nonzero value in the sparse vector ��. The specific algorithm flow is shown in Figure 4.
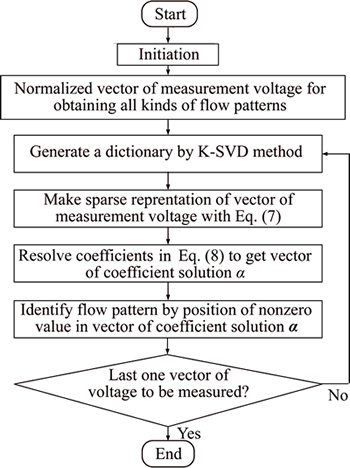
Figure 4 Algorithm flowchart
4 Experiment and results analysis
4.1 Recognition rate of flow patterns
Total 4 kinds of typical flow patterns of the two-phase flow have been established: core flow, bubble flow, laminar flow, and circulation flow. Total 165 vectors of measurement voltages corresponding to each kind of flow pattern have been determined, where 150 vectors are used to generate dictionaries, and 15 vectors are used to test the recognition rate of each flow pattern. The experimental results are shown in Table 2.
Table 2 Recognition rate of flow patterns
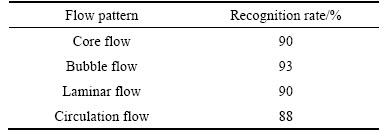
It can be seen from Table 2 that the recognition rate of the bubble flow among the four flow patterns is 93%, the recognition rate of the circulation flow is 88%, and the average recognition rate of the four flow patterns is 90.5%.
4.2 Adaptive optimization results and analysis
4.2.1 Optimization parameters and optimization objective function
There are many optimization parameters of the ERT sensor, such as electrode shape, electrode height, electrode width, the number of electrodes and excitation mode [6]. In this work, the electrode width, the number of electrodes and the excitation mode is selected as the optimization parameters while the image reconstruction quality is selected as the optimization target. The width of the electrode is represented by the center of a circle corresponding to the electrode, and the image reconstruction quality is expressed by cross-sectional image error (CSIE) [20], which is defined as follows:
 (9)
(9)
where  is the conductivity distribution derived from the reconstruction algorithm; �� is the conductivity distribution value set in the area to be measured. The smaller the image error is, the better the image quality is.
4.2.2 Optimization method
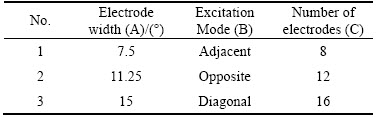
In this work, the experiment is arranged with the orthogonal design and the factor-level is shown in Table 3. Total 9 experiments have been accomplished for each of the three flow patterns, such as the core flow, circulation and laminar flow.
Table 3 Factor-level table
4.2.3 Analysis of objective indicators
The orthogonal experiment scheme L9 (33) and optimization results of three flow patterns are shown in Table 4, where CSIEi (i=1, 2, 3), respectively represents the cross-section image errors corresponding to the three flow patterns, such as the core flow, circulation flow and laminar flow. K11, K12 and K13, respectively represent the average value of the 3 experiment results CSIE1 at each level for each factor when the flow pattern is the core flow; K21, K22, K23 respectively represent the average value of the 3 experiment results CSIE2 at each level for each factor when the flow pattern is the circulation flow; K31, K32, K33 respectively represent the average of the three experimental results CSIE3 for each level of each factor when the flow pattern is laminar flow. R1 represents the range when the flow pattern is the core flow; R2 represents the range when the flow pattern is the circulation flow; R3 represents the range when the flow pattern is the laminar flow. The greater the range is, the greater the effect of this factor on the optimization result is.
Table 4 Orthogonal experimental design and experimental results
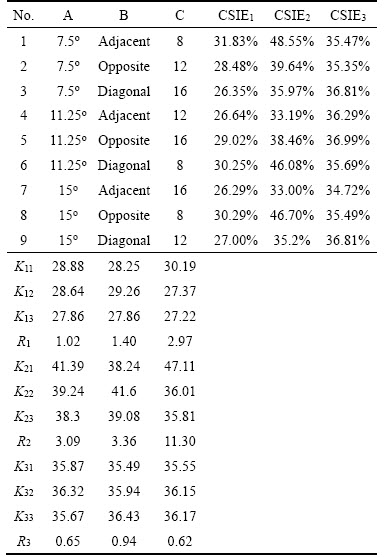
It can be seen from Table 4 that the optimal combination of ERT sensor optimization is A3B3C3 when the flow pattern is core flow. When the flow pattern is circulation flow, the optimal combination of ERT sensor is A3B1C3. When the flow pattern is laminar flow, the optimal combination of ERT sensor is A3B1C1. The above experimental results show that the optimization results of the ERT sensors are different when the flow patterns are different.
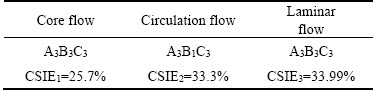
The CSIEi (i=1, 2, 3) corresponding to the three optimization combinations of ERT sensor are shown in Table 5. CSIE1=25.7% compared to experiment 1 in Table 5 indicates that the cross-sectional image error can be reduced by 12.4% when the ERT sensor is optimized, CSIE2=33.3% compared to experiment 1 in Table 5 indicates that the ERT sensor can reduce the cross-sectional image reconstruction error by 15.55% when the ERT sensor is optimized; CSIE3=33.99% compared to experiment 5 in Table 4 indicates that for the circulation, ERT sensor optimization can reduce the cross-sectional image reconstruction error by 3%.
Table 5 Optimization results for three different flow patterns of ERT sensor
4.2.4 Analysis of image reconstruction effect
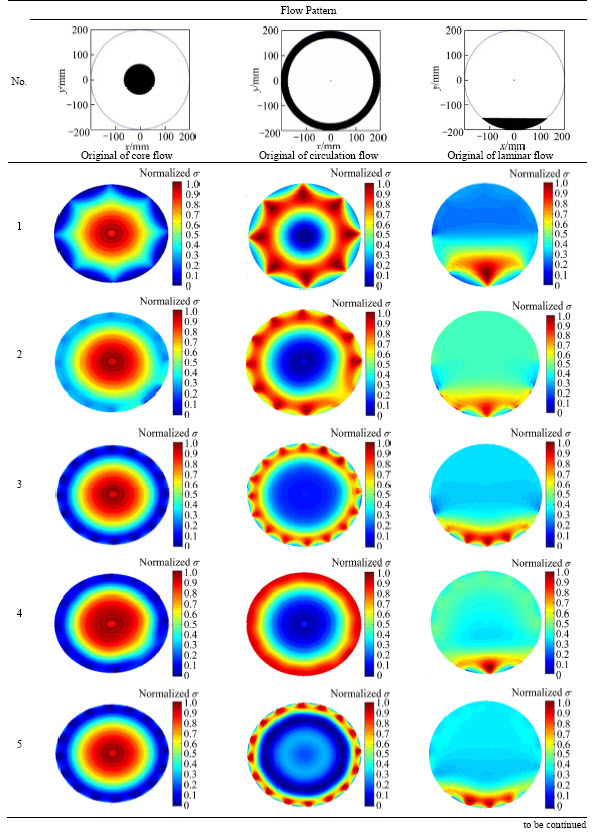
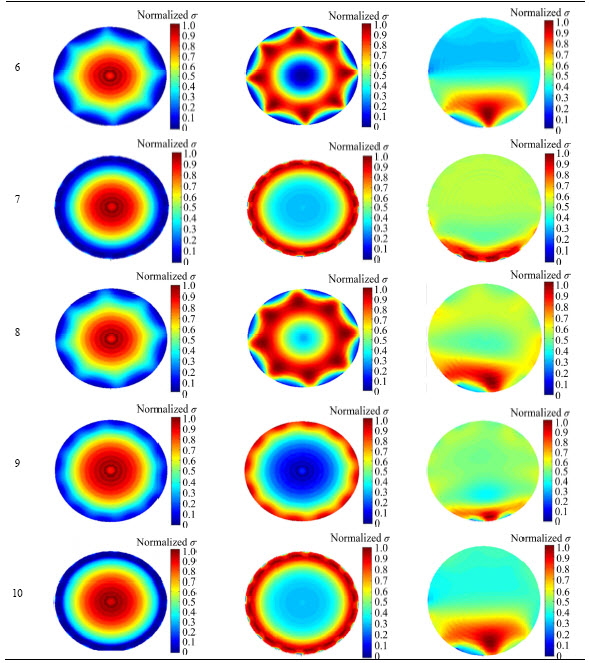
ERT image reconstruction algorithm can be divided into iterative algorithm and non-iterative algorithm [21]. The iterative algorithm can achieve higher image quality, but cannot meet the real-time requirements in practical applications because iterative algorithm is time-consuming. Therefore, the non-iterative algorithm is used by the authors as the sensitivity theorem algorithm [22] to accomplish image reconstruction of the optimization experiment in this work. The image reconstruction effect is shown in Table 6. The experiments 1 to 9 in Table 6 correspond to experiments 1 to 9 in Table 4 one by one. The experiment 10 in Table 6 indicates the optimization results of the three different flow patterns.
From the effect of image reconstruction, the flow pattern has a great influence on cross-sectional image errors. A set of sensor structural parameters can reconstruct a better image for a certain flow pattern while poor image reconstruction for other flow patterns. For example, the sensor structure corresponding to experiment 2 can achieve better image reconstruction for the laminar flow; but poor image reconstruction quality for the core flow and circulation flow. Similarly, the sensor structure corresponding to experiment 4 can achieve better image reconstruction quality for the circulation flow, but poor image reconstruction quality for the core flow and the laminar flow. The above experimental results are consistent with the cross-sectional image errors in Table 4. This indicates that ERT sensor needs to adaptively optimize the structural parameters according to the change of flow pattern in order to get the best image reconstruction quality. The optimal imaging effects corresponding to the three flow patterns are shown in experiment 10. Obviously, ERT sensors optimized for different flow patterns can achieve higher image reconstruction quality.
Table 6 Image reconstruction results for three flow patterns
Continued
5 Conclusions
Due to the inherent soft field effect of the ERT sensor, the flow pattern has a great influence on the image reconstruction quality. In order to dynamically optimize ERT sensors according to the changes of flow patterns during the real-time detection of the two-phase flow so as to get better image reconstruction quality, an adaptive ERT sensor is proposed. The ERT sensor has the ability of pattern recognition, which can adjust the sensor structure adaptively according to the change of flow pattern and optimize the performance of the sensor. The experimental results show that the recognition rates of the core flow, bubble flow, laminar flow and circulation flow are 91%, 93%, 90% and 88% respectively. The sensor dynamically optimized for the three flow patterns, such as core flow, circulation flow and laminar flow, can significantly improve the ERT image reconstruction quality.
In the future work, improving the flow pattern recognition algorithm to further enhance the recognition rate of flow pattern is a worthy problem. In addition, incorporating the flow pattern recognition results as a priori knowledge into the image reconstruction algorithm will greatly improve the quality of image reconstruction, and also can be the focus of the author��s future work.
References
[1] ZHAI Qiang, YAN Ke, ZHANG You-yun, ZHU Yong-sheng, WANG Ya-tai. Air flow patterns and noise analysis inside high speed angular contact ball bearings [J]. Journal of Central South University, 2015, 22(9): 3358�C3366. DOI: 10.1007/s11771-015-2876-0.
[2] WANG Mi, DICKIN F J, MANN R. Electrical resistance tomographic sensing systems for industrial applications [J]. Chemical Engineering Communications, 1999, 175(1): 49�C70. DOI: 10.1080/00986449908912139.
[3] TAN Chao, WANG Na-na, DONG Feng. Oil�Cwater two-phase pattern analysis with ERT based measurement and multivariate maximum Lyapunov exponent [J]. Journal of Central South University, 2016, 23(1): 240�C248. DOI: 10.1007/s11771-016-3067-3.
[4] SARDESHPANDE M V, KUMAR G, ADITYA T, RANADE V V. Mixing studies in unbaffled stirred tank reactor using electrical resistance tomography [J]. Flow Measurement & Instrumentation, 2016, 47: 110�C121. DOI: 10.1016/ j.flowmeasinst.2016.01.003.
[5] POLANSKY J, WANG Mi. Proper orthogonal decomposition as a technique for identifying two-phase flow pattern based on electrical impedance tomography [J]. Flow Measurement & Instrumentation, 2016, 53: 126�C132. DOI: 10.1016/j.flowmeasinst.2016.10.004.
[6] WANG Pai, GUO Bao-long, LI Nan. Multi-index optimization design for electrical resistance tomography sensor [J]. Measurement, 2013, 46(8): 2845�C2853. DOI: 10.1016/j.measurement.2013.03.021.
[7] FRANSOLET E, CRINE M, L'HOMME G, TOYE D, MARCHOT P. Electrical resistance tomography sensor simulations: Comparison with experiments [J]. Measurement Science & Technology, 2002, 13(8): 1239�C1247. http:// iopscience.iop.org/article/10.1088/0957-0233/13/8/311/meta.
[8] MA Yi-xin, WANG Hao, XU Ling-an, JIANG Chang-zhen. Simulation study of the electrode array used in an ERT system [J]. Chemical Engineering Science, 1997, 52(13): 2197�C2203. DOI: 10.1016/S0009-2509(97)00045-6.
[9] GU Jun, YIN Wu-liang, WANG Chao, WANG Hua-xiang. Modeling of the conductive ring electrical impedance tomography sensor [C]// International Conference on Electronic Measurement & Instruments. IEEE, 2009: 496�C499. DOI: https: 10.1109/ICEMI.2009.5274820.
[10] DICKIN F, WANG Mi. Electrical resistance tomography for process applications [J]. Measurement Science & Technology, 1999, 7(3): 247�C260. http://iopscience.iop.org/article/10. 1088/ 0957-0233/7/3/005/meta.
[11] WANG Hua-xiang, WANG Jing, HU Li, JIANG Wei-wei, HAO Kui-hong, SONG Zhi-jian. Optimal design of ERT/ECT dual-modality sensing electode array [J]. Journal of Tianjin University: Science and Technology, 2008, 41(8): 911�C918. http://kns.cnki.net/ KCMS/detail/detail.aspx? dbcode=CJFD&filename=TJDX200808006. (in Chinese).
[12] MERIBOUT M, AL-RAWAHI N Z, AL-NAAMANY A M, AI-BEMANI A, AI-BUSAIDI K, MERIBOUT A. A multisensor intelligent device for real-time multiphase flow metering in oil fields [J]. IEEE Transactions on Instrumentation & Measurement, 2010, 59(6): 1507�C1519. DOI: 10.1109/TIM.2009.2028210.
[13] TENIOU S, MERIBOUT M. A multimodal image reconstruction method using ultrasonic waves and electrical resistance tomography [J]. IEEE Transactions on Image Processing�CA Publication of the IEEE Signal Processing Society, 2015, 24(11): 3512�C3521. DOI: 10.1109/TIP.2015. 2445575.
[14] KARKI B, FARAJ Y, WANG Mi. Electrical conductivity based flow regime recognition of two-phase flows in horizontal pipeline [C]// World Congress on Industrial Process Tomography. Iguassu Falls, Brazil. 2016: 1�C8. http://www.isipt.org/world- congress/8/29003.html.
[15] MENG Zhen-zhen, HUANG Zhi-yao, WANG Bao-liang, JI Hai-feng, LI Hai-qing, YAN Yong. Air�Cwater two-phase flow measurement using a Venturi meter and an electrical resistance tomography sensor [J]. Flow Measurement and Instrumentation, 2010, 21(3): 268�C276. DOI: 10.1016/j.flowmeasinst.2010.02.006.
[16] WANG Pai. Analysis of sensitivity field of electrical resistance tomography system [C]// International Symposium on Computer, Consumer and Control. IEEE, 2016: 1106�C1110. DOI: 10.1109/IS3C.2016.278.
[17] MURAI T, KAGAWA Y. Electrical impedance computed tomography based on a finite element model [J]. IEEE Transactions on Biomedical Engineering, 1985, 32(3): 177�C184. DOI: 10.1109/TBME.1985.325526.
[18] MAIRAL J, ELAD M, SAPIRO G. Sparse representation for color image restoration [J]. IEEE Transactions on Image Processing, 2008, 17(1): 53�C69. DOI: 10.1109/TIP.2007. 911828.
[19] OLIVEROS E R, COELLO G, MARRERO-FERN NDEZ P, BUADES J M, JAUME-I-CAP
 A. Evaluation of K-SVD method in facial expression recognition based on sparse representation problems [M]// Articulated Motion and Deformable Objects. Springer International Publishing, 2016.
[20] XIAO Li-qing. A modified newton-raphson absolute image reconstruction algorithm for ERT [J]. Journal of Tianjin University: Science and Technology, 2015, 48(8): 734�C741. DOI: 10.11784/ tdxbz201402019. (in Chinese)
[21] LI Xiu-yan, HAN Qian, WANG Jian-ming, WANG Qi, DUAN Xiao-jie. ERT image reconstruction based on improved CG method [J]. Chinese Journal of Scientific Instrument, 2016, 37(7): 1673�C1679. DOI: 10.3969/ j.issn.0254-3087.2016.07.029. (in Chinese)
[22] YORKEY T J, WEBSTER J G, TOMPKINS W J. Comparing reconstruction algorithms for electrical impedance tomography [J]. Biomedical Engineering IEEE Transactions, 1987, BME-34(11): 843�C852. DOI: 10.1109/TBME. 1987.326032.
(Edited by FANG Jing-hua)
���ĵ���
һ�־�������ʶ������������Ӧ�������������
ժҪ����ͳ�ĵ����������(ERT)�������Բ��þ�̬�ṹ����������������ʵʱ���Ĺ����ж�ERT�������������͵ı仯��������Ӧʽ�Ż������ܻ�Ҫ�������һ���⣬���ķ��������Ͷ��������Ե�Ӱ�죬���һ�־��ж�̬�ṹ������ӦERT����������ERT�������ĵ缫���в�������ʽ�ṹ����������ʶ��������ERT��������ƣ����һ�ֻ����ź�ϡ���Ե�ERT����ʶ���������źŵ�ϡ���ʾ������ERTϵͳ�IJ�����ѹ��ʾΪϡ������ϣ��������ϡ�������ʵ�ֶԲ�ͬ�����ͽ��з��ࡣ����ʶ����Ϣ�����룬ʹ�øô��������и���ʵʱ�����ͱ仯������Ӧ�ض�̬�����������ṹ���Ż����������ܵ����ܻ����ܡ�ʵ��������ô����������Զ�ʶ��о������״���������ͻ�����4�ֵ������ͣ�ʶ���ʷֱ�Ϊ91%��93%��90%��88%����Բ�ͬ���ͣ�����̬�Ż���Ĵ�������ʹERTͼ���ؽ�������������ߡ�
�ؼ��ʣ����������������Ӧ��������ϡ���ʾ������ʶ��
Foundation item: Projects(51405381, 51674188) supported by the National Natural Science Foundation of China
Received date: 2018-02-05; Accepted date: 2018-06-01
Corresponding author: WANG Pai, PhD, Associate Professor; Tel: +86-13992840702; E-mail: wangpai2013@xust.edu.cn; ORCID: 0000-0001-7402-8987
Abstract: The all traditional electrical resistance tomography (ERT) sensors have a static structure, which cannot satisfy the intelligent requirements for adaptive optimization to ERT sensors that is subject to flow pattern changes during the real-time detection of two-phase flow. In view of this problem, an adaptive ERT sensor with a dynamic structure is proposed. The electrodes of the ERT sensor are arranged in an array structure, the flow pattern recognition technique is introduced into the ERT sensor design and accordingly an ERT flow pattern recognition method based on signal sparsity is proposed. This method uses the sparse representation of the signal to express the sampling voltage of the ERT system as a sparse combination and find its sparse solution to achieve the classification of different flow patterns. With the introduction of flow identification information, the sensor has an intelligent function of adaptively and dynamically adapting the sensor structure according to the real-time flow pattern change. The experimental results show that the sensor can automatically identify four typical flow patterns: core flow, bubble flow, laminar flow and circulation flow with recognition rates of 91%, 93%, 90% and 88% respectively. For different flow patterns, the dynamically optimized sensor can significantly improve the quality of ERT image reconstruction.
