

Influence of casting module on corrosion behavior of Mg-11Gd-3Y alloy
LIU Xian-bin, SHAN Da-yong, SONG Ying-wei, CHEN Rong-shi, HAN En-hou
State Key Laboratory for Corrosion and Protection, Institute of Metal Research,
Chinese Academy of Sciences, Shenyang 110016, China
Received 25 September 2010; accepted 20 December 2010
Abstract:
The influences of two kinds of casting modules of metal casting (MC) and expandable pattern casting (EPC) on the corrosion behavior of Mg-11Gd-3Y alloy were studied by electrochemical measurements, scanning electron microscopy (SEM) observation, X-ray diffractometry (XRD) and X-ray photoelectron spectroscopy (XPS) analysis. It is found that the quantity of the Mg24 (Gd, Y)5 phase in MC is more than that in EPC due to the cooling rate. There is more alloying element dissolved in the matrix compared with MC. For EPC, the galvanic corrosion effect between the matrix and the Mg24 (Gd, Y)5 phase decreases and the corrosion resistance increases compared with the MC. The chief corrosion mode for Mg-11Gd-3Y alloy is pitting corrosion because most of the alloying elements are transformed into intermetallic phases. The average corrosion rate of the MC alloy in the immersion test is five times higher than that of EPC alloy and yttrium is present in the product film, which will provide increased protection for Mg-11Gd-3Y alloy. The electrochemical measurements and immersion test show that the EPC process increases the corrosion resistance compared with the MC Mg-11Gd-3Y alloy.
Key words:
Mg-11Gd-3Y alloy; corrosion behavior; casting module; expandable pattern casting; metal casting;
1 Introduction
Magnesium and its alloys have been applied widely to the automotive, aerospace and electronic industries in recent years due to their high specific strength and low densities[1-3]. Moreover, the magnesium alloys containing rare earth elements have attracted remarkable attention because of their special properties[4]. The addition of rare earth elements including yttrium and gadolinium significantly improves the mechanical properties and corrosion resistance of magnesium alloys due to the solution hardening, precipitation hardening[5], scavenger effect[6] and grain refining effect[7]. Meanwhile, the surface oxide film and grain size of magnesium alloys can be affected by the addition of rare earth elements[8].
Metal casting is the main casting method for magnesium alloys due to its convenience and low cost. However, it cannot be applied to complex magnesium items[9]. So the expandable pattern casting process has been introduced into magnesium casting. The previous research on the corrosion behavior of various magnesium alloys indicates that the corrosion resistance greatly relies on their microstructure and the distribution of alloying elements[10-12]. However, most researches mainly focus on the mechanical properties of Mg-11Gd-3Y alloy and few researches concern with their corrosion behaviors[13-14], and in particular, with the effect of the two kinds of casting modules on their corrosion behaviors. It is well known that poor corrosion resistance is the greatest obstacle to the industrialization of magnesium alloys[15]. Thus, it is well worth doing some research to improve their corrosion resistance.
However, our current knowledge is insufficient for understanding the influences of casting module on the corrosion behavior of Mg-11Gd-3Y magnesium alloy in aqueous solution. Therefore, the corrosion behavior of two casting modules of Mg-11Gd-3Y magnesium alloy was investigated by electrochemical measurements, immersion tests, hydrogen evolution measurements, surface observations and X-ray photoelectron spectroscopy analysis in the present work; the influences of casting module on the corrosion behavior of Mg-11Gd-3Y alloy were discussed.
2 Experimental
2.1 Sample preparation
Mg-11Gd-3Y cast alloys with composition (mass fraction, %) of 10.1% Gd, 3.7% Y, 0.25% Zr and 85.95% Mg, were cast by the MC and the EPC processes, respectively.
Specimens for electrochemical and hydrogen evolution tests were mounted in epoxy resin and only about 1 cm2 surface was exposed. The electrochemical measurements were executed after the specimens were polished using 2000 grade SiC paper, washed in running distilled water and wiped with absorbent cotton. After wet-grinding with 2000 grade SiC paper, the specimens for immersion tests and surface morphology observation were finely polished using 0.5 ��m-diamond paste, ultrasonically cleaned in acetone and dried in cold air.
2.2 Phase and surface composition analysis
The phases of the specimens were measured using a D/max2400 X-ray diffraction (XRD) instrument, and the diffraction angle was set from 10�� to 90��. The Jade 5.0 software and crystallographica Search-Match software were applied to analyzing the XRD data. The surface composition was measured using ESCALAB250 X-ray photoelectron spectroscope (XPS). The analyzed sample was dried by argon and the sample was put in a plastic bottle protected with argon before being put into the XPS equipment. The experimental data were fitted with XPSPEAK4.1 software.
2.3 Electrochemical and immersion measurements
0.1 mol/L NaCl solution (analytical reagent) was the corrosive medium. Potentiodynamic polarization experiments were done using EG&G potentiostat model 273. Three-electrode system was used with Mg-11Gd-3Y alloy as working electrode, platinum as counter electrode and saturated calomel electrode(SCE) (0.242 V vs SHE) as reference electrode. Measurement regions were set from -0.2 to 0.2 V vs open circuit potential with a constant scanning rate of 0.5 mV/s after an initial delay of 400 s. The samples were measured immediately after grinding using 2000 grade SiC paper, washing in running distilled water and wiping with absorbent cotton.
Electrochemical impedance spectroscopy (EIS) measurements were monitored using a model 5210 lock in amplifier coupled with EG&G potentiostat model 273. Scan frequency ranged from 100 kHz to 10 mHz and perturbation amplitude was 5 mV. Those specimens were immersed into 0.1 mol/L NaCl solution to obtain a stable testing system within an initial delay of 800 s at open circuit potential. ZsimWin3.20 software was applied to fitting the experimental data.
The hydrogen evolution volume (HEV) was measured using gas collection apparatus [16-18].
2.4 Observations of corrosion morphology
Those specimens were immersed in 0.1 mol/L NaCl solution for 1-48 h, and then cleaned in acetone and dried in cold air. The micro-morphologies were observed using Phillips XL30 scanning electron microscope equipped with energy dispersive X-ray spectroscope (EDS). The corroded samples were sputtered with carbon for better morphology observation. The macro- morphologies were observed using a Leica S6D vertical optical microscope equipped with a Canon digital camera.
3 Results and discussion
3.1 Microstructure of MC and EPC Mg-11Gd-3Y alloys
The phases of MC and EPC Mg-11Gd-3Y cast alloy were measured by XRD and the results are illustrated in Fig.1. The cast Mg-11Gd-3Y alloy consists of ��-Mg and Mg24 (Gd,Y)5 phase. Compared with EPC Mg-11Gd-3Y alloy, most of the rare element is in the form of the intermetallic compound Mg24 (Gd, Y)5 phase, as shown in Fig. 1. According to the theory of transformation in solid metal[19] and the Mg-Gd phase diagram[20], the cooling rate of EPC is less than that of MC. So the concentration of rare earth element in the MC matrix is less than that in the EPC matrix and the intermetallic compound of MC is increased greatly compared with the EPC.
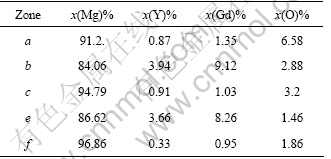
The microstructure of Mg-11Gd-3Y cast alloy consisted of primary ��-Mg and Mg24 (Gd, Y)5 phase as illustrated in Fig.2. The morphologies of EPC alloy are illustrated in Figs.2 (a) and (b). The Mg24 (Gd, Y)5 phase is located in the grain boundaries as a eutectic. The grain size of EPC alloy is about twice that of the MC sample. Both MC and EPC samples contain some cast impurities because the rare earth element is so active and easily transformed into oxide during smelting, as shown in Figs.2(a) and (c). The fine element analysis zone selected and EDS analysis results are presented in Figs.2(b) and (d) and Table 1, respectively. The rare earth element dissolved in the EPC sample matrix is twice as much as that in the MC sample matrix based on the EDS analysis results.
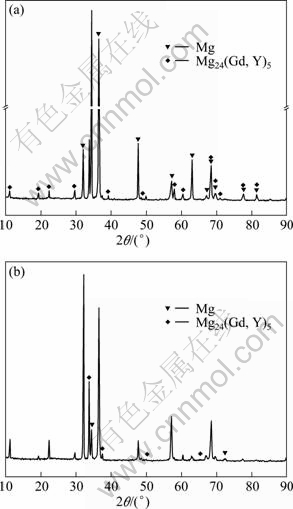
Fig.1 XRD patterns of EPC (a) and MC (b) Mg-11Gd-3Y alloy
Table 1 EDS results for different zones in Figs.2 (b) and (d)
3.2 Electrochemical measurements of MC and EPC Mg-11Gd-3Y alloys
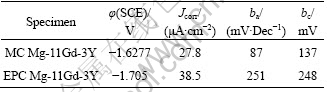
MC and EPC Mg-11Gd-3Y alloys were studied by measuring the potentiodynamic curves after an initial delay of 400 s in 0.1 mol/L NaCl solution, as shown in Fig.3. The curves were fitted using CorrView software in Tafel mode (traditional). The fitting results are listed in Table 2. Figure 3 and Table 2 indicate that the corrosion potential (��corr) of the EPC alloy shifts to a more negative value compared with the MC alloy because the Mg24(Gd,Y)5 phase is a stronger cathodic phase compared with the Mg matrix. Therefore the increase of cathodic reaction for the MC alloy is due to the presence of more cathodic phases compared with the EPC alloy. And the rare earth elements dissolved in the matrix would decrease the potential difference between the Mg24 (Gd, Y)5 phase and the matrix. For cathodic part, more rare earth elements are transformed into intermetallic compound for the MC alloy, the dissolved amount in the matrix is decreased, and all factors cause the cathodic dynamic parameter-cathodic Tafel slope (bc) of the MC alloy be less than that of the EPC alloy (Table 2). For the anodic part, the quantity of intermetallic compound in the MC alloy is more than that in the EPC alloy, due to the galvanic corrosion effect; the anodic corrosion is accelerated and the anodic dynamic parameter-anodic Tafel slope (ba) of MC alloy are less than in the case of the EPC alloy (Table 2).
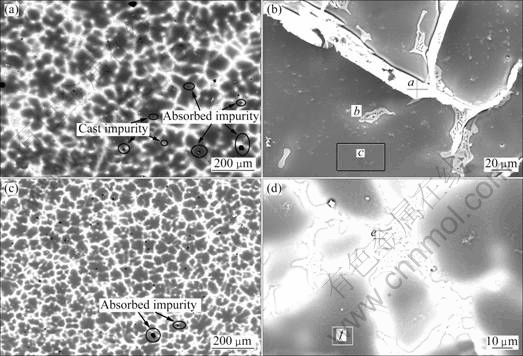
Fig.2 Backscattered electron images of Mg-11Gd-3Y alloy at low and high magnification: (a), (b) EPC; (c), (d) MC
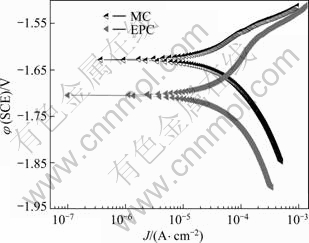
Fig.3 Polarization curves of MC and EPC Mg-11Gd-3Y alloy in 0.1 mol/L NaCl solution
Table 2 Fitting results of polarization curves in 0.1mol/L NaCl solution
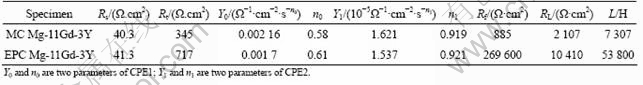
The corrosion behaviors of MC and EPC Mg-11Gd-3Y alloys in 0.1 mol/L NaCl were investigated by EIS measurements at open circuit potential, as shown in Fig.4. The Nyquist diagrams for all samples consist of three loops, a high frequency capacitive loop, a medium frequency capacitive loop and a low frequency inductive loop. The EIS plots can be equivalent to the circuit shown in Fig.5. The high frequency capacitive loop is attributed to the charge transfer reaction in the electric double layer formed at the interface between metal surface and corrosive medium, which can be described by charge transfer resistance (Rt) and constant phase element (CPE1)[21]. And the value of Rt indicates the corrosion resistance of the alloy in this corrosion medium. Evidently, the Rt value of the EPC sample is larger than that of the MC sample (see Table 3). The n value is the dispersion coefficient for CPE, which reflects the smoothness of the electrical double layer. The medium frequency capacitive loop is attributed to the mass transport in the solid phase, such as the diffusion of ions through the hydroxide or oxide film, which can be described by a constant phase element (CPE2) (a film capacity) and Rf (a film resistance)[22-23]. When the n value of CPE2 is close to 1, the CPE2 is a capacity. The integrity of the film is increased with the increase of Y1. So the increasing sequence of integrity of the film is EPC and then MC, (see Table 3). The low frequency inductive loop is attributed to the change of surface integrity[24], which can be described by RL and L. The equivalent circuit parameters can be calculated with Zsimpwin software and the results are listed in Table 3. The Rt value can disclose the corrosion resistance of the alloy in this corrosion medium and the Y1 value of CPE2 can disclose the integrity of the film. It is found that the EPC alloy has the highest Rt and Y1 values. This indicates that the corrosion resistance of Mg-11Gd-3Y alloy can be improved by the EPC process.
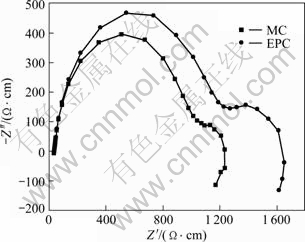
Fig.4 Nyquist diagram of MC and EPC Mg-11Gd-3Y alloys in 0.1 mol/ L NaCl solution
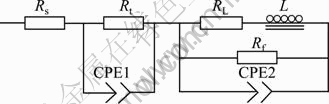
Fig.5 Equivalent circuit of EIS plots for Mg-11Gd-3Y in 0.1 mol/L NaCl solution
Table 3 EIS fitting results for MC and EPC Mg-11Gd-3Y in 0.1 mol/ L NaCl solution
3.3 Immersion tests
Immersion tests were also carried out to determine the details of the corrosion behavior, and the H2 evolution volume was used to characterize the corrosion velocity at room temperature. The testing solution was replaced every 24 h. The ratio of solution volume and specimen area was about 240 mL/cm2. For MC and EPC alloys, there is a small difference in H2 evolution volume in the first 600 min, as shown in Fig.6. There is an obvious acceleration for the MC specimen after 600 min and its evolution speed of H2 is higher than that of the EPC alloy because of the micro-galvanic corrosion effect. The conversion relationship of hydrogen evolution volume to mass loss is 1 mL H2 for 1.084 8 mg Mg. The average mass loss rates of MC and EPC samples are 4.505 6 mg/(cm2��d) and 0.901 1 mg/(cm2��d), respectively. The corrosion rate of MC sample is higher than that of EPC sample in 3 500 min; however, the average mass loss rate of the EPC sample is much lower than that of the MC alloy. The immersion results show that EPC can improve the corrosion resistance of alloy in 0.1 mol/L NaCl.
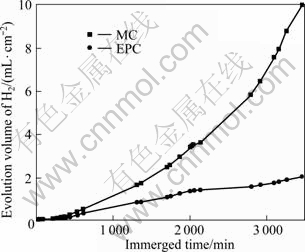
Fig.6 Hydrogen evolution volume of MC and EPC Mg-11Gd-3Y alloys in 0.1 mol/L NaCl solution
3.4 Corrosion morphology of Mg-11Gd-3Y alloys
The surface morphologies of MC and EPC Mg-11Gd-3Y alloys immersed in 0.1 mol/L NaCl solution for 1-48 h were observed with scanning electron microscope (SEM) and a Leica S6D vertical optical microscope as shown in Figs.7-11.
It can be seen in Fig.7 that the surface morphologies of MC and EPC Mg-11Gd-3Y alloys exhibit localized corrosion morphology after 1 h immersion. The corrosive pits are mostly located at the grain boundaries and only few corrosive pits are located in the matrix, as shown in Fig.7 and Fig.10. Most intermetallic compound phases are located at the grain boundaries with the microstructure analysis. The galvanic corrosion occurs in the zones adjacent to the grain boundaries due to the potential difference between the Mg24 (Gd, Y)5 phase and the magnesium matrix, so the pitting corrosion is likely to occur in this zone. There are more corrosion pits on the MC sample than those on the EPC sample and their diameter and depth on the MC sample are bigger than those on the EPC sample, as seen in Figs.7-10. This is the same as that can be seen in the macro-morphologies of the gold-coated specimens, as shown in Figs.9(a) and (b).
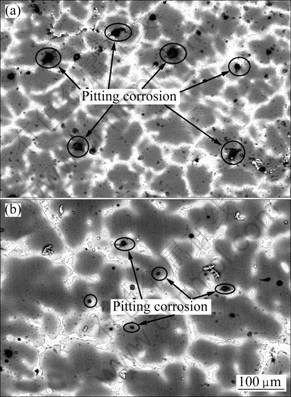
Fig.7 Corrosion microstructures of Mg-11Gd-3Y alloy after 1 h immersion in 0.1 mol/L NaCl solution: (a) MC; (b) EPC
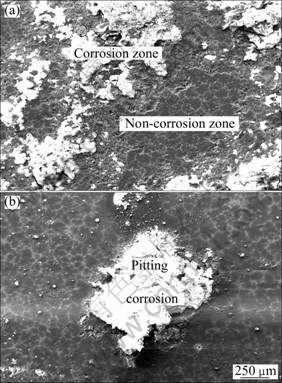
Fig.8 Corrosion microstructures of Mg-11Gd-3Y alloy after 48 h immersion in 0.1 mol/L NaCl solution: (a) MC; (b) EPC
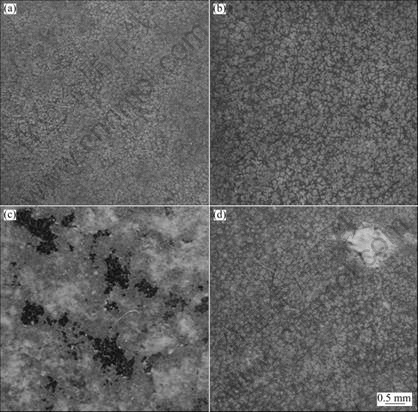
Fig.9 Corrosion macro-morphologies of Mg-11Gd-3Y alloys with different immersion time in 0.1mol/L NaCl solution: (a) 1 h and (b) 48 h for EPC alloy; (c) 1 h and (d) 48 h for MC alloy
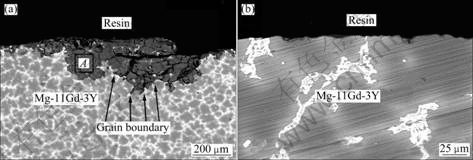
Fig.10 Cross-section micro-morphologies of Mg-11Gd-3Y alloys immersed in 0.1 mol/L NaCl solution for 48 h: (a) MC; (b) EPC
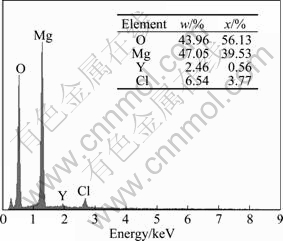
Fig.11 EDS analysis results for zone A in Fig.10(a)
Figures 8 and 9 show the surface morphologies of MC and EPC Mg-11Gd-3Y alloys after 48 h immersion. The MC sample was dipped in the cleaning solution of 200 g/L CrO3 and 10 g/L AgNO3 for 5 min to remove the corrosion product, then immediately dried and sputtered with carbon. Evidently, the corrosion resistance of the MC sample is worse, as shown in Fig.8. Most surface of the MC sample is corroded and little of the EPC sample is corroded.
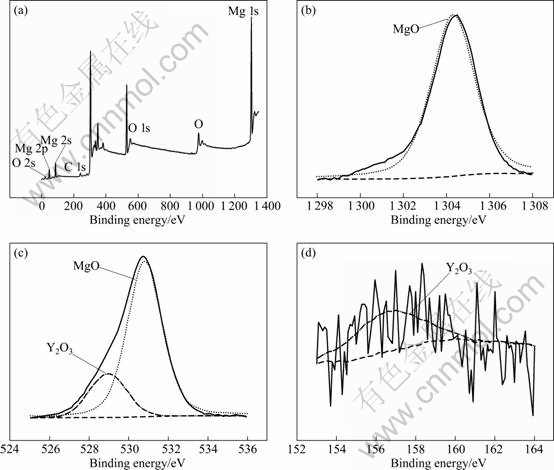
Fig.12 XPS analysis results of corrosion products of EPC Mg-11Gd-3Y alloy in 0.1 mol/L NaCl solution after 24 h after 60 s etching: (a) General diagram; (b) Mg 1s; (c) O 1s; ( d) Y 3d
The cross-section morphology of Mg-11Gd-3Y alloy immersed in 0.1 mol/L NaCl solution for 48 h was selected to present the information of corrosion zone in Fig.10. The EDS analysis of the corrosion product shows that the elements of components are Mg, Y, O and Cl in Fig. 11. Therefore, the dissolved yttrium took part in the corrosion reaction, which is proved in Fig.12. The foreland of the corrosion product is by grain boundaries of MC Mg-11Gd-3Y alloy and the Mg24 (Gd, Y)5 phase provided some barrier effect on this kind of alloy. The main corrosion zone is the area around the grain boundaries.
The EPC Mg-11Gd-3Y alloy was immersed in 0.1 mol/L NaCl solution for 24 h, and then the surface film was analyzed using XPS (Fig.12). It is found that the corrosion product consists of MgO and Y2O3. The magnesium oxides are the main corrosion products of the surface layer from XPS analysis. All results show that the film has some relation with the dissolved yttrium, and the added gadolinium is transformed into net- Mg24(Gd, Y)5 phase which could provide a barrier in the corrosion medium.
4 Conclusions
1) For different cooling rates, the quantity of the Mg24 (Gd, Y)5 phase in MC is more than that in EPC and more alloying elements are dissolved into the matrix compared with MC. For EPC, the galvanic corrosion effect between the matrix and the Mg24 (Gd, Y)5 phase decreases and the corrosion resistance increases compared with the MC in 0.1 mol/L NaCl solution.
2) The chief corrosion mode for this kind of magnesium alloy is pitting corrosion because most of the alloying elements are transformed into intermetallic phases. The average corrosion rate of the EPC alloy in the immersion test is 20% of the MC alloy.
3) The XPS analysis results and cross-section corrosion product analysis show that yttrium is present in the product film that can provide increased protection for Mg-11Gd-3Y alloy. Electrochemical measurements and the immersion test show that the EPC process increases the corrosion resistance of Mg-11Gd-3Y alloy compared with the MC.
Acknowledgements
The authors gratefully acknowledge Dr LI Qing-lin who provided the Mg-11Gd-3Y alloy. LIU Xian-bin also wishes to thank Miss LIU Na who did some modifications for this work.
References
[1] SONG G. Recent progress in corrosion and protection of magnesium alloys [J]. Advanced Engineering Materials, 2005, 7(7): 563-586.
[2] CHENG Ying-liang, QIN Ting-wei, WANG Hui-min, ZHANG Zhao. Comparison of corrosion behaviors of AZ31, AZ91, AM60 and ZK60 magnesium alloys [J]. Transactions of Nonferrous Metals Society of China, 2009, 19(3): 517-524.
[3] FELIU S J, PARDO A, MERINO M C, COY A E, VIEJO F, ARRABAL R. Correlation between the surface chemistry and the atmospheric corrosion of AZ31, AZ80 and AZ91D magnesium alloys [J]. Applied Surface Science, 2009, 255(7): 4102-4108.
[4] PENGHUAI F, LIMING P, HAIYAN J, ZHENYAN Z,CHUNQUAN Z. Fracture behavior and mechanical properties of Mg-4Y-2Nd-1Gd-0.4Zr (wt.%) alloy at room temperature [J]. Materials Science and Engineering A, 2008, 486(1-2): 572-579.
[5] WANG J, MENG J, ZHANG D, TANG D. Effect of Y for enhanced age hardening response and mechanical properties of Mg-Gd-Y-Zr alloys [J]. Materials Science and Engineering A, 2007, 456(1-2): 78-84.
[6] TAKENAKA T, ONO T, NARAZAKI Y, NAKA Y,KAWAKAMI M. Improvement of corrosion resistance of magnesium metal by rare earth elements [J]. Electrochimica Acta, 2007, 53(1): 117-121.
[7] ZHANG Jing-huai, WANG Jun, QIU Xin, ZHANG De-ping, TIAN Zheng, NIU Xiao-dong, TANG Ding-xiang, MENG Jian. Effect of Nd on the microstructure, mechanical properties and corrosion behavior of die-cast Mg-4Al-based alloy [J]. Journal of Alloys and Compounds, 2008, 46(1-2): 556-564.
[8] LUO T J, YANG Y S, LI Y J, DONG X G. Influence of rare earth Y on the corrosion behavior of as-cast AZ91 alloy [J]. Electrochimica Acta, 2009, 54(26): 6433-6437.
[9] LIU Zi-li, PAN Qing-lin, CHEN Zhao-feng, LIU Xi-qin, TAO Jie. Heat transfer characteristics of lost foam casting process of magnesium alloy [J]. Transactions of Nonferrous Metals Society of China, 2006, 16(2): 445-451.
[10] GAO Y, WANG Q, GU J, ZHAO Y, TONG Y, KANEDA J. Effects of heat treatments on microstructure and mechanical properties of Mg-15Gd-5Y-0.5Zr alloy [J]. Journal of Rare Earths, 2008, 26(2): 298-302.
[11] SUN M, WU G, WANG W, DING W. Effect of Zr on the microstructure, mechanical properties and corrosion resistance of Mg-10Gd-3Y magnesium alloy [J]. Materials Science and Engineering A, 2009, 523(1-2): 145-151.
[12] CHANG J, GUO X, HE S, FU P, PENG L, DING W. Investigation of the corrosion for Mg�CxGd�C3Y�C0.4Zr (x = 6, 8, 10, 12 wt%) alloys in a peak-aged condition [J]. Corrosion Science, 2008, 50(1): 166-177.
[13] HE S M, ZENG X Q, PENG L M, GAO X, NIE J F, DING W J. Microstructure and strengthening mechanism of high strength Mg-10Gd-2Y-0.5Zr alloy [J]. Journal of Alloys and Compounds, 2007, 427(1-2): 316-323.
[14] LI J P, YANG Z, LIU T, GUO Y C, XIA F, YANG J M, LIANG M X. Microstructures of extruded Mg-12Gd-1Zn-0.5Zr and Mg-12Gd-4Y-1Zn-0.5Zr alloys [J]. Scripta Materialia, 2007, 56(2): 137-140.
[15] SONG G, ATRENS A. Understanding magnesium corrosion- framework for improved alloy performance [J]. Advanced Engineering Materials, 2003, 5(12): 837-858.
[16] CHEN J, DONG J, WANG J, HAN E, KE W. Effect of magnesium hydride on the corrosion behavior of an AZ91 magnesium alloy in sodium chloride solution [J]. Corrosion Science, 2008, 50(12): 3610-3614.
[17] ZHAO M, LIU M, SONG G,ATRENS A. Influence of the ��-phase morphology on the corrosion of the Mg alloy AZ91 [J]. Corrosion Science, 2008, 50(7): 1939-1953.
[18] LIU Xian-bin, SHAN Da-yong, SONG Ying-wei, HAN En-hou. Effects of heat treatment on corrosion behaviors of Mg-3Zn magnesium alloy [J]. Transactions of Nonferrous Metals Society of China, 2010, 20(7): 1345-1350.
[19] XU Zhou, ZHAO Lian-cheng. Theory on transformation in solid metal [M]. Beijing: Science Press, 2005: 156-157. (in Chinese)
[20] MASSALSKI T B, OKAMOTO H, SUBRAMANIAN P R, KACPRZAK L. Binary alloy phase diagrams [M]. The Materials Information Society, 1990.
[21] MORLIDGE J R, SKELDON P, THOMPSON G E, HABAZAKI H, SHIMIZU K,WOOD G C. Gel formation and the efficiency of anodic film growth on aluminium [J]. Electrochimica Acta, 1999, 44(14): 2423-2435.
[22] GABOVICH A M, VOITENKO A I. Surface tension at the electrolyte solution-metal electrode interface-��. Polyvalent and non-symmetrical electrolytes [J]. Electrochimica Acta, 1990, 35(2): 545-554.
[23] CAO Chu-nan, ZHANG Jian-qing. An introduction to electrochemical impedance spectroscopy [M]. Beijing: Chinese Science Press, 2002: 26-30. (in Chinese)
[24] CHEN J, WANG J, HAN E, DONG J,KE W. AC impedance spectroscopy study of the corrosion behavior of an AZ91 magnesium alloy in 0.1M sodium sulfate solution [J]. Electrochimica Acta, 2007, 52(9): 3299-3309.
��עģ��Mg-11Gd-3Yþ�Ͻ�ʴ��Ϊ��Ӱ��
���ͱ����£���Ӱΰ������ʯ��������
�й���ѧԺ �����о��� ������ʴ����������ص�ʵ���ң����� 110016
ժ Ҫ�����õ绯ѧ������ɨ��羵�۲졢X���������X���߹��������������ʧģ����ͽ���������Mg-11Gd-3Yþ�Ͻ�ĸ�ʴ��Ϊ��Ӱ������о���������ȴ�ٶȵIJ���ʹ����ʧģ����Mg-11Gd-3Yþ�Ͻ��Mg24(Gd, Y)5���������ԱȽ���������Mg-11Gd-3Yþ�Ͻ���٣�������ڻ����еĺϽ�Ԫ�����Ը��ڽ���������Mg-11Gd-3Yþ�Ͻ�ġ�������ʧģ���죬����Mg24 (Gd, Y)5����Խ��٣������˻�����ڶ���֮��ĵ�ż��ʴЧӦ�����ڶ����Ͻ�Ԫ���Եڶ������ʹ�������ͬ��עģ�����Mg-11Gd-3Yþ�Ͻ�ĸ�ʴʧЧ��ʽ��Ϊ��ʴ������������Mg-11Gd-3Yþ�Ͻ��ƽ����ʴ����Ϊ��ʧģ��6����Y�����ںϽ�IJ���Ĥ�У���һ���ı������ã�����ߺϽ����ʴ���ܡ��绯ѧ���Ժͽ�������֤��������Mg-11Gd-3Yþ�Ͻ�����������������ʧģ���������ߺϽ����ʴ���ܡ�
�ؼ��֣�Mg-11Gd-3Y�Ͻ𣻸�ʴ��Ϊ����עģ����ʧģ������ģ
(Edited by LI Xiang-qun)
Foundation item: Project (2007CB613705) supported by the National Basic Research Program of China
Corresponding author: SHAN Da-yong; Tel: +86-24-23893115; Fax: +86-24-23894149; E-mail: dyshan@imr.ac.cn
DOI: 10.1016/S1003-6326(11)60800-5
