

J. Cent. South Univ. (2019) 26: 1000-1010
DOI: https://doi.org/10.1007/s11771-019-4066-y

Accurate estimation of soil shear strength parameters
CHEN Li-hong(������)1, LI Xu(����)1, XU Yao(��ҫ)2, CHEN Zu-yu(������)2, DENG Gang(�˸�)2
1. Department of Civil Engineering, Beijing Jiaotong University, Beijing 100044, China;
2. China Institute of Water Resources and Hydropower Research, Beijing 100038, China
 Central South University Press and Springer-Verlag GmbH Germany, part of Springer Nature 2019
Abstract:
The cost and safety of geotechnical engineering are highly depending on the accuracy of soil shear strength parameters. There are three methods often used to estimate soil shear strength parameters, i.e., moment method, 3-sigma rule and linear regression method. In this study, the accuracy of these three methods is compared. Traditional linear regression method (LRM) can only offer the mean of shear strength parameters. Some engineers misuse the standard error of shear strength indexes as the standard deviations. Such misuse may highly underestimate the uncertainty and induce high risk to the geotechnical design. A modified LRM is proposed to determine both the mean and variance of shear strength parameters. The moment method, three-sigma rule and LRM are used to analyze the tri-axial test data in Xiaolangdi Hydraulic Project and three numerical shear strength tests. The results demonstrate that: 1) The modified LRM can offer the most accurate estimation to shear strength parameters; 2) A dimensionless formula is much preferred in LRM rather than a dimensional formula. The stress ratio formula is much better than stress relation in the shear strength parameter analysis. The proposed method is applicable to shear strength parameter analysis for tri-axial test data, direct shear test and the un-drained shear strength test of stratified clay.
Key words:
Cite this article as:
CHEN Li-hong, LI Xu, XU Yao, CHEN Zu-yu, DENG Gang. Accurate estimation of soil shear strength parameters [J]. Journal of Central South University, 2019, 26(4): 1000�C1010.
DOI:https://dx.doi.org/https://doi.org/10.1007/s11771-019-4066-y1 Introduction
In geotechnical engineering, the reliability analysis [1�C4], limit state design, or the estimation of characteristic values (or nominal values) all require the knowledge on the mean and standard deviation of a variable. Among all the soil properties, soil shear strength parameters are probably the most important properties in geotechnical engineering [5, 6]. The cost and safety of geotechnical structure are highly depending on the estimation of the characteristic values for soil shear strength parameters.
The cohesion and the friction angle are key variables in many geotechnical problems [7�C13]. Various methods have been developed for estimating the statistics of shear strength parameters, including the moment method, the linear regression method (LRM) and the three-sigma rule [14�C16]. However, the correlation between cohesion and friction angle are seldom addressed in these methods and the accuracy of these methods are seldom compared. It is desired to find an optimum data analysis method for soil shear strength parameters. In this study, these three methods will be applied to analyzing the shear strength parameters for a real project and their accuracy will be compared.
As will be seen later in this paper, while LRM is widely used in geotechnical engineering, such a method is often misused for estimating the standard deviation of shear strength parameters in practice, which could potentially lead to serious consequence due to un-conservative design. This paper also has the following objectives: 1) to reveal the common mistake that regarding the standard error in LRM as the standard deviation of variable; 2) to develop a modified linear regression method (MLRM) that can estimate the variance of regression parameters correctly. The proposed method can be used to estimate shear strength parameters for the direct shear test data, the tri-axial test data, and the T-bar penetration test data precisely.
2 Triaxial test data in Xiaolangdi Hydraulic Project
Xiaolangdi Hydraulic Project (XLDP) is a 154 m high embankment dam located in the middle of Yellow River, China. In this dam, clay is used to prevent seepage in the core wall. A thorough investigation of the soil shear strength has been conducted to the clay core in XLDP.
The physical properties of the clay are as follows: soil type is classified as silty clay with clay content in the range of (29��11)%, dry density in the range of (1.68��0.10) g/cm2, optimum water content in the range of (20.1��3.0)%, liquid limit in the range of 46.2��6.6, and the plastic limit in the range of 21.8��4.2.
Totally 64 groups of soil samples were taken from the clay core wall and each group consisted of 4�C6 specimens. Consolidated drained (CD) tri-axial compression tests were conducted to these specimens. Total 64 group and 320 tests were carried out and the confining pressures are in the range of 100�C1700 kPa [17]. The 320 tri-axial test data are shown in Figure 1.
The following methods are used to analyze the test data.
2.1 Moment method
Tri-axial test data are analyzed according to the location of specimens separately. These data are from 64 locations in the XLDP. For each location, 4�C6 samples are tested by CD tests with different confining pressures and ci and fi can be solved with using these CD tests data. Total 64 ci and fi are used to determine the statistical characteristics of c and f.
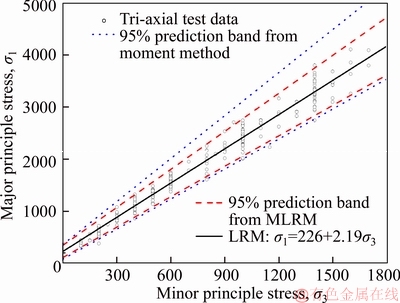
Figure 1 Consolidated drained tri-axial test results of clay in core wall of Xiaolangdi dam
For soil friction angle, five distribution patterns, including the normal distribution, log- normal distribution, Weibull distribution, exponential distribution and Gamma distribution, are used to fit the data. Among them, normal distribution, log-normal distribution and Gamma distribution are accepted in the goodness of fitting tests, as shown in Figure 2(a). Normal distribution is found to the best one.
For soil cohesion, these five distribution patterns are also used to fit the data. Among them, normal distribution and Weibull distribution are accepted, as shown in Figure 2(b). Normal distribution is found to the best one.
2.2 Graphical three-sigma rule
For convenience, the mean, standard variation (SD), and coefficient of variation (CV) of a variable is represented by ��, ��, and ��, respectively. The operation of calculating the mean and variance is represented as E() and V(). Soil cohesion, friction, and friction angle is represented by c, f, and ��, respectively. Soil major and minor principle stresses are represented by ��1 and ��3. Soil mean stress is remembered as p and calculated as (��1+��3)/2; soil deviatoric stress is remembered as q and calculated as (��1�C��3)/2.
The graphical three-sigma rule [14] is used to analyze the CD test data in XLDP. In graphical three-sigma rule, all the CD test data are pooling together as shown in Figure 3. Then the highest conceivable value of the parameter (HCV) and the lowest conceivable value of the parameter (LCV) are graphically estimated. Further, the mean and standard variation can be estimated as:
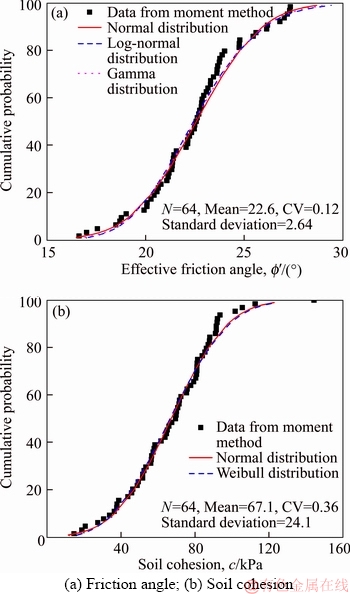
Figure 2 Soil shear strength parameters from moment method:
 (1)
(1)
However, there are two difficulties involving in graphical three-sigma rule:
1) For such problem involving double or more than two variables, the solution of graphical three- sigma rule is not unique. Graphical three-sigma rule serves well for one variable problem, i.e., the undrained shear strength, but requires human judgments to select one solution when dealing with such kind of multi-variable problem.
2) Obviously, the cohesion and friction angle are dependent in graphical three-sigma rule. Comparing Figures 3(a) and (b), if friction angle is chosen higher, cohesion will be smaller, and vice versa.
2.3 Linear regression method
Linear regression method (LRM) may be the most popular data analysis method. In a simple linear regression, the following equation is of concern,
 (2)
(2)
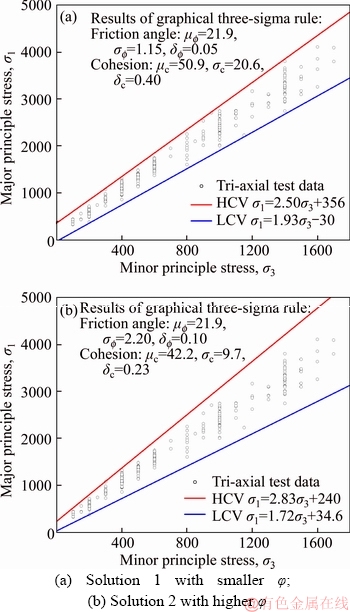
Figure 3 Soil shear strength parameters from graphical three-sigma rule:
where x and y are independent observed data; a and b are two undetermined parameters; �� is the residual, i.e., the error of prediction. LRM is based on the minimum of the residual sum of squares (RSS), which is expressed as:
 (3)
(3)
where ar, br are the regression values for a, b;  is the prediction of y, i.e.,
 By minimizing RSS, the regression parameters can be calculated as:
 (4)
(4)
where R is the coefficient of correlation between x, y and often named as R-value in LRM.
In linear regression method, all of the 320 test results are pooling together and analyzed by using Eqs.(2)�C(4). The results from LRM are plotted in Figure 4. Referring to Figure 4, LRM can be used to estimate the mean of shear strength parameters and the accuracy of its estimation is indicated by the standard error. Because the standard error decreases with the increase of the data number, in the case where the data number is large, just like this problem, LRM can give an accurate estimation of the mean.
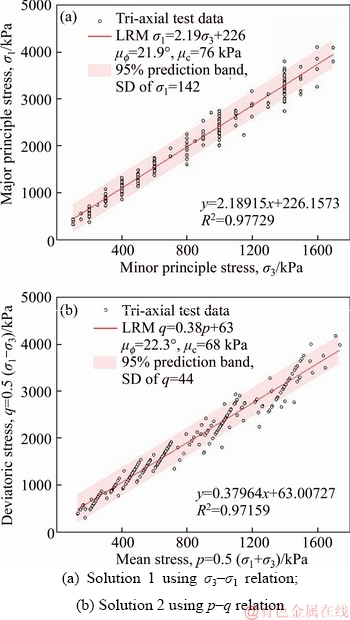
Figure 4 Soil shear strength parameters from linear regression method:
However, LRM also has the following disadvantages in the analysis of tri-axial test data:
1) LRM cannot offer the uncertainties of shear strength parameter, such as the standard derivations of cohesion and friction angle.
2) In the regression, ar and br are negatively correlated [18], as with correlation coefficients of �C0.84 and �C0.86 in Figures 4(a) and (b), respectively.
3) LRM results vary with the fitting equations used. There are at least 3 candidate equations that can be used in the data analysis of tri-axial test data, including the ��3�C��1 relation, the p�Cq relation, and the stress ratio relation.
The upper three methods all have their own disadvantages in the data analysis of tri-axial test data. It is desired to find a better data analysis for shear strength analysis, which can predict the shear strength accurately, i.e., without underestimate or overestimate the uncertainties.
3 Misuse of standard error in LRM
In original LRM [19�C22], the variance of a and b is unknown. Because the lack of the information of variance, one of most common misuses of LRM is that the standard error in LRM is adopted as the variance.
The standard error obtained in LRM can be calculated as,
 (5)
(5)
where a and b are the total number of data;  and
and  are the variance of residual �� and x, respectively; ar and br are the mean of a and b, respectively. Referring to Eq. (3), the standard errors decrease with the increase of the total number of data. The limits of the standard error of ar and br are approaching to 0 with n is approaching to infinity.
The standard error indicates the accuracy of the estimated ar and br, but not the variance of a and b. A small standard error indicates that the estimation of ar and br is accurate. Using the standard error of ar and br as the standard variance of a and b is wrong.
If the standard error is used as the variance, the uncertainty of y will be highly underestimated in the condition of large sample size n. However, in engineering, if the sample size is small, the standard errors are large and are often misused as the variance without any attention.
In shear strength investigation, more tests can help to obtain more accurate estimation of c and ��, but cannot reduce the natural uncertainties of c and ��. The attention of such kind of misuse should be raised. For example, in the pioneering work by LUMB [23], the standard error (Eq. (2)) is regarded as the variance. Lumb��s misuse of LRM is followed in many subsequent studies, including DNV [24]. If the sample size is large, such misuse will underestimate the uncertainty and may induce high risk to the geotechnical design.
4 Modified linear regression method
4.1 Difficulty involving in shear strength analysis with LRM
As noticed by MARK et al [25], ��Simple least-squares regression analysis is applied to almost all empirical curve-fitting problems in earth science (and related fields). Its use, however, should be restricted to predictive situations.�� It is worth looking back through the theory of linear regression method [19�C22], especially the relevant assumptions.
The simple linear regression analysis (Eqs. (2) to (4)) is based on the following assumptions [25]:
1) x and y are independent observations and without error.
2) The residual �� is a normally distributed random variable with a mean of 0 and a small variance V(��).
3) �� is independent with x. With this assumption, for a given x level, V(y|x) is equal to V(��). That��s to say, the variance of y should also be independent with x. In fact, this assumption makes the 95% prediction band and the best fit lines in LRM are three parallel lines (referring to Figure (4)).
LRM is often applied to problems without carefully checking the validity of these assumptions. The violations of these assumptions in the application of LRM [19, 25�C28] can cause significant error.
First, the error of x and y, which often originated from the measurement or statistics, can definitely affect the regression results [19, 25�C27] suggesting a modified equation to address the error of variables x and y for the estimation of b and the estimate to regression parameter b is supposed to locate in the following range: brr/R2. That��s to say, the estimation of regression parameter b is of high accuracy if R2 is close to 1.
Second, in the shear strength analysis, the following assumptions are indeed not valid: the residual �� is independent on x. In the shear strength analysis, the residual �� will definitely increase with the increase of x. For example, in tri-axial test, the shear strength increases with the confining pressure or the mean stress. The residual also increases with the confining pressure or the mean stress. Similarly, the variance of undrained shear strength of clay in offshore foundation is found to increase with depth [24].
If a new assumption is introduced, the residual �� in Eq. (3) is linear to x, the regression equation can be modified as:
 (6)
(6)
where �š� is ��/x and is independent to 1/x. Thus, the assumption of LRM is valid in such case. That��s to say, the stress ratio equation is preferred in shear strength analysis problem, as:
 (7)
(7)
or
 (8)
(8)
where �� is the shear strength; �� is the normal stress. All terms in Eqs. (6) and (7) are dimensionless. Such treatment is the normalization of shear strength formula. LRM should be conducted to the normalized formula and the regression error will be small.
Equation (7) is used to analyze the tri-axial test data in XLDP and the results are illustrated in Figure 5. Equation (7) can lead to larger average friction angle, as 23.2�� in Figure 5, comparing to the dimension formula, as 21.9�� or 22.3�� in Figure 4. Comparing Figure 5 to Figure 4, the residual from dimensionless formula is uniform distributed along the best fit curve (Figure 5), whereas the residual from dimensional formula increases with the increase of x. Referring to Figure 5, if using the dimensionless formula (Eq. (7)), the 95% prediction bands are c=55 kPa, ��=18.1��C27.3��. Referring to Figure 4(a), using the dimension formula (��3�C��1 relation), the 95% prediction bands are c=�C2.8�C 155.6 kPa, ��=21.9��, where soil cohesion can be negative and is meaningless. That��s to say, LRM results from the dimension formula will overestimate the uncertainty of shear strength at low confining pressure and may offer unreasonable shear strength (Figure 4). In the meantime, LRM results from the dimension formula will underestimate the uncertainty of shear strength at high confining pressure. LRM results from the dimensionless formula (as that in Figure 5) are considered to have a better characterization of soil shear strength.

Figure 5 LRM for shear strength problem
4.2 Solving variance of shear strength parameters with improved LRM
In original LRM, a and b are regarded as constants. If a and b are often regarded as variables, the LRM will be modified as:
(9)
where x and y are independent observed data; �� is the normally distributed error. Instead of the residual in Eq. (3), the uncertainty of y can be addressed by
 (10)
(10)
A new sum of square, termed as reliability based residual sum of squares (RBRSS), can be defined as:
 (11)
(11)
To minimize the RBRSS, a set of regression parameters, i.e., E(a), V(a), E(b) and V(b) can be determined. E(a), V(a), E(b) and V(b) can be solved by
 (12)
(12)
where �� represents one of E(a), V(a), E(b) and V(b). Many mathematical tools can be used to solve Eq. (12). In this research, the excel solver is used to solve this problem and the nonlinear generalized reduced gradient method (nonlinear GRG) is selected in the excel solver.
In shear strength analysis, the following symbols are used for convenience:

 (13)
(13)
Then the following relations are valid:
 (14)
(14)
Based on the definition of variance, the following equation is valid:

 (15)
(15)
where E and V are the operation for calculating the mean and variance for a variable; C(x, y) is the variance between variables x and y.
If c and f are assumed to be independent, based on Eqs. (15),
 (16)
(16)
Substituting Eq. (16) into Eq. (11) and regarding �� as E(c), V(c), E(��), V(��), Eq. (12) can be used to solve ��. Further, based on the Taylor expansion [29], the following equation exists:

 (17)
(17)
where  is a function of variables x and y. Therefore, based on Eq. (17) and ignoring high order terms, the statistical characteristics of f can be calculated as
 (18)
(18)
Thus, with using the upper proposed formula, the statistics of independent c and f can be calculated. This modified LRM is used to analyze the tri-axial test data in XLDP and the results are illustrated in Figure 6. The results of modified LRM in Figure 6 can match the test data very well and the 95% prediction band of modified LRM is superior to that of original LRM.
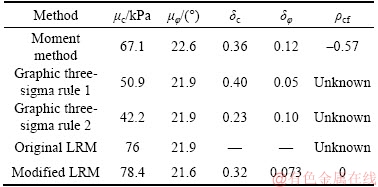
For the tri-axial test data in XLDP, the shear strength parameters from different methods are summarized in Table 1. It can be concluded that:
1) Moment method will overestimate the uncertainties of shear strength parameters.
2) Graphic three-sigma rule serves well. However, its results are not unique and involve unknown correlation coefficient between c and ��.
3) Original LRM can only offer the mean of c and ��, but cannot provide the uncertainty information for c and ��.
4) Modified LRM leads to optimum value for both the mean and variance of c and ��.
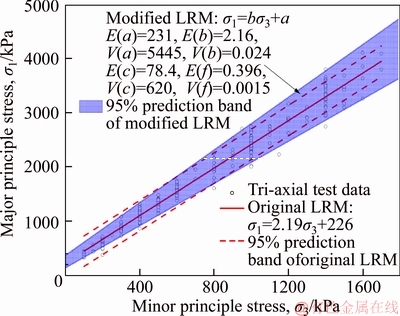
Figure 6 Modified LRM for shear strength analysis
Table 1 Shear strength of compacted clay in core wall of Xiaolangdi dam
5 Numerical verification of shear strength analysis methods
5.1 Numerical test plan
In the tri-axial test data in XLDP, there is no theoretical solution and the prediction error of different data analysis method is hard to be evaluated. In this section, numerical tests are carried out to compare the performance of different data analysis methods.
In numerical test, the statistical characteristics of shear strength parameters are given. Random values of the shear strength parameters are used to generate shear strength test data by using a specific shear strength criterion. Further, the moment method, three-sigma rule, LRM and the modified LRM are used to analyze the numerical test data.
In numerical tests, the input mean and variance of shear strength parameters is regarded as the right answer. The relative error between the values got in various data analysis methods and the input one can be used to evaluate the performance of different data analysis methods.
The direct shear test data, the tri-axial test data, and the undrained shear strength of stratified clay are used in the numerical verification, as listed in Table 2.
5.2 Shear strength analysis of numerical tests
The shear strength analysis results for the numerical direct shear test are plotted in Figure 7 and listed in Table 3. The results demonstrate that: the modified LRM offers the most accurate solution with relative errors smaller than 2%. The moment method will severely over-estimate the uncertainty of problem, whereas the three-sigma rule will under-estimate the uncertainty of problem.
The shear strength analysis results for the numerical tri-axial test are plotted in Figure 8 and listed in Table 4. Similar to the findings from NT1, the results from NT2 verify that the modified LRM can offer the most accurate solution.
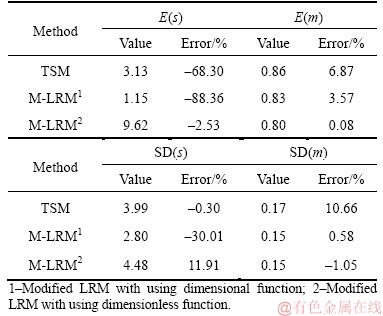
The shear strength analysis results for the stratified clay (NT3) are plotted in Figure 9 and listed in Table 5. In this problem, moment method does not work and is not applied. Referring to Table 5, the modified LRM with using dimensional function can only offer accurate estimation of slope, but failed to estimate an accurate interception. The modified LRM dimensionless function can offer both accurate slope and interception. That��s to say, dimensionless function will lead to much more accurate estimation. Again, the performance of modified LRM is better than that of three sigma rule.
Table 2 Summary of numerical test settings
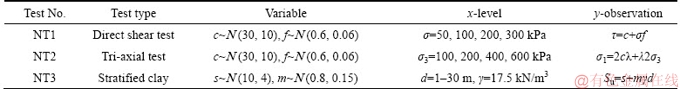
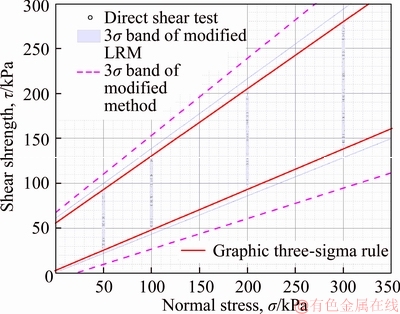
Figure 7 Modified LRM for shear strength analysis of direct shear test data (NT1)
Table 3 Shear strength analysis for NT1
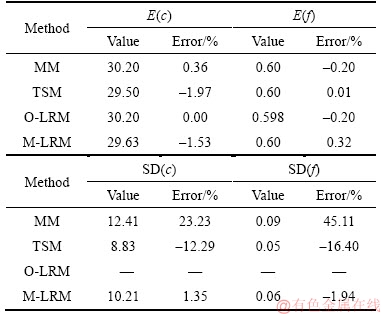
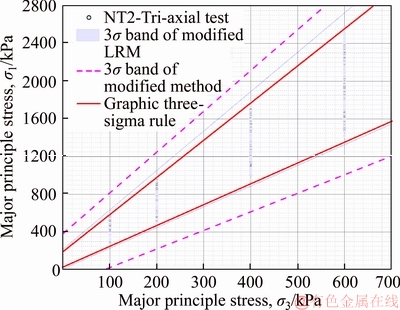
Figure 8 Modified LRM for shear strength analysis of tri-axial test data (NT2)
Table 4 Shear strength analysis for NT2
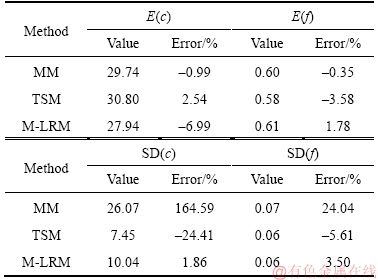
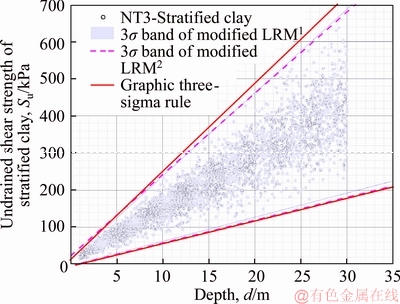
Figure 9 Modified LRM for undrained shear strength analysis of stratified clay (NT3)
Table 5 Shear strength analysis for NT3 (s is cohesion at ground surface, m is the gradient of shear strength, as referring to the formula in Table 2)
5.3 Comments on shear strength analysis method
Based on the upper results, it can be found that: 1) moment method will over-estimate the uncertainty of shear strength parameter and should not be used; 2) three-sigma rule is applicable to extract the shear strength parameter. However, its solution is not unique and depends on human judgment. Sometimes, three-sigma rule will under- estimate the uncertainty of shear strength parameter. 3) Original LRM can only offer the mean of shear strength parameter, and cannot be used to estimate the variance. 4) Comparing to other three methods, modified LRM can lead to much more accurate estimation to the mean and variance. 5) The dimensionless formula, such as Eq.(6) or Eq.(7), should be used in LRM or modified LRM.
6 Discussion
6.1 Prediction of shear strength
Once the variance and correlation coefficient of c and f are obtained, the variance of shear strength at given normal stress p can be predicted as
 (19)
(19)
where V(��f) is the variance of shear strength ��f. In geotechnical design, the soil shear strength is calculated as:
 (20)
(20)
where ck and ��k are the nominal values of cohesion and friction angle and often determined by using a fractile ratio t, as:
 (21)
(21)
where  and
and  are the inverse function of the cumulative probability function for c and ��; t is the fractile ratio specified in a given design code and is used as 0.1. The variances and correlation coefficients listed in Table 1 are used to estimate the shear strength. The standard derivations of ��f from different methods are depicted in Figure 10(a) and soil shear strength for geotechnical design is plotted in Figure 10(b).
The following phenomena can be found in Figure 10:
1) A little difference of V(f) will induce significant difference of shear strength, especially in the condition that soil is under high level of confining pressure.
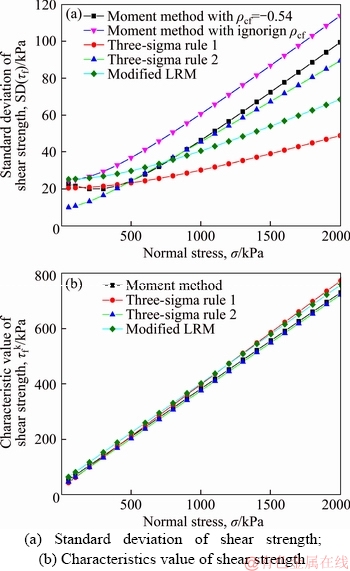
Figure 10 Shear strength prediction with different methods:
2) Smaller standard uncertainty of shear strength is obtained if the negative correlation coefficient ��cf is considered. That is to say, the ignorance of negative correlation coefficient, which is often happened in engineering practice or design code (Eq. (20)), leads to a conservative design value of shear strength.
3) Different solution of three-sigma rule may lead to prediction of shear strength with huge difference. The fact that the solution of three-sigma rule for multi-variable problem is not unique is really an essential disadvantage of this method.
6.2 Model uncertainty
In the tri-axial tests of clay from the core wall in Xiaolangdi dam, the stress failure envelop of soil may be actually non-linear [30]. When Mohr Coulomb model is applied, model uncertainty exists and affects the CV of c or f. If only the tri-axial test data with ��3 smaller than ��3,up is used, the mean and variance of c and f may be different. Here, ��3,up represents the upper bound of the confining pressure. Varying ��3,up and selecting data set with the condition of ��3�ܦ�3,up, the means and CVs calculated are listed in Table 6 and depicted in Figure 11. It can be found that with the increase of ��3,up, the mean of friction angle decreases whereas the mean of cohesion increases. In Table 6, the CV of c is always larger than that of f, which is consistent with the observations in Refs. [14, 31�C33].
Table 6 Regression results varying with ��3,up in case study
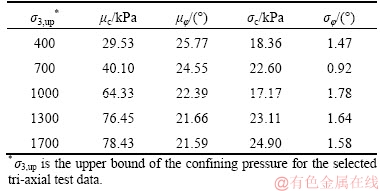
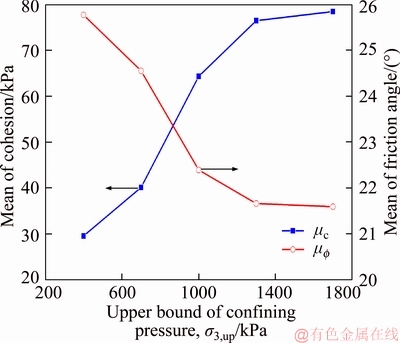
Figure 11 Regression results affected by upper bound of confining pressure of selected samples
7 Conclusion remarks
The moment method, three-sigma rule and LRM are used to analyze the tri-axial test data in XLDP and three numerical shear strength tests. The results demonstrate that:
1) A modified LRM is proposed to calculate the variances of regression parameters. It can offer the most accurate estimation to shear strength parameters. It is applicable to shear strength parameter analysis for tri-axial test data, direct shear test and the un-drained shear strength test of stratified clay.
2) A dimensionless formula is much preferred in LRM rather than a dimensional formula. The stress ratio formula is much better than stress relation in the shear strength parameter analysis.
References
[1] PHOON K K. Role of reliability calculations in geotechnical design [J]. Georisk, 2017, 11(1): 4�C21.
[2] PHOON K K, RETIEF J V, CHING J, DITHINDE M, SCHWECKEN-DIEK T, WANG Y, ZHANG L M. Some observations on ISO2394: 2015 Annex D (reliability of geotechnical structures) [J]. Structural Safety, 2016, 62: 24�C33. DOI: 10.1016/j.strusafe.2016.05.003.
[3] ZHANG J, WANG H, HUANG H W, CHEN L H. System reliability analysis of soil slopes stabilized with piles [J]. Engineering Geology, 2017, 229(7): 45�C52. DOI: doi.org/10.1016/j.enggeo.2017.09.009.
[4] KHALKHALI A, SARMADI M, YOUSEFI S. Reliability-based robust multi-objective optimization of a 5-DOF vehicle vibration model subjected to random road profiles [J]. Journal of Central South University, 2017, 24(1): 104�C113.
[5] CAO Z, WANG Y. Bayesian model comparison and characterization of undrained shear strength [J]. Journal of Geotechnical and Geoenvironmental Engineering, 2014, 140(6): 04014018. DOI: 10.1061/(ASCE)GT.1943-5606. 0001108.
[6] LI D Q, ZHANG L, TANG X S, ZHOU W, LI J H, ZHOU C B, PHOON K K. Bivariate distribution of shear strength parameters using copulas and its impact on geotechnical system reliability [J]. Computers and Geotechnics, 2015, 68: 184�C195. DOI: 10.1016/ j.compgeo.2015.04.002.
[7] ZHANG L M, TANG W H, ZHANG L L. ZHENG J G. Reducing uncertainty of prediction from empirical correlations [J]. Journal of Geotechnical and Geoenvironmental Engineering, 2004, 130(5): 526�C534. DOI: 10.1061/(ASCE)1090-0241(2004)130:5(526).
[8] ZHANG L L, ZHANG L M, TANG W H. Uncertainties of field pullout resistance of soil nails [J]. Journal of Geotechnical and Geoenvironmental Engineering, 2009, 135(7): 966�C972. DOI: 10.1061/(ASCE)GT.1943-5606. 0000014.
[9] ZHANG L L, ZHANG J, ZHANG L M, TANG W H. Back analysis of slope failure with Markov chain Monte Carlo simulation [J]. Computers and Geotechnics, 2010, 37(7): 905�C912. DOI: doi.org/10.1016/j.compgeo.2010.07.009.
[10] AL-NAQSHABANDY M S, LARSSON S. Effect of uncertainties of improved soil shear strength on the reliability of embankments [J]. Journal of Geotechnical and Geoenvironmental Engineering, 2013, 139(4): 619�C632. DOI: 10.1061/(ASCE)GT.1943-5606.0000798.
[11] ORR T L L. Defining and selecting characteristic values of geotechnical parameters for designs to Eurocode 7 [J]. Georisk: Assessment and Management of Risk for Engineered Systems and Geohazards, 2017, 11(1): 103�C115.
[12] NG I T, YUEN K V, DONG L. Estimation of undrained shear strength in moderately OC clays based on field vane test data [J]. Acta Geotechnica, 2017, 12(1): 145�C156. DOI: 10.1007/ s11440-016-0433-0.
[13] ZHANG S, DU H, HARBOR J. The effect of confining pressure and water content on compressive strength and deformation of ice-rich silty sand [J]. Permafrost and Periglacial Processes, 2017, 28(1): 298�C305. DOI: doi.org/ 10.1002/ppp.1906
[14] DUNCAN J M. Factors of safety and reliability in geotechnical engineering [J]. Journal of Geotechnical and Geoenvironmental Engineering, 2000, 126(4): 307�C316. DOI: 10.1061/(ASCE)1090-0241(2000)126:4(307).
[15] FOYE K C, SALGADO R, SCOTT B. Assessment of variable uncertainties for reliability-based design of foundations [J]. Journal of Geotechnical and Geoenviron- mental Engineering, 2006, 132(9): 1197�C1207. DOI: 10.1061/(ASCE)1090-0241(2006)132:9(1197).
[16] GAO Y, WANG Y H, SU C P. Mechanisms of aging-induced modulus changes in sand under isotropic and anisotropic loading [J]. Journal of Geotechnical and Geoenvironmental Engineering, 2006, 139(3): 470�C482. DOI: 10.1061/ (ASCE)GT.1943-5606.0000772.
[17] XIE Q. Report of digging and sampling experiment of cut-off wall of main dam of Xiaolangdi and comprehensive analysis of site detection results [R]. 2001. (in Chinese)
[18] WEISBERG S. Applied linear regression [M]. New Jersey: John Wiley & Sons, Inc., Hoboken, 2005.
[19] LINDLEY D V. Regression lines and the linear functional relationship [J]. Supplement to the Journal of the Royal Statistical Society, 1947, 9(2): 218�C244.
[20] PARADINE C G, RIVETT B H. Statistics for technologists [M]. London: English Universities Press Ltd. 1953.
[21] FISHER R A, YATES F. Statistical tables, for biological agricultural and medical research, [M]. 6th Edition. London: Oliver & Boyd, 1963.
[22] YAN X, SU X G. Linear regression analysis�CTheory and Computing [M]. Singapore: World Scientific Publishing Co. Pte. Ltd. 2009.
[23] LUMB P. The marine soils of Hong Kong and Macau [C]// Proceedings of the International Symposium on Soft Clay. Bangkok, Thailand, 1977: 45�C58.
[24] DNV/Norsk. Hydro technical report No. 2006-1437. guidance notes statistical representation of soil data [R]. 2006.
[25] MARK D M, CHURCH M. On the misuse of regression in earth science [J]. Mathematical Geology, 1977, 9(1): 63�C75.
[26] MANN C J. Misuses of linear regression in earth sciences [M]// Use and Abuse of Statistical Methods in the Earth Sciences. New York: Oxford University Press, 1987, 1: 74�C106.
[27] KENDALL M G, STUART A. The advanced theory of statistics, vol. 2 [M]. New York: Hafner, 1965.
[28] CHEN Li-hong, CHEN Zu-yu, LI Guang-xin. A modified linear regression method to estimate shear strength parameters [J]. Rock and Soil Mechanics, 2007, 28(7): 1421�C1426. (in Chinese)
[29] LUMB P. Safety factors and the probability distribution of soil strength [J]. Canadian geotechnical Journal, 1970, 7(3): 225�C242.
[30] CHEN L H, CHEN Z Y. Effect of nonlinear strength of rockfill on slope stability of high earth-rock dam [J]. Rock and Soil Mechanics, 2007, 9(28): 1807�C1810. (in Chinese)
[31] KULHAWY F H. On the evaluation of soil properties [J]. ASCE Geotechnical Special Publication, 1992, 31: 95�C115.
[32] PHOON K K, KULHAWY F H. Characterization of geotechnical variability [J]. Canadian Geotechnical Journal, 1999, 36: 612�C624. DOI: 10.1139/t99-038.
[33] CHING J Y, CHEN J R, YEH J Y, PHOON K K. Updating uncertainties in friction angles of clean sands [J]. Journal of Geotechnical and Geoenvironmental Engineering, 2012, 138(2): 217�C229. DOI: 10.1061/(ASCE)GT.1943-5606. 0000573.
(Edited by HE Yun-bin)
���ĵ���
����ǿ�Ȳ���ͳ�������ľ�ȷ���Ʒ���
ժҪ��ǿ�Ȳ����ľ��ȶ��������̵ijɱ��Ͱ�ȫ��������Ҫ�����ȣ����ĶԱ����������е�ǿ�Ȳ���ͳ���������㷽���ľ��ȡ��ڹ���ʵ���У����Իع��еľ�ֵ�����������Ϊǿ�Ȳ����ķ����ᵼ�ºܴ�������������һ�ָĽ������Իع鷽�������ܹ���ȷ����ǿ�Ȳ����ľ�ֵ�ͷ���Ľ������Իع鷽��������С�˵���ǽ�ӵĿ���ǿ�����ݷ���������������Ľ����Իع鷽���ܹ��ṩ�ȷ��ǿ�Ȳ������ƣ��������ٵĹ�ʽ�������Իع�Ч��Ҫ���������ٵĹ�ʽ����������ķ��������ܹ���������ǿ�����ݵķ�����������Ӧ����ֱ�����ݷ����Լ��ɲ�����IJ���ˮǿ�ȷ�����
�ؼ��ʣ����Իع飻����ǿ�Ȳ���������ʵ�飻�ɿ��ȷ��������ݷ�������ȷ����
Foundation item: Project(2017YFC0404803) supported by the National Key Research and Development Program of China; Project(51678040) supported by the National Natural Science Foundation of China; Project(8192034) supported by the Beijing Municipal Natural Science Foundation, China
Received date: 2018-01-12; Accepted date: 2018-10-23
Corresponding author: LI Xu, PhD, Professor; Tel: +86-10-51683902; E-mail: ceXuLi2012@gmail.com; ORCID: 0000-0002-0133-0795
Abstract: The cost and safety of geotechnical engineering are highly depending on the accuracy of soil shear strength parameters. There are three methods often used to estimate soil shear strength parameters, i.e., moment method, 3-sigma rule and linear regression method. In this study, the accuracy of these three methods is compared. Traditional linear regression method (LRM) can only offer the mean of shear strength parameters. Some engineers misuse the standard error of shear strength indexes as the standard deviations. Such misuse may highly underestimate the uncertainty and induce high risk to the geotechnical design. A modified LRM is proposed to determine both the mean and variance of shear strength parameters. The moment method, three-sigma rule and LRM are used to analyze the tri-axial test data in Xiaolangdi Hydraulic Project and three numerical shear strength tests. The results demonstrate that: 1) The modified LRM can offer the most accurate estimation to shear strength parameters; 2) A dimensionless formula is much preferred in LRM rather than a dimensional formula. The stress ratio formula is much better than stress relation in the shear strength parameter analysis. The proposed method is applicable to shear strength parameter analysis for tri-axial test data, direct shear test and the un-drained shear strength test of stratified clay.
