

J. Cent. South Univ. (2019) 26: 1874-1885
DOI: https://doi.org/10.1007/s11771-019-4141-4

A framework for train derailment risk analysis
CHUNG Ming-hwa(������)1, CHANG Che-hao(���ܺ�)2, CHANG Kuan-yuan(�ſ���)2,
WU Yu-shiang(������)3, GAO Shih-feng(��ʿ��)4, SHEN Zhe-ping(����ƽ)2, 4
1. Graduate Institution of Engineering Technology-doctoral, National Taipei University of Technology, Taipei, China;
2. Department of Civil Engineering, National Taipei University of Technology, Taipei, China;
3. Department of Mechanical Engineering, China University of Science and Technology Taipei, China;
4. Department of Construction and Spatial Design, Tungnan University, New Taipei, China
 Central South University Press and Springer-Verlag GmbH Germany, part of Springer Nature 2019
Abstract:
This study aims to develop a framework based on the Nadal formula to assess train derailment risk. Monte Carlo simulation was adopted to develop 10000 sets of random parameters to assess train derailment risk subject to the curvature radius of the track, the difference between the flange angle and the equivalent conicity, and accelerations from 250 to 989.22 gal during horizontal earthquake. The results indicated that railway in Taiwan, China has no derailment risk under normal conditions. However, when earthquakes occur, the derailment risk increases with the unloading factor which is caused by seismic force. The results also show that equivalent conicity increases derailment risk; as a result, equivalent conicity should be listed as one of maintenance priorities. In addition, among all train derailment factors, flange angle, equivalent conicity and unload factors are the most significant ones.
Key words:
derailment; performance; flange angle; equivalent conicity; reliability; risk; earthquake��
Cite this article as:
CHUNG Ming-hwa, CHANG Che-hao, CHANG Kuan-yuan, WU Yu-shiang, GAO Shih-feng, SHEN Zhe-ping. A framework for train derailment risk analysis [J]. Journal of Central South University, 2019, 26(7): 1874-1885.
DOI:https://dx.doi.org/https://doi.org/10.1007/s11771-019-4141-41 Introduction
Numerous train derailments have occurred in recent years; for instance, on March 8, 2000, the Hibiya Line in Tokyo, Japan derailed because of wheel load imbalance as the train entered a station at a slow speed while traversing an S-curve. On January 31, 2003, a driver lost control of a train in the Waterfall rail accident in Australia. On October 23, 2004, the J��etsu Shinkansen derailed in Japan during the Ch��etsu earthquake, causing J��etsu Shinkansen disruption. On April 25, 2005, the Fukuchiyama Line in Japan derailed because a late driver increased the travel speed to remain on time. On March 4, 2010, a Taiwan High Speed Rail (THSR) train derailed at north of Tainan station because of the Kaohsiung Jiasian earthquake, affecting the whole line��s operation. On July 25, 2013, a high-speed train derailed in Spain because the driver exceeded safe speed limits. On December 1, 2013 in New York, a passenger train derailed in the United States when traversing a curve.
Rail transport in Taiwan, which has been developed for more than 100 years, is crucial for the transport of goods and passengers, especially for Eastern Taiwan. Moreover, because Taiwan is located on the Circum-Pacific Seismic Zone, it is at strong risk for seismic activity. Thus, additional attention must be paid to consider the effect of seismic forces on train derailment [1]. Unfortunately, early track design in Taiwan did not rigorously consider seismic risks. However, in the aftermath of the 1991 Chi-Chi earthquake which resulted in severe damage to Taiwan (3276 people were killed and 12053 were injured; the peak ground acceleration (PGA) in the Taichung area was 200 gal-400 gal, and at the epicenter, exceeded 600 gal), people began to consider all aspects of the potential threats of earthquakes, and develop a Taiwan disaster evaluation and a financial analytical model in response to earthquake disasters to assess seismic risks [2].
As derailments influence rail operations and may even lead to casualties, various methods are proposed by scholars to minimize the derailment risk. NADAL [3] proposed the Nadal limit to assess the risk of derailments [4-11], based on the mechanical equilibrium between the wheels of a train and the track, as the coefficient of sliding friction between the wheels and the track accounts for this force [10, 12]. In addition, certain scholars have used sensors to measure the force acting on the train wheels, or set up a test track to measure the characteristics of tracks in order to assess the risk of derailment [10, 13]. Moreover, numerical models of train derailment have been developed to calculate derailment risk and derailment coefficient can be used to evaluate rail safety before the operation of new trains [14]. An earthquake warning system can also integrate the derailment coefficient to issue early alerts to drivers to stop the train before the S waves reach the alert area [15-17], reducing derailment risk during natural disasters.
The source of vertical force between wheels and rails comes from the weight of the vehicle. The sources of horizontal force are more diverse as the sources include centrifugal force resulted from the vehicle passing on curves as well as wind force and earthquake force.
In order to obtain data of horizontal force and vertical force at the contact point of the wheel and the rail at the instant of derailment, some researches use continuous method or discontinuous method to measure wheel deformation [14] or the wheel and rail wear [18] to estimate horizontal force and vertical force. Only after a careful comparison can allow track engineers to apply the learning from the measurement data corresponding to the tracks alignment to maintenance. In addition, the measured data are representative only after many measurements on many different types of trains. Some studies set up test track to conduct dynamic tests to evaluate the derailment safety [19]. It is not economical to setup test tracks for a small scale of railway network, for the data were not obtained from the moment of the derailment occurred but a result of no actual occurrence of derailment. Moreover, the obtained data only represents the data where the instrument was set, not the data of whole railway network. Studies have also established a mathematical model [1, 12, 18, 19] to derive the horizontal and vertical forces.
Horizontal force and the vertical force acting between the rail and wheel will be affected and changed by wheel and rail wear. Thus, the degree of wheel and rail wear measured from track measurement vehicle should be included in the analysis according to the study of MOHAMMADZADEHA et al [18].
This study therefore included the data of applied cant and gauge variation measured from track measurement vehicle EM-80 in the analysis. The measurement data showed that among derailments caused by uneven rail, gauge was changed as a result of a long-time operated vehicle causing a flowed rail head, wheel burn, gauge corner shelling and rail running surface shelling. When road bed was weakened and subsided or track bed was compressed, the track deformation will form as a result. For a single track cross section, the applied cant will incur changes, causing uncertainty in gauge and applied cant and affecting the distribution of horizontal and vertical force. If the horizontal force changes as a result of a change in gauge and applied cant, the vertical force needs to be re-distributed. Therefore, gauge and applied cant were included as the uncertainty factor of derailment risk. Also, according to Nadal formula, besides the horizontal force and vertical force, there are two other parameters, the flange angle �� and the friction coefficient ��. Since the data of horizontal force and vertical force distribution are different if the flange angle is different, this study found that the flange angel was the focus point of inspection, according to the TRA vehicle inspection data, and thus included flange angle in the analysis of derailment risk factors. At the same time, researches on derailment tend to focus on the contact point between wheels and rails, thus this study refers to the research by MOHAMMADZADEH et al [18], which shows that according to UIC code 519, for worn wheels, flange angle should be replaced by equivalent conicity. Besides, over usage of vehicles will lead to uncertainty caused by wearing of the flange and surface of wheels, as well as by change of quality of flange angle or equivalent conicity. Consequently, this study includes flange angle or equivalent conicity as factors of uncertainty of derailment risk. Analysis shows that equivalent conicity ��ec is an important parameter affecting derailment. To avoid including too many variables, this study will define friction coefficient as a constant. With the considerations above, this study aims to construct an evaluation framework that includes factors of vehicle evaluation, rail evaluation, and external force condition (winds and earthquakes) evaluation. Some recent studies from the international association for vehicle system dynamics (IAVSD) shows that future requirement for safety standard may include derailment caused by winds and earthquakes [19]. According to analysis, derailment will not happen in TRA route under normal operation and maintenance condition. However, cases show that other railroad systems encounter derailment under the condition of impact from earthquakes. At the same time, according researches by CHENG et al [20] study of derailment should include wind force. Thus, this study includes force of winds and force of earthquakes as parameters of external forces that impact the risk of derailment. The force of winds is calculated as a constant of the average amount.
2 Derivation of performance function on derailment risk
The risk of train derailment must be considered in train operation to ensure a normal operation and safety of passenger. Derailments typically occur on curves because of imbalance between the centrifugal force and the force from the wheel and the track. During normal operation, factors attributing to derailment include the speed and flange angle of the train, the curvature radius, the maintenance conditions of the track (such as the track level and the irregularity of the track gauge), and external forces, such as wind pressure. When natural disasters such as earthquakes and typhoons occur, additional external forces act on the train and the coefficient of sliding friction of rail is changed by the external environment. These factors must be considered as well. In this study, the Nadal equation [3] is extendedly applied with the dynamic behavior of transverse and vertical forces on the train and track at the instant of train derailment to determine the risk of train derailment, taking into account of the maintenance conditions of the track and the wheels.
This study divided factors attributing to train derailment into vehicle factor, track factor, and external force (wind and seismic forces) factor. Since real-time measurement of the vehicle factors and rail conditions is prohibitively expensive, this study used the evaluation parameters of relevant studies and historic track maintenance data of a section of the Taiwan Railway Administration (TRA) near Taichung, in Central Taiwan, to investigate the influence of seismic forces on derailment risk. A Monte Carlo method [21] was adopted under various operational and seismic conditions to simulate 10000 sets of samples for analysis to calculate the derailment risk in Taiwan central area and to discuss possible solutions.
Because of the nature of uncertainty inherited in derailment risk, trains and tracks are considered rigid bodies [12] and internal forces acting on the chassis and suspension system (including resonance) are not considered for simplifying the analysis. When the wheels or the track are not properly maintained and have been worn to a level that is no longer safe, and the train is traveling at a higher speed while traversing a curve, this results in derailment risk. The mechanical behavior of a train traveling on a curve was used in this study to investigate the flange climbing derailment risk when one of the four wheels of a vehicle derails. After analysis, outer wheels are proven to be easier to derail than inner wheels are. Hence, in this study the outer wheels are analyzed.
This study analyzed flange climbing derailment risk when trains pass circular curves by investigating the static force distribution at the moment of derailment, assuming that all forces acted on the center of gravity of the train for simplifying the model. Furthermore, derailments typically begin with a single derailed wheel which causes the other wheels to derail subsequently. Thus, the outer wheels of a single cross-section axle were independently analyzed. The influence of the vertical profile, direction, and irregular twist of the track were neglected.
In the study of derailment, most related researches are based on the Nadal formula Eq. (1). This formula analyzes the ratio between the horizontal force Q and vertical force Y at the contacting point between the wheel and rail.
 (1)
(1)
where �� is flange angle (��); �� is friction coefficient.
Because the flange angle �� will wear after wheel running for a period of time, and the friction coefficient �� will changed by environment; therefore, these two parameters should be included to assess the system performance. As a result,Eq. (1) was modified to Eq. (2).
 (2)
(2)
where f is a safety index of the system if f<0. On the contrary, f ��0 stands for the derailment of the system. Therefore, the reliability of an integrated system including vehicle, wheels, and rails simultaneously is demonstrated by the performance function f.
The horizontal force Q is applied by the centrifugal force when the vehicle is running on a curve. From the viewpoint of system safety, especially in Taiwan, some external forces are needed to be considered like wind and seismic due to natural hazards of typhoons and earthquakes. Hence, the horizontal force is derived as Eq. (3).
 (3)
(3)
where Q0 is centrifugal force of outer rail (kN); Qwind is wind force distributed to the outer rail (kN); and Qs is seismic force (kN).
The vertical force includes wheel load, wheel unload, and the change of the vertical load caused by unbalance centrifugal force. Hence, the vertical force Y is derived in Eq. (4).
 (4)
(4)
where Y0 is wheel load (kN); Yh is the wheel unload caused by hunting behave (kN); ��Y is the force caused by unbalanced centrifugal force (kN).
When the vehicle is running on the curve with balanced cant, the horizontal force of the centrifugal force Q0 caused by the vehicle is evenly distributed on the rail head of the two rails (Eq. (5)).
 (5)
(5)
where F0 is centrifugal force applied to axle (kN), W0 is axle load (t); V0 is design speed (km/h); R is radius (m); and the number 1/3.6 is a unit converting factor.
For the wind force, this research considers the average wind force. Its formula is illustrated in Eq. (6). The wind force acts on vehicle is evenly distributed by 8 sets of wheels.
 (6)
(6)
where Qwind is wind force on wheel (kN); Fwind is wind force on vehicle (kN). The wind force applied on vehicle is illustrated in Eq. (7).
 (7)
(7)
The earthquake force is illustrated in Eq. (8). The earthquake force impacts the rail directly from the surface of the earth.
 (8)
(8)
where PGA is peak ground acceleration (cm/s2); �� is the seismic force amplification factor.
For the vertical forces, the axle load will be distributed to two railheads, then wheel load is illustrated in Eq. (9).
 (9)
(9)
where g is acceleration of gravity (m/s2).
When the vehicle is running on the track, the hunting behavior always exists. The wheel unload caused by hunting is illustrated in Eq. (10).
 (10)
(10)
where �� is the wheel unload factor of the outer wheel, representing the natural hunting.
When the vehicle is running at the designed-speed V0 on the curve with applied cant, because applied cant is lower than balanced cant, and then the vertical force changed at the railhead will be redistributed based on the balance of the force. The change in vertical force is illustrated in Eq. (11).
 (11)
(11)
where Ca is applied cant (mm); HG is center of gravity high (mm); G is gauge (mm).
Therefore, performance function f can be derived as Eq. (12).


 (12)
(12)
3 Uncertainty risk analysis of train derailment
3.1 Vehicle evaluation factors
The train model considered in this study was the EMU-500 commuter train, used by the TRA. The flange complementary angle �� data were derived from wear and maintenance data provided by the TRA. Figure 1 shows the relationship between the flange complementary angle, flange angle and equivalent conicity. As shown in Figure 2, the complementary angle data of TRA between 2002 and 2012, the standard deviation was 1.246, the range was 19��-25��, and the average angle was 21.258��. Subsequently, the average of the flange angle was calculated to be 68.742��. This average was consistent with the expected value of 68��, proposed by MOHAMMADZADEH et al [21] for the Iranian rail transportation system. MOHAMMADZADEH et al [21] also proposed to replace the flange angle in Eq. (1) with equivalent conicity (The expected value of the equivalent conicity is 1.381 rad in normal distribution and the standard deviation is 0.075) Because data regarding equivalent conicity were not available from the TRA and the manual measuring error of on-site measurement in this study is up to 10 cm which resulted in a greater measurement error of calculated equivalent conicity, the Iranian figures regarding equivalent conicity determined by MOHAMMADZADEH et al [21] were considered when constructing the parameters in this study. Based on a study on train unloading and derailment by UCHIDA et al [12], this study adopted a wheel unload factor and conducted analyses using fixed values at 0.1 [2] and 0.4 [1].
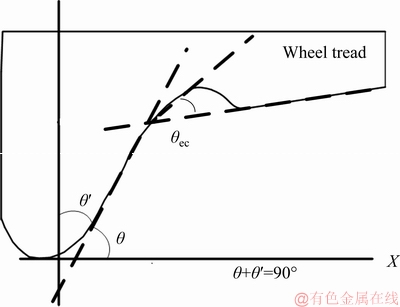
Figure 1 Relationship between flange angle �� and TRA flange complementary angle �ȡ� and equivalent conicity ��ec
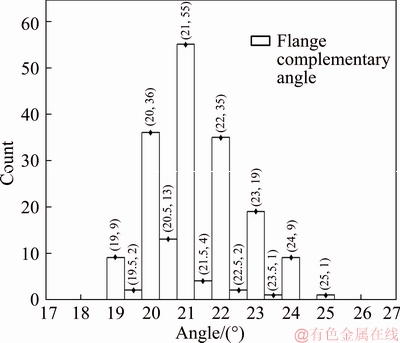
Figure 2 Measurements of flange complementary angle of EMU-500 commuter train, 2002�C2012
3.2 Rail evaluation factors
The safety of train operation is dependent on the proper maintenance of tracks. The factors contributing to train derailment are gauge irregularity, track irregularity (vertical track profile irregularity, twist irregularity, direction irregularity, and level irregularity), track wear, and the wetness of the track. The track radius affects the centrifugal force acting on the train. For the track, requirement for safety concern factors were looser than passenger and crew comfort. Passengers�� tolerance of lateral acceleration accounted for the passenger and crew comfort evaluation factor. The safety evaluation factor was accounted by the deviation of the train influenced by the sum of centrifugal force and gravity, resulting from the cant deficiency as a train traverses a curve.
A 600 m radius curved section of the TRA near Taichung was studied. Measurements of track maintenance of the gauge variation (Figure 3) and cant (Figure 4) from 2006-2013 were used as parameter factors for track system. The in-situ measurements with respect to the specific curve section are recorded at the locations from 195k+960 to 196k+090 for consecutive years shown in Figures 3 and 4.In 2010 and 2012, no measurements were taken.
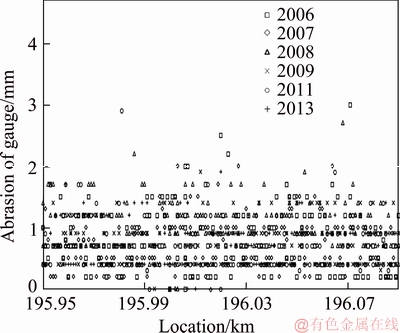
Figure 3 2006-2013 gauge variation measurement in research area
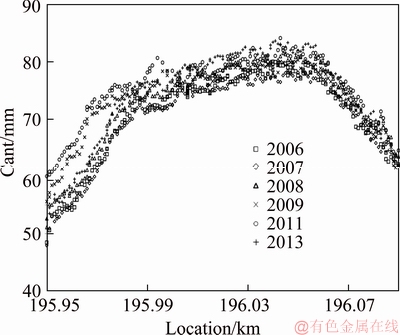
Figure 4 2006-2013 cant measurement in research area
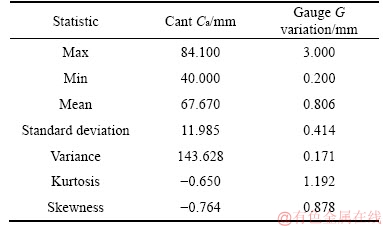
The TRA historical statistical maintenance values for the research area are shown in Table 1. The cant measurements ranged from 84.100 to 52.000 mm, and the average was 67.670 mm; these figures were higher than those for the design value of the applied cant. In practical construction, design tended to be conservative to increase the safety of passing a curve. In gauge variation, if the 0 value was neglected, the values ranged from 3 to 0.2, and the 0 value appeared occasionally probably because of measuring errors. The average was 0.806 mm, the standard deviation was 0.414, and the gauge variation was controlled at 1.5 mm, which indicated a superior maintenance quality. The TRA track maintenance team conduct maintenance based on the guideline of ensuring passenger and crew comfort. In the analyzed track section, measurement values based on the maintenance data were mostly within the legal tolerance.
Table 1 TRA maintenance data statistics for study area
3.3 External force evaluation factors
Compared with other areas, Taiwan suffered from more than three kinds of natural disaster. Because modern meteorology can forecast the scale and path of typhoons, winds forces resulting from typhoons were excluded in this study. Given the research area in this study is located in Central Taiwan, the average wind speed in Central Taiwan was regarded as a constant force acting on the train, and only a worst-case scenario was considered in our analysis. Using a wind power database provided by National Central University, Taiwan, China (2013), the average wind speed of the target area between 1996 and 2000 was 1.78 m/s.
The Chi-Chi earthquake struck Central Taiwan, China at 1:47 am on September 21, 1999, and measured 7.3 on the Richter scale. No derailments occurred because most passenger trains were not running at that time. However, at 8:18 am on March 4, 2010, the Kaohsiung Jiasian earthquake struck Southern Taiwan. The earthquake occurred at rush hour and resulted in the derailment of the THSR 110 train, which was traveling northbound. The derailment severely affected north-south bound traffic. Thus, the possibility of derailment during an earthquake was evaluated in this study.
The PGA of the Chi-Chi earthquake was obtained based on ground measurements taken at Sun Moon Lake Weather Station (TCU084). The east-west PGA was measured to be 989.22 gal. The study was tested starting at 250 gal, then at 400 gal and increasing at 100 gal interval. The seismic risk enduring capacity with PGAs of 250, 400, 500, 600, 700, 800, 900 and 989.22 gal were calculated. Based on the seismic design specifications for the rail, bridge, and tunnel specified by the Ministry of Transportation and Communications, Taiwan, the seismic force amplification factor �� in the at-grade and tunnel sections was determined to be 1, and that in the viaduct section was 1.478. Seismic force was presumed to act on the track directly.
3.4 Risk analysis of train derailment
Vehicle, rail, and external force factors were all found to relate to train derailment shown by the performance function of Eq. (12). By Figures 2-4 and Table 1, there are uncertainties existing for those parameters that cannot be ignored. The study proposed a risk analysis framework of derailment to evaluate the impact brought by uncertainty parameters.
Some of the model parameters in Eq. (12) changed with maintenances would be considered stochastic ones. Table 2 listed 4 stochastic parameters like Ca and G related to rail as well as �� and ��ec related to vehicle which random characteristics are discussed in Sections 3.1 and 3.2.
Table 2 Train derailment analytical parameters
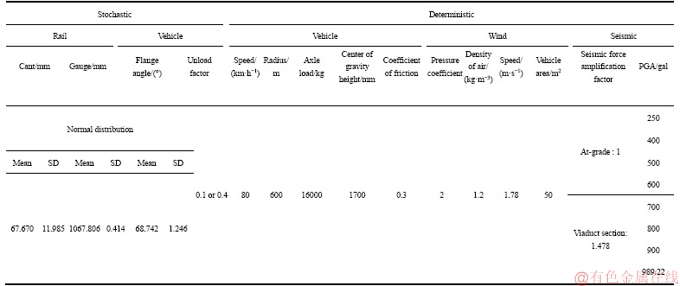
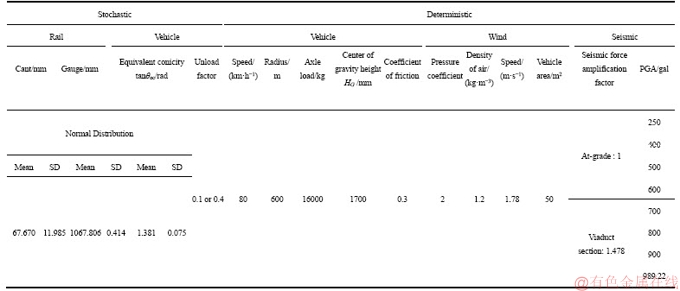
Table 3 Train derailment analytical parameters (�� replaced by ��ec)
The other model parameters without significant change were treated as deterministic in Table 2. There were three classifications for deterministic parameters including vehicle, wind, and seismic. For the impacts brought by seismic, 8 scenarios were considered respectively in this research shown in Table 2.
Speed, flange angle, and equivalent conicity were the vehicle parameters. Cant, gauge, and radius were the rail parameters. Friction coefficients between wheel and rail, unload factors of the train and rail systems, and external force parameter such as wind speed and seismic force are all summarized in Table 2. Wind speed and seismic force were the external force parameters. Certain parameters were fixed, for example, train speed when passing a curve. The friction coefficient was fixed between 0.13 and 0.6, the expected value was fixed at 0.3 [18]. According to the studies by XIAO et al [1], the vertical vibrations during an earthquake, along with the horizontal vibration, can cause wheel unloading and result in the derailment. This study uses an unload factor of 0.1 to 0.4 [22], and wind speed was fixed at the 5-year average wind speed of the study area. The seismic force amplification factor was modified based on the conditions of the at-grade and viaduct sections. The averages and standard deviations of the other factors were obtained from the historical statistical data. A Monte Carlo method was used to randomly sample 10000 sets to determine the effect of the derailment risk factors in the study area. Design conditions and the normal distribution over a long period of observation were considered for every factor. Multiple simulations were conducted to obtain derailment risks in various study scenarios.
4 Simulation results and discussion
A train derailment risk analysis was performed based on historical maintenance data of Taichung section. The analysis calculated the Taichung section��s capacity to endure the earthquake risks at 250, 400, 500, 600, 700, 800, 900 and 989.22 gal when a train is passing by. The results are listed on the figures from left to right. The simulated trend is presented in the accumulative percentage curves. The rail safety under particular seismic force and operational conditions was evaluated using the performance function, as shown in Figures 5-12. The derailment risk was derived by calculating the curve areas of the performance function with values equal to or larger than 0. Curve areas of the performance function with values smaller than 0 signified operational safety.
4.1 Train derailment simulation
The average flange angle and standard deviation were calculated based on TRA flange complementary angle statistical data from 2000-2012. Various seismic forces acting on the at-grade and viaduct sections were simulated in 10000 sets, using measurements of the applied cant and gauge of the study area from 2006 to 2013, and unload factor values of 0.1 and 0.4. As shown in Figures 5-8, the seismic force amplification factor in the at-grade section was 1, and that in the viaduct section was 1.478.
As shown in Figure 5, the performance function was entirely less than 0, signifying safe operation. As shown in Figure 6, an earthquake of 500 gal facilitated a performance function that was, in places, greater than 0, signifying 50% possibility of derailment. As shown in Figure 7, an earthquake of 800 gal facilitated a performance function that was, in places, greater than 0, signifying a possibility of derailment. Figure 8 shows that an earthquake of 400 gal facilitated a performance function that was, in places, greater than 0, signifying a possibility of derailment.
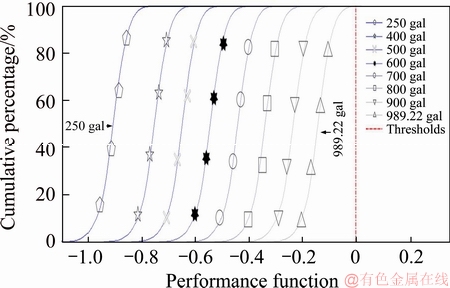
Figure 5 Derailment risk of flange climbing derailment at a seismic force amplification factor of 1 and unload factor of 0.1
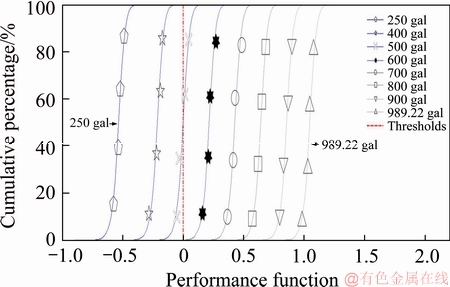
Figure 6 Derailment risk of flange climbing derailment at seismic force amplification factor of 1 and unload factor of 0.4
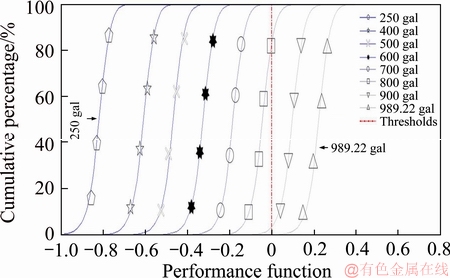
Figure 7 Derailment risk of flange climbing derailment at seismic force amplification factor of 1.478 and unload factor of 0.1
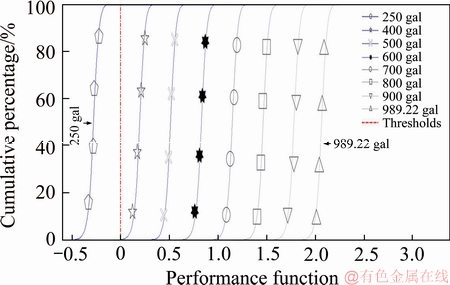
Figure 8 Derailment risk of flange climbing derailment at seismic force amplification factor of 1.478 and unload factor of 0.4
4.2 Simulating derailment using equivalent conicity to replace flange angle
When train wheels run on a track, the wheel tread comes into contact with the rail tread where tread wear frequently consequently appears. Flange complementary angle data of the TRA wheel wear and maintenance were analyzed, and the results indicated that track flanges were rarely worn, and the deviation of the flange angles was extremely small. However, data from the Iranian railway network [18] indicated that the wear of equivalent conicity was relatively severe, and that equivalent conicity should be included in the evaluation criteria. Based on their work, equivalent conicity was used to replace the flange angle in this study, and the statistical values of equivalent conicity determined by the Iranian study were used as a substitute for Taiwanese flange complementary data. The differences were compared, and derailment risks under seismic conditions in the at-grade and viaduct track sections were calculated. The results are shown in Figures 9-12.
Figure 9 shows that an earthquake of 600 gal facilitated a performance function that was in places greater than 0, signifying a risk of derailment.
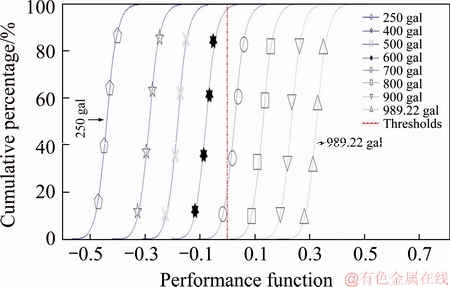
Figure 9 Derailment risk of flange climbing derailment at seismic force amplification factor of 1 and unload factor of 0.1
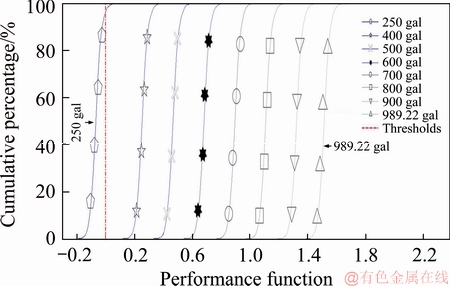
Figure 10 Derailment risk of flange climbing derailment at seismic force amplification factor of 1 and unload factor of 0.4

Figure 11 Derailment risk of flange climbing derailment at seismic force amplification factor of 1.478 and unload factor of 0.1
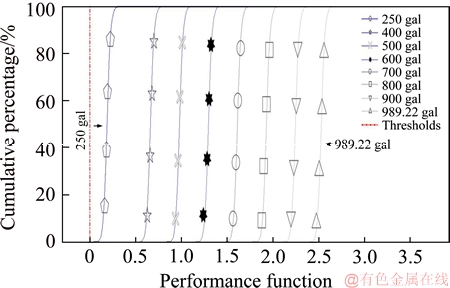
Figure 12 Derailment risk of flange climbing derailment at seismic force amplification factor of 1.478 and unload factor of 0.4
Figure 10 shows that an earthquake of 250 gal facilitated a performance function greater than 0, signifying a risk of derailment. Figure 11 shows that an earthquake of 400 gal facilitated a performance function that was in places greater than 0, signifying a risk of derailment. Figure 12 shows that an earthquake of 250 gal facilitated a performance function 250 gal that was in places greater than 0, signifying a risk of derailment.
4.3 Discussion and analysis
As shown in Figures 5 and 6, based on the TRA maintenance data of normal conditions, the unload factor in the at-grade section was 0.1 and no flange climbing derailment risk was present. At an unload factor of 0.4 and a seismic force greater than 500 gal, the reliability of flange climbing derailment was lower than 50.79%. The results indicated that the unload factor is a crucial factor in flange climbing derailment. Figures 7 and 8 show that when the unload factor in the viaduct section was 0.1 and the seismic force was greater than 800 gal, the reliability of flange climbing derailment was below 83.52%. On the other hand, at an unload factor of 0.4 and a seismic force of 400 gal, the reliability was 0%.
As shown in Figures 5 and 7, the simulation results with the normal TRA maintenance data and flange angle, when the unload factor in the at-grade section was 0.1 and the seismic force was 989.22 gal, there is no a derailment risk. If the unload factor in the viaduct section is 0.1 and the seismic forces are 700, 800 and 900 gal, the reliability of flange climbing derailment are 99.98%, 83.53% and 3.43%, respectively. As shown in Figure 8, if the unload factor in the viaduct section is 0.4 and the seismic force is 400 gal, and the reliability of flange climbing derailment decreases to 0%. The results indicated that the flange climbing derailment risk in the viaduct section was higher than that in the at-grade section because of the amplification of seismic force.
As shown in Figures 5 and 9, the simulation results revealed that no flange climbing derailment risk exists under normal conditions based on the TRA rail maintenance data and flange angles in the at-grade section, with an unload factor of 0.1 and the seismic force of 989.22 gal. However, when the equivalent conicity of the Iranian railway network was used to replace the TRA flange angle data, at increased seismic forces of 600 and 700 gal, the reliabilities of flange climbing derailment were 97.87% and 70.70%, respectively. Moreover, as shown in Figure 6, substituting the TRA flange angle with the equivalent conicity from the Iranian railway network with an unload factor of 0.4, the reliability of flange climbing derailment in the at-grade section at seismic forces of 250 and 400 gal were below 96.51% and 0%, respectively. These results indicated that, in addition to unload factor as an important factor for flange climbing derailment, replacing the TRA flange angle with equivalent conicity can cause a higher risk of flange climbing derailment. Therefore, equivalent conicity should be also a key inspection item in normal maintenance.
As shown in Figures 11 and 12, using normal TRA track maintenance data, the simulation results revealed that the reliability of flange climbing derailment was 99.98% when the unload factor in the viaduct section was 0.1 and the seismic force was 400 gal. At an unload factor of 0.4, the simulation results revealed that derailment occurred at a seismic force of 250 gal. This underscores the fact that the unload factor is a crucial factor contributing to flange climbing derailment risk.
In addition, compared Figure 8 with Figure 12, where the TRA flange angle is substituted with the equivalent conicity and the unload factor is 0.4, flange climbing derailment occurs in the viaduct section at a seismic force of merely 250 gal. During an earthquake, horizontal acceleration may not arrive with vertical acceleration at the same time. Furthermore, a relationship between horizontal and vertical accelerations has not been established in seismic research. Nevertheless, seismic horizontal forces can also result in a greater unload condition after rapid, continuous horizontal shaking. Thus, an unload factor of 0.4 was adopted as reference to simulate the seismic vertical force exerted on a train during an earthquake.
5 Conclusions
The risk analysis results indicated that in the absence of external forces, such as earthquakes, when TRA trains operated normally in the at-grade and viaduct sections with an unload factor of 0.1, there was no risk of derailment. However, during an earthquake caused disaster, considering the fact that the seismic forces cause the unloading of wheels, the reliability is dropped. During an earthquake with an unload factor of 0.4 and a horizontal acceleration of less than 500 gal, the reliability of the train simulated in the at-grade section was below 50.79%. In the viaduct section, a horizontal acceleration of less than 250 gal, would not cause a derailment risk. However, a horizontal acceleration of above 400 gal presented a reliability of 0%. In the future, combining an earthquake warning system with a derailment warning system is necessary to avert derailments caused by massive earthquakes.
When the flange angle was replaced with equivalent conicity in calculating derailment risk, the reliability was below 97.87% in the at-grade section, at a seismic force of 600 gal, with an unload factor of 0.1. At a seismic force of less than 250 gal, with an unload factor of 0.4, the reliability of that section was below 96.51%. However, when an earthquake stronger than 400 gal occurred, the reliability was decreased to 0%. In the viaduct section, during an earthquake stronger than 400 gal, with an unload factor of 0.1, the reliability was lower than 99.98%. An earthquake of 500 gal, resulted in derailment. In addition, flange climbing derailment occurred when the viaduct section (unload factor was 0.4) merely experienced 250 gal. Overall, the simulated derailment risk increased when equivalent conicity was substituted for flange angle data. Equivalent conicity should be enlisted as a crucial maintenance item in the future.
Among all vehicle derailment risk factors, the flange angle, equivalent conicity, and unload factor considerably contributed to derailment. The unload factor differed under each train condition. Taking into consideration the flange angle and equivalent conicity can ensure safety in operations and maintenance, and routine maintenance of the flange angle and equivalent conicity can enhance the reliability of a railway network.
References
[1] Xiao Xin-biao, Ling Liang, Jin Xue-song. A study of the derailment mechanism of a high speed train due to an earthquake [J]. Vehicle System Dynamics: International Journal of Vehicle Mechanics and Mobility, 2011, 50(3): 449-470.
[2] Hsu W K, Chiang W L, Chen C W. Earthquake risk assessment and optimal risk management strategies for Hi-Tech Fabs in Taiwan [J]. Nat Hazards, 2012, 65(3): 2063-2076.
[3] NADAL M J. Th��orie de la stabilit�� des locomotives, Part 2: Mouvement de lacet [M]. Annls Mines, 1896. (in French)
[4] Masaki M. Quasi-static deraliment of a wheelset [J]. QR of RTRI, 1986, 27: 94-97.
[5] Yoshihiro S. Study of safety factor against derailment for rail vehicles [J]. Transactions of the Japan Society of Mechanical Engineers, 1991, 57, 542: 3164-3167.
[6] Cherchas D B. Derailment of railway wheel climb probability based on the derailment coefficient [J]. Journal of Franklin Institute, 1981, 312: 31-40.
[7] Cherchas D B, ENGLISH G W, MCILVEEN E R, SCHWIER C. Prediction of the probability of rail vehicle derailment during crossing collision [J]. Journal of Dynamic Systems, Measurement, and Control, Transactions of ASME, 1982, 104: 119-132.
[8] Weinstock H. Wheel climb derailment criteria for evaluation of rail vehicle safety [C]// Winter Annual Meeting of the American Society of Mechanical Engineers. 1984, 84-WA/RT-1.
[9] Masaki M, Hiroaki I. Safety criteria for evaluation of the railway vehicle derailment [J]. QR of RTRI, 1999, 40: 18-25.
[10] XIANG Jun, LI De-jian, ZENG Qing-yuan. Simulation of spatially coupling dynamic response of train-track time-variant system [J]. Journal of Central South University of Technology, 2003, 10(3): 226-230.
[11] XIANG Jun, HE Dan, ZENG Qing-yuan. Analysis theory of spatial vibration of high-speed train and slab track system [J]. Journal of Central South University of Technology, 2008, 15: 121-126.
[12] UCHIDA M, TAKA H, MURAMATSU H, ISHIDA H. Derailment safety evaluation by analytic equations [R]. World Congress on Railway Research, K ln, November 2001: 25-29.
[13] Lee S S, Lee J H, Park I K, Song S J, Choi M Y. A Study on the evaluation methods of running safety for railway vehicle [J]. Key Engineering Materials, 2006, 321-323: 1499-1502.
[14] Lee S S, Yoon D J, Lee J H, Lee S. Running safety estimation of korean style high speed railway vehicle [J]. Key Engineering Materials, 2004, 270-273: 1989-1994.
[15] Lin C C J, Lin P Y, Chang T M, Lin T K, Weng Y T, Chang K C, Tsai K C. Development of on-site earthquake early warning system for taiwan (Part I: Parametric analysis study) [C]// Dr Sebastiano D'Amico. Earthquake Research and Analysis-New Frontiers in Seismology. Croatia: InTech, 2012: 330-358.
[16] Lin C C J, Shen Z P. Application of neural networks on recent development of the earthquake early warning system for Taiwan [C]// Proceeding of the 9th US National and 10th Canadian Conference on Earthquake Engineering, (2010EQ Conf.). Toronto, Canada, 2010.
[17] Lin C C J, Shen Z P, Huang S K. Predicting structural response with on-site earthquake early warning system using neural networks [C]// Proceedings of the Ninth Pacific Conference on Earthquake Engineering Building. Auckland, New Zealand: Earthquake-Resilient Society, 2011.
[18] Mohammadzadeha S, Ghahremania S. Estimation of train derailment probability using rail profile alterations [J]. Structure and Infrastructure Engineering, Maintenance, Management, Life-Cycle Design and Performance, 2010, 8(11): 1034-1053.
[19] Nicholas W, Robert F, Matthew W, Andreas H, Mikael W, Jerry E, Anna O. Assessment of safety against derailment using simulations and vehicle acceptance tests: A worldwide comparison of state-of-the-art assessment methods [J]. Vehicle System Dynamics: International Journal of Vehicle Mechanics and Mobility. 2011, 49(7): 1113-1157.
[20] CHENG Y C, HUANG C H, KUO C M, CHEN C H. Derailment risk analysis of a tilting railway vehicle moving over irregular tracks under wind loads [J]. International Journal of Structural Stability and Dynamics, 2013, 13(8): 1350038.
[21] Metropolis N, Stanislaw U. The monte carlo method [J]. Journal of the American statistical association, 1949, 44(247): 335-341.
[22] XU Xiang-zheng. The derailment limit study about train [J]. Jouranl of Shandong University of Technology, 2006, 20(2): 24-25.
(Edited by HE Yun-bin)
���ĵ���
�г��ѹ���շ������
ժҪ�����о�ּ�ڽ���һ�������ɴ����ʽ���г��ѹ����������ܡ��������ؿ����淽����������10000�����������ģ�����ر����ٶ�Ϊ250~989.22 gal��ˮƽ��������������г��ѹ�����ܹ�����ʰ뾶����Ե�����ЧԲ�ȵIJ�ֵ��Ӱ�졣�����������·ϵͳ��������������ѹ���ա�Ȼ������������ʱ���ѹ�������ŵ����������ж�����ӵ���������������������Ч���������ѹ����;��ˣ�Ӧ����Ч����Ϊά���ص�֮һ�����⣬�������г��ѹ������У���Ե�ǡ���ЧԲ�Ⱥ�ж������������Ҫ�ġ�
�ؼ��ʣ����죻���ܣ���Ե�ǣ���Ч�ȣ��ɿ��ԣ����գ�����
Received date: 2014-03-16; Accepted date: 2014-06-03
Corresponding author: CHANG Che-hao, PhD, Associate Professor; Tel: +86-27712171-2665; E-mail: chchang@ntut.edu.tw
Abstract: This study aims to develop a framework based on the Nadal formula to assess train derailment risk. Monte Carlo simulation was adopted to develop 10000 sets of random parameters to assess train derailment risk subject to the curvature radius of the track, the difference between the flange angle and the equivalent conicity, and accelerations from 250 to 989.22 gal during horizontal earthquake. The results indicated that railway in Taiwan, China has no derailment risk under normal conditions. However, when earthquakes occur, the derailment risk increases with the unloading factor which is caused by seismic force. The results also show that equivalent conicity increases derailment risk; as a result, equivalent conicity should be listed as one of maintenance priorities. In addition, among all train derailment factors, flange angle, equivalent conicity and unload factors are the most significant ones.
