

J. Cent. South Univ. (2021) 28: 926-938
DOI: https://doi.org/10.1007/s11771-021-4654-5

Effect of textural characteristics on engineering properties of some sedimentary rocks
DIAMANTIS Konstantinos1, FEREIDOONI Davood2, KHAJEVAND Reza2, MIGIROS George1
1. Department of Natural Resources Management and Agricultural Engineering,Agricultural University of Athens, Athens 11855, Greece;
2. School of Earth Sciences, Damghan University, Semnan 9823, Iran
 Central South University Press and Springer-Verlag GmbH Germany, part of Springer Nature 2021
Abstract:
As it is commonly known, the estimation of physical and mechanical characteristics of rocks is very important issue in various geotechnical projects. The characteristics are mainly influenced by the microfabric-texture features of rocks. In this research, dry unit weight, effective porosity, point load index, Schmidt rebound hardness, uniaxial compressive strength, and texture coefficient were measured with the aim of correlating the physical and mechanical properties to the texture coefficient. For this purpose, a comprehensive laboratory testing program was conducted after collecting twenty sedimentary block samples including nine limestones and eleven mudstones, taken from Kalidromo (central Greece) in accordance with ASTM and ISRM standards. Also, mineralogical and petrographic properties, textural characteristics as well as X-ray diffractions were studied and the obtained results were statistically described and analysed. The maximum and minimum values of the texture coefficient were 0.13 and 0.50, respectively. The highest value was obtained for the rocks with a large amount of grains. Regression analyses were used to investigate the relationships between the texture coefficient and the engineering properties. Thus, empirical equations were developed and because of the good determination coefficients, they showed that all of the engineering properties were well correlated to the texture coefficient.
Key words:
engineering properties; texture coefficient; regression analysis; limestone; mudstone��
Cite this article as:
DIAMANTIS Konstantinos, FEREIDOONI Davood, KHAJEVAND Reza, MIGIROS George. Effect of textural characteristics on engineering properties of some sedimentary rocks [J]. Journal of Central South University, 2021, 28(3): 926-938.
DOI:https://dx.doi.org/https://doi.org/10.1007/s11771-021-4654-51 Introduction
The physical and mechanical characteristics (engineering properties) play an important role in the classification and the determining of rock mass behavior with the aim of the design and construction in any geotechnical project. The effect of rock texture on the physical and mechanical properties of rocks has been investigated for many years, and studies have shown that there are close relationships between these parameters [1-21]. According to the above-mentioned scientists, the engineering properties are mainly influenced by the mineral composition, texture (size, shape and arrangement of mineral grains, nature of grain to grain contacts and the manner in which grains interlock), degree of alteration, weathering and deformation of the source rock. Various definitions and classifications have been presented for texture in different rock type but little attention has been given to assessing quantitatively the whole rock texture and its relationship with mechanical performance. HOWARTH et al [22] developed the texture coefficient (TC), a well-established dimensionless coefficient, in order to quantitatively express the concept of rock texture. The texture coefficient is determined by a statistical assessment of thin section images and this coefficient makes it possible that the engineering properties of rocks can be understood through the rock textural properties. Since then, few scientists investigated the relationships between the texture coefficient and the engineering properties [8, 23-29], but no one used samples taken from Greece. This study presents the physical, mechanical properties, texture coefficient of sedimentary rocks, and the main objective is to quantify the relationships of the above-mentioned with the texture coefficient. For this reason twenty sedimentary block samples (nine limestones and eleven mudstones), taken from Kalidromo area (central Greece), were tested to determine dry unit weight (��d), effective porosity (ne), point load index (Is(50)), Schmidt rebound hardness (Srh) and uniaxial compressive strength (UCS). The petrographic characteristics were also investigated from one polished thin section per sample using a polarizing microscope, and point counting was carried out to quantify the mineralogical data. Furthermore, X-ray diffractions (XRDs) were used to investigate the mineral composition. Thus, the texture coefficient was also determined. The results were statistically analyzed using the method of least-squares regression. The relationships among these parameters were described by the best fit equations, and the highest determination coefficient (R2) was also determined in each relationship.
2 Sample preparation and experimental procedures
The data pertain to sedimentary sampled from twenty sites in the study area (from the surface), after extensive field study. Laboratory core drill and saw machines were used to prepare several cylindrical specimens (two-thrids per sample). Their diameters range from 50 to 54 mm, and the length to diameter ratio was between 2.0 and 2.5 and the edges of the specimens were cut parallel and smooth in accordance with ASTM [30] and ISRM [31] guidelines. The specimens were inspected macroscopically and only the isotropic, homogeneous, unweathered (or slightly weathered) and free of visible joints fissures and other discontinuities sedimentary specimens were considered. Twenty representative thin sections, from the investigated area, were prepared and examined under the polarizing microscope with the aim of describing the mineralogical constitution and the texture coefficient of the investigated rocks. Laboratory tests were conducted on (forty-three, two or three tests per sample) intact sedimentary rock samples and dry unit weight (��d), effective porosity (ne), point load index (Is(50)), Schmidt rebound hardness (Shr), and uniaxial compressive strength (UCS) of the samples were determined according to ISRM standards and ASTM test designations. The tests were carried out under dry conditions for a better relation of the results. All of them were performed at the Department of Natural Resources Management and Agricultural Engineering, Laboratory of Minerology and Geology, Agricultural University of Athens, Greece. The results obtained from the laboratory tests were presented and statistically analyzed.
3 Petrographic properties of rocks
From the engineering geological point of view, the mineralogical, petrographic, and textural characteristics of rocks are hidden behind their physical and mechanical properties. This means that mineral composition and texture of rocks affects their engineering properties [18, 32]. Two types of sedimentary rocks including limestone and mudstone were selected as research materials. Polished thin sections for all samples were prepared according to the suggested method by ASTM [33]. Mineralogical and petrographic properties as well as textural characteristics were studied by polarizing microscope based on guidelines of ISRM [31]. Furthermore, in order to detect clay minerals, X-ray diffraction (XRD) analyses were conducted according to ISRM [31].
The mineralogical study demonstrated that the major minerals in the limestone samples are calcite (15%-93%) and quartz (5%-40%). Based on the results of the XRD analyses, clay minerals were dominant in the samples with a range of 1%-8%. Some of the samples were also comprised of chlorite, muscovite, serpentine, albite and magnetite (Figure 1).
The apparent colors of the tested samples were beige, cream and dark and their grain size ranging from fine to medium (0.1 to 0.4 mm). Based on the FOLK limestone classification [34], the tested samples were characterized as microcrystalline and sparry allochemical limestones. The matrix between grains contained iron oxide and calcite. Microcracks were infilled with clay minerals, calcite and unformed CaCO3 and had micrite cement. According to the FOLK classification [35], the texture of the samples showed fossiliferous micrite to sorted or rounded biosparite. Skeletal particles or bioclast included mollusca, brachiopods, ostracods and foraminifera. Some of them were filled with sparite cement and some others with micritic cement was considered as a hard part of samples.
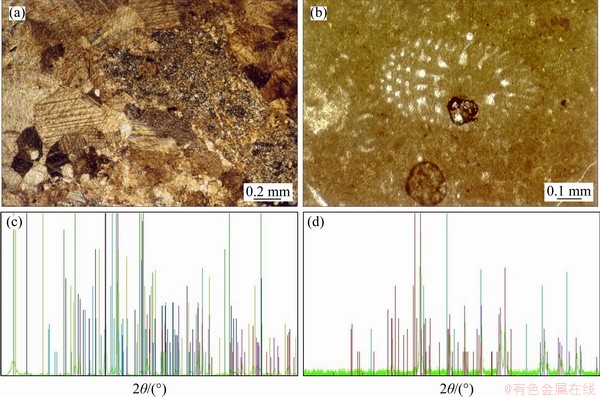
Figure 1 Thin section of limestones L2 (a) and L4 (b), XRD of limestones L1 (c) and L6 (d)
The clay bearing of rocks based on the Potter classification [36], modified by DICK et al [37], was used to group sampled rocks into claystones, mudstones, siltstones, and shales. Mudstone is an extremely fine-grained sedimentary rock containing mixture of clay and silt-sized particles. The original DUNHAM classification system [38] defined the matrix as clay and fine-silt size sediment <20 ��m in diameter. This definition was redefined by EMBRY et al [39], to a grain size of less than or equal to 30 ��m. Based on the results of thin section petrography, it is obvious that the samples were consisted of more than 20% microcrystalline quartz. Some of accessory minerals feldspar and muscovite that were approximately between 3% to 10% (Figure 2). As a textural characteristic, the sheet of chlorite (about 2% to 10%) occurred as detrital flakes produced by alteration process (Figure 2). According to the classification for roundness of grains proposed by PETTIJOHN et al [40], the studied rock samples lied in sub-rounded to angular category and had moderate sorting. X-ray diffraction (XRD) analyses demonstrated that the mudstone samples were composed of clay minerals (18%-82%, Figure 2), including montmorillonite, illite and kaolinite, while serpentine and iron oxide (1%-5%) were other components of samples. The samples are fresh, whereas the existence of serpentine in mudstone indicated the samples to undergo in low grade of alteration.
4 Physical properties of rocks
A variety of laboratory tests was used to obtain physical indices expressing the characteristics of the sedimentary samples. Physical properties including dry unit weight (��d) and effective porosity (ne) were determined for the investigated rocks using the saturation and buoyancy methods in accordance with ISRM [31]. At least two specimens from each sample (20) were used and then the mean values were obtained (Table 1). The ��d varies from 24.06 to 28.35 in the tested limestones and from 22.71 to 25.98 kN/m3 in the mudstones. It is widely known that unit weight is related to the mineralogical and textural characteristics of rocks. The studied mudstones are mainly composed of minerals that have lower specific gravities than those of the limestones and thus the mudstones show lower values of unit weight than the limestones. The ne fluctuates between 0.19% and 20.35% in the limestones and from 8.21% to 17.35% in the mudstones. Porosity decreases as unit weight (density) increases. The ranges, the average values, and the standard deviations of the parameters are listed in Table 2.
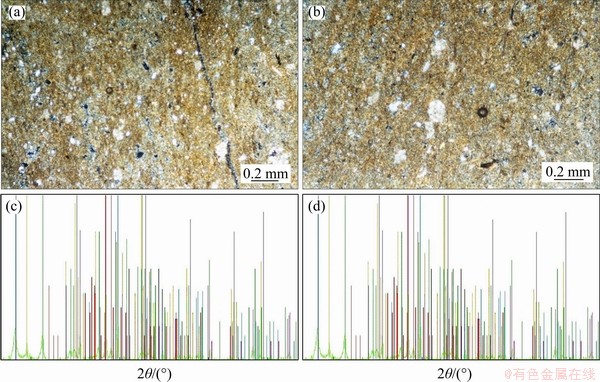
Figure 2 Thin section of mudstone M8 (a) and M5 (b); XRD patterns of mudstone M1 (c) and M4 (d)
5 Mechanical properties of rocks
The mechanical characteristics examined in the studied rocks were the Schmidt rebound hardness (Srh), the point load index (Is(50)), and the uniaxial compressive strength (UCS).
5.1 Schmidt rebound hardness
In the context of rock mechanics, the Schmidt rebound hardness (Srh) is perhaps the most frequently used index for the estimation of rock strength. This test method is mainly non-destructive, quick as well as inexpensive. A L-type Schmidt hammer was used on the tested rocks in the laboratory. Ten impacts were carried out on each specimen and the mean value was calculated. The Schmidt hammer tests were performed on the whole of the rock specimens (Table 3) according to ISRM [31]. The Shr values vary between 33.25 and 52.05 in the limestones and between 3.29 and 9.29 in the mudstones, presenting the mean values of 43.18 and 6.26, respectively. Their standard deviation values are 6.46 and 2.05, respectively (Table 4).
Table 1 Dry unit weight and effective porosity values for studied rocks

5.2 Point load strength index
The point load test method is an attractive, alternative, indirect and the most commonly used method for field specimens, uniaxial compressive strength (UCS) calculation owing to the ease of testing simplicity of specimen preparation, the low cost and feasibility of field application. However, the point load strength index (Is(50)) is not easily related with UCS. In this research, the point load test was determined according to ASTM requirements [41]. Only the diametrical point load tests were carried out on the samples (Figure 3). The point load strength index (IS(50)) (referred to a standard size of 50 mm) values is listed in Table 3. The parameter values range from 0.85 to 4.65 MPa in the limestones and from 0.52 to 2.34 MPa in the mudstones. The mean values are 2.67 and 1.16 MPa, respectively, while the standard deviation values are 1.14 and 0.54 MPa, respectively (Table 4).
5.3 Uniaxial compressive strength
The uniaxial compressive strength of the studied limestones and mudstones was determined using a uniaxial compression testing machine in accordance with ASTM standards [42], on the prepared core samples (Figure 4). The test results are listed in Table 3. The UCS values range from 7.77 to 89.69 MPa in the limestones exhibiting a great fluctuation. The mean value is 44.50 MPa and the standard deviation is 29.51 MPa (Table 4). In the mudstones, the UCS values fluctuate between 6.79 and 26.50 MPa, while the mean value and the standard deviation are 14.35 and 6.87 MPa, respectively (Table 4). As is commonly known, UCS increases with increasing unit weight and decreases with increasing porosity.
Table 2 Statistical analysis of physical properties of rock
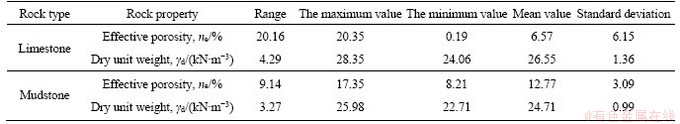
Table 3 Schmidt rebound hardness, point load strength index and uniaxial compressive strength values of rocks
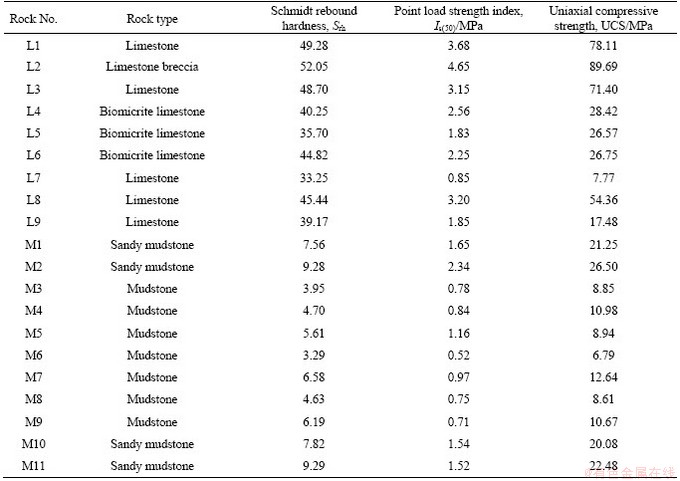
Table 4 Statistical analysis of mechanical properties of rock
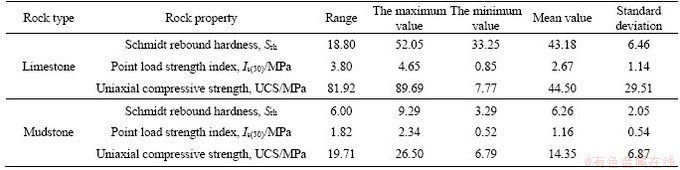
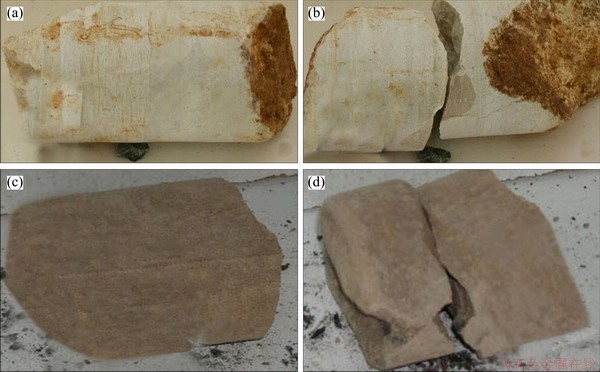
Figure 3 Limestone specimen L9 before point load test (a) and after point load test (b), mudstone specimen M9 before point load test (c) and after point load test (d)
6 Calculation of texture coefficient
Rock texture characteristics is defined as the three-dimensional arrangement of rock forming minerals. It includes texture, mainly the geometrical aspects of minerals like their shape, size and preferred orientation of grains [27]. These parameters, which can be quantified from the geometrical features of grains and packing density with regard to the matrix effect, have effect on engineering properties of various rocks and are correlated with the mechanical and physical properties of rock material by many scholars [6, 9, 19-21, 24, 25, 28, 29, 47]. So, compositional features requiring correlations are engineering properties, percentages of component grains and cementing materials [6]. The innovation of texture coefficient by HOWARTH et al [22] is the most exclusive method applying petrography techniques to quantitatively express the concept of rock texture. This parameter gives a dimensionless quantitative measure of rock texture. TC value for the studied rock samples was calculated from the following equation:

 (1)
(1)
where the quantitative assessment of texture coefficient (TC) is formulated with the parameters of grain the arithmetic mean of discriminated form-factors (FF0), elongation (N0, N1, AR1), the angle factor, quantifying grain orientation (AF1), and grain packing weighting (AW). Here, N0 and N1 are the number of grains whose aspect ratio is below and above a pre-set discrimination level, respectively, which is determined as 2.0 by HOWARTH et al [6, 22]. The AW, AR and FF are calculated based on the following equations:
 (2)
(2)
 (3)
(3)
 (4)
(4)
where L is length; W is wide; P is perimeter and A is area. The angle factor (AF) is calculated by summing the products of the class weightings and the fractions of the total number of angular differences in each class as follows:
 (5)
(5)
where N is the total number of elongated particles; xi is the number of angular differences in each class and i is the weighting factor and class number.
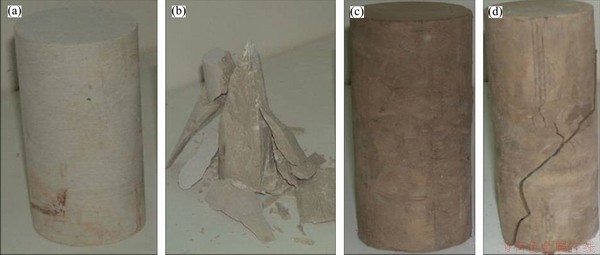
Figure 4 Limestone specimen L8 before and after uniaxial compressive strength test (b); Mudstone specimen M6 before uniaxial compressive strength test (c) and after uniaxial compressive strength test (d)
The quantification of the rock texture was done in obtained TIFF format images of thin sections, prepared from the studied rocks, using JMicroVision (v1.27) software. This procedure consists of image acquisition, digitization, measurement, data analysis and output. During image acquisition, the image was captured using a digital camera attached to the microscope. The boundary of an individual crystal was traced. About 50-100 grains in each slide were traced. After calibration of the images and drawing grains boundary, the measured data serve for the computation of additional fabric parameters including length (L), wide (W), perimeter (P), area (A) and orientation of grains determined by the software (Figure 5). Then, requirement parameters such as AW, AR, FF, AF and finally the TC were determined from above equations. The values of the calculated TC for the studied rocks are listed in Table 5. Figure 6 presents the comparative diagrams of the values of TC for the rock samples. As it can be seen, the values of TC for the mudstone samples were higher than that of limestone samples. The sample of M2 (sandy mudstone) presented the maximum value, while the minimum values of the TC were met in the samples of L5 (biomicrite limestone) and L7 (limestone). These values were equal to 0.50 and 0.13, respectively. Also, the L2 (limestone breccia), M1 (sandy mudstone), M10 (sandy mudstone) and M11 (sandy mudstone) presented high TC values too. These values are very reasonable because according to AZZONI et al [8], the TC values are generally high in rocks with a large volume of grains and the opposite.
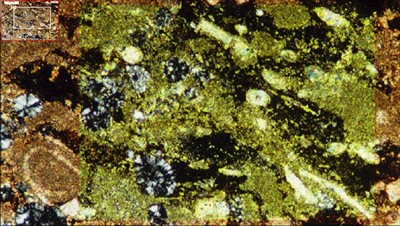
Figure 5 Evaluation of TC parameter by JMicroVision (v1.27) software
Table 5 Values of texture coefficient derivations of rocks
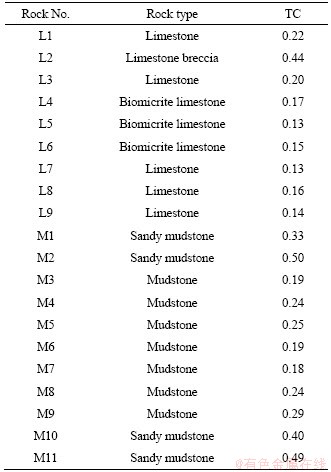
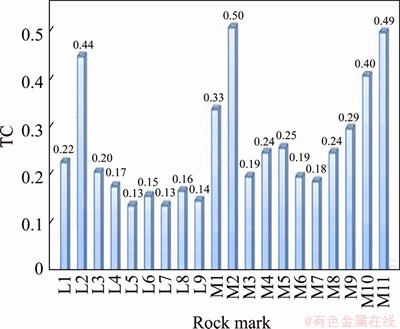
Figure 6 3D bar diagram of texture coefficient (TC) values for rocks
7 Regression analyses and discussion
The most widely applied technique in the literature for prediction purposes is the simple regression analysis. In this research, this method was used in order to express the correlations among the physical and mechanical properties with the texture coefficient (TC) of the studied sedimentary rocks. Each geotechnical parameter of the rocks was taken as a dependent variable and TC values were considered independent variables. So, the best fitting curve of those correlations was determined and the determination coefficient (R2) values were utilized. The equations of the best fit curves (e.g., linear, logarithmic, exponential, power) and R2 were calculated by the ��least squares�� method in Excel 2016 software.
7.1 Relationships between texture coefficient and physical properties
An attempt has been made to correlate the texture coefficient with dry unit weight (��d) and effective porosity (ne) (see Figure 7). A logarithmic correlation between TC and ��d was considered the best fit in limestones, while in mudstones a linear function described better than the other relations between the above-mentioned properties. The relation between TC and ne presented very strong correlations both for the limestones (R2=0.84) and mudstones (R2=0.80). ne was negatively affected (exponentially) by increasing TC both in the limestones and mudstones. The obtained empirical equations and determination coefficients (R2) are detailed in Table 6. ERSOY et al [23], for arrange of rocks, suggested logarithmic function between TC and ��d (R2=0.53), while OZTURK et al [24], for limestones and andesites, observed linear correlations between these properties (R2=0.42). Also, OZTURK et al [24] studied the relationship between TC and ne and suggested linear equations with very high correlation (R2=0.96). In other words, the present research resulted in correlations similar to the literature.
7.2 Relationships between texture coefficient and mechanical properties
Based on the results obtained from the present research, the rock strength increases with increasing texture coefficient. The plots of the TC values against Schmidt rebound hardness (Srh), point load strength index (Is50), and uniaxial compressive strength (UCS) are illustrated in Figure 8. The best fit correlations were found to be linear for the mudstones and logarithmic for the limestones. The strongest correlation in the limestones was between TC and Is50 (R2=0.80), while the highest determination coefficient in the mudstones was found between TC and UCS (R2=0.82).
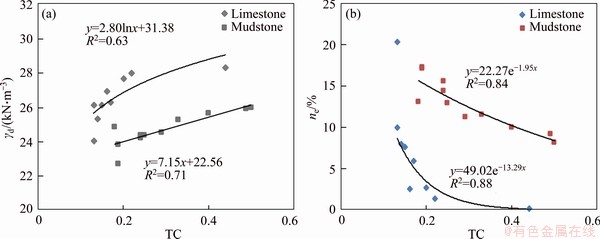
Figure 7 Correlations between texture coefficient (TC) and dry unit weight (��d) (a), effective porosity (ne) (b)
Table 6 Empirical equations and statistical parameters from regression analyses
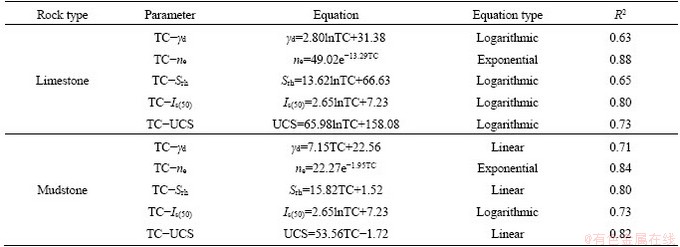
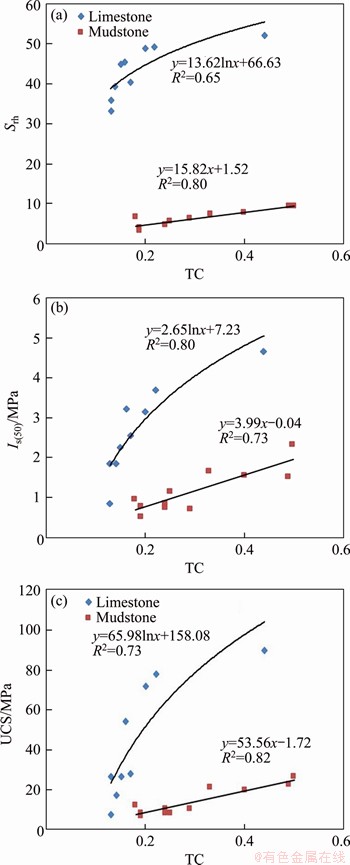
Figure 8 Correlations between texture coefficient and schmidt rebound hardness (Srh) (a), point load strength index (Is(50)) (b), uniaxial compressive strength (UCS) (c)
The obtained empirical equations and their determination coefficient (R2) are detailed in Table 6. Similar functions were suggested by several researchers. Specifically, ERSOY and WALLER [23] proposed that the Schmidt rebound hardness (Srh) is linearly related to TC (R2=0.47). OZTURK et al [24] observed that there was a highly significant tendency for point load strength index (Is50) to increase with increasing TC (R2=0.67). Moreover, many attempts were made for determining the relation between TC and UCS. The majority of them, for different rocks [6, 26, 27] is that the above-mentioned relationship was better described by a linear equation and that UCS increased with increasing TC with a high determination coefficient. OZTURK et al [28] also studied the correlations between these properties and suggested power function (R2=0.79) for several rocks. On the other hand, OZTURK et al [21], for limestones and andesites and AZZONI et al [8] for igneous, metamorphic, and sedimentary rocks, observed that the TC did not have any clear relation with UCS, while ALBER et al [25], for fault breccia, proposed that there was inverse (logarithmic) relationship between the above- mentioned properties.
8 Conclusions
In the present research, engineering properties and textural characteristics of twenty rock samples including nine limestones and eleven mudstones, taken from central Greece, were determined in the laboratory. The measured engineering properties included dry unit weight (��d), effective porosity (ne), point load index (Is(50)), Schmidt rebound hardness (Srh) and uniaxial compressive strength (UCS). Thin sections and XRDs from each sample were investigated. The textural characteristics of the rocks were studied and quantified by the texture coefficient (TC) calculated by using JMicroVision (v1.27) and Excel 2016 softwares. The obtained results showed that the values of TC for the limestones were lower than the mudstones. The maximum and minimum values of the TC were equal to 0.13 and 0.50, respectively and the highest values were presented in the rocks with a large volume of grains. Similar values were suggested by some researchers.
Simple regression analyses were used for determining relations which exist between the engineering properties and TC of the rocks. Highly related equations were found between the TC and the physical properties. The TC was positively correlated with dry unit weight (��d) for both mudstones (linear equation, R2=0.71) and limestones (logarithmic trend, R2=0.63), while inverse exponential equations were obtained between TC and the effective porosity (ne) for both of them. As far as mechanical properties were concerned, they were correlated with TC by linear functions in the mudstones and logarithmic in the limestones. The best correlation in the limestones was between TC and Is50 (R2=0.80), while the highest determination coefficient in the mudstones was found between TC and UCS (R2=0.82). The common point of these relationships was that the strength increased with increasing texture coefficient. Similar relationships were also presented by many researchers. Thus, there were meaningful and acceptable equations between the ��d, ne, Srh, Is(50), UCS and TC and this means that the engineering properties of the rocks are closely related to the textural characteristics. Therefore, the empirical equations obtained in this research provide valuable approach for determining physical and mechanical properties of the rocks.
References
[1] EHRLICH R, WEINBERG B. An exact method for characterization of grain shape [J]. Sedim Petrol, 1970, 40(1): 205-212.
[2] OLSSON W A. Grain size dependence of yield stress in marble [J]. Journal of Geophysical Research, 1974, 79: 4859-4861.
[3] HUGMAN R H, FRIEDMAN M. Effects of texture and composition on mechanica behavior of experimentally deformed carbonate rocks [J]. American Association of Petroleum Geologists Bulletin, 1979, 63(9): 1478-1489.
[4] ONODERA T F, ASOKA K H M. Relation between petrographic characteristics, engineering index properties and mechanics properties of selected sandstone [J]. Bulletin of the International Association of Engineering Geology, 1980, 28: 55-71.
[5] WILLIAMS H, TURNER F J, GILBERT C M. Petrography: An introduction to the study of rocks in thin sections [M]. California: W.H. Freeman and Company, 1982.
[6] HOWARTH D F, ROWLANDS J C. Quantitative assessment of rock texture and correlation with drillability and strength properties [J]. Rock Mechanics and Rock Engineering, 1987, 20: 57�C85.
[7] ULUSAY R, TURELI K, IDER M H. Prediction of engineering properties of selected litharenite sandstone from its petrographic characteristics using correlation and multivariate statistical techniques [J]. Engineering Geology, 1994, 37: 135-157.
[8] AZZONI A, BILO F, RONDENA E, ZANINETTI A. Assessment of texture coefficient for different rocktypes and correlation with uniaxial compressive strength and rock weathering [J]. Rock Mechanics and Rock Engineering, 1996, 29: 36-46.
[9] JENG F S, WENG M C, LIN M L, HUANG T H. Influence of petrographic parameters on geotechnical properties of tertiary sandstones from Taiwan [J]. Engineering Geology, 2004, 73: 71-91.
[10] KARAKUS M, KUMRAL M, KILIC O. Predicting elastic properties of intact rocks from index tests using multiple regression modelling [J]. Int J Rock Mech Min Sci, 2005, 42(2): 323-330.
[11] CHANG C, ZOBACK M D, KHAKSAR A. Empirical relations between rock strength and physical properties in sedimentary rocks [J]. J Petrol Sci Eng, 2006, 51(3): 223-237.
[12] SONMEZ H, GOKCEOGLU C, NEFESLIOGLU H A, KAYABASI A. Estimation of rock modulus: For intact rocks with an artificial neural network and for rock masses with a new empirical equation [J]. Int J Rock Mech Min Sci, 2006, 43(2): 224-235.
[13] YILMAZ I, YUKSEK A G. An example of artificial neural network (ANN) application for indirect estimation of rock parameters [J]. Rock Mechanics and Rock Engineering, 2008, 41(5): 781-795.
[14] SARKAR K, TIWARY A, SINGH T N. Estimation of strength parameters of rock using artificial neural networks [J]. Bull Eng Geol Environ, 2010, 69(4): 599-606.
[15] YAGIZ S, SEZER E A, GOKCEOGLU C. Artificial neural networks and nonlinear regression techniques to assess the influence of slake durability cycles on the prediction of uniaxial compressive strength and modulus of elasticity for carbonate rocks [J]. Int J Numer Anal Methods Geomech, 2012, 36(14): 1636-1650.
[16] YESILOGLU-GULTEKIN N, SEZER E A, GOKCEOGLU C, BAHYAN H. An application of adaptive neuro fuzzy inference system for estimating the uniaxial compressive strength of certain granitic rocks from their mineral contents [J]. Expert Systems with Applications, 2013, 40(3): 921-928.
[17] AJALLOEIAN R, MOHAMMADI M. Estimation of limestone rock mass deformation modulus using empirical equations [J]. Bull Eng Geol Environ, 2014, 73(2): 541-550.
[18] DIAMANTIS K, GARTZOS E, MIGIROS G. Influence of petrographic characteristics on physico-mechanical properties of ultrabasic rocks from central Greece [J]. Bull Eng Geol Environ, 2014, 73(4): 1273-1292.
[19] DORMISHI A, ATAEI M, MIKAEIL R, KHALO KAKAEI R. Relations between texture coefficient and energy consumption of gang saws in carbonate rock cutting process [J]. Civil Engineering Journal, 2018, 4(2): 413-421. DOI: 10.28991/cej-0309101.
[20] ESMAILZADEH A, BEHNAM S, MIKAEIL R, NAGHADEHI M Z, SAEI S. Relationship between texture and uniaxial compressive strength of rocks [J]. Civil Engineering Journal, 2017, 3(7): 480-486. DOI: 10.28991/cej-2017-00000106.
[21] HEMMATI A, GHAFOORI M, MOOMIVAND H, LASHKARIPOUR G R. The effect of mineralogy and textural characteristics on the strength of crystalline igneous rocks using image-based textural quantification [J]. Engineering Geology, 2019, 266: 105467. DOI: 10.1016/ j.enggeo.2019.105467.
[22] HOWARTH D F, ROWLANDS J C. Development of an index to quantify rock texture for qualitative assessment of intact rock properties [J]. Geotechnical Testing Journal, 1986, 9(4): 169.
[23] ERSOY A, WALLER M D. Textural characterization of rocks [J]. Engineering Geology, 1995, 39: 123-136.
[24] OZTURK C A, NASUF E, BILGIN N. The assessment of rock cutability, and physical and mechanical rock properties from a texture coefficient [J]. The Journal of the Southern African Institute of Mining and Metallurgy, 2004, 104(7): 397-402.
[25] ALBER M, KAHRAMAN S. Predicting the uniaxial compressive strength and elastic modulus of a fault breccia from texture coefficient [J]. Rock Mechanics and Rock Engineering, 2009, 42: 117-127.
[26] TANDON R S, GUPTA V. The control of mineral constituents and textural characteristics on the petrophysical & mechanical (PM) properties of different rocks of the Himalaya [J]. Engineering Geology, 2013, 153: 125-143.
[27] GUPTA V, SHARMA R. Relationship between textural, petrophysical and mechanical properties of quartzites: A case study from northwestern Himalaya [J]. Engineering Geology, 2012, 135: 1-9.
[28] OZTURK C A, NASUF E. Strength classification of rock material based on textural properties [J]. Tunnelling and Underground Space Technology, 2013, 37: 45-54.
[29] OZTURK C A, NASUF E, KAHRAMAN E. Estimation of rock strength from quantitative assessment of rock texture [J]. The Journal of the Southern African Institute of Mining and Metallurgy, 2014, 1: 471-480.
[30] ASTM. Standard practices for preparing Rock core specimens and determining dimensional and shape tolerances [S]. American Society for Testing and Materials, 2001, D4543.
[31] ULUSAY R, HUDSON J A. The blue book: The complete ISRM suggested methods for rock characterization, testing and monitoring, 1974-2006, compilation arranged by the ISRM Turkish National Group [M]. Ankara: Kazan Offset Press, 2007.
[32] FEREIDOONI D, KHAJEVAND R. Determining the geotechnical characteristics of some sedimentary rocks from Iran with an emphasis on the correlations between physical, index, and mechanical properties [J]. Geotech Test J, 2018, 41(3): 20170058. DOI: 10.1520/GTJ20170058.
[33] ASTM. Standard guide for petrographic examination of dimension stone [S]. ASTM International: West Conshohocken, PA, 2009.
[34] FOLK R L. Spectral subdivision of limestone types [J]. Am Ass Petrol Geo Mem, 1962, 1: 62-84.
[35] FOLK R L. Practical petrographic classification of limestone [J]. Bull Am Ass Petrol Geo, 1959, 43: 1-38.
[36] POTTER P E, MAYNARD J B, PRYOR W A. Sedimentology of shale [M]. New York: Springer, 1980.
[37] DICK J C, SHAKOOR A. Lithologic controls of mudrock durability [J]. Q J Eng Geol, 1992, 25: 31-46.
[38] DUNHAM R J. Classification of carbonate rocks according to depositional texture [M]. Tulsa, Oklahoma: American Association of Petroleum Geologists, 1962.
[39] EMBRY E, ASHTON F, KLOVAN J. A late Devonian reef tract on northeastern Banks Island, N.W.T [J]. Bulletin of Canadian Petroleum Geology, 1971, 19(4): 730-781.
[40] PETTIJOHN F J, POTTER P E, SIEVER R. Sand and sandstone [M]. Berlin: Springer, 1973.
[41] ASTM. Standard test method for the determination of the point load strength index of rock [S]. American Society for Testing and Materials, 2005.
[42] ASTM. Standard test method of unconfined compressive strength of intact rock core specimens [S]. American Society for Testing and Materials, 1986.
[43] PANOZZO R. Orientation and misorientation imaging: integration of microstructural and extural analysis [M]// Textures of Geological Materials. Oberursel: Verlag, 1994.
[44] MANOUCHEHRIAN A, SHARIFZADEH M, MOGHADAM R H. Application of artificial neural networks and multivariate statistics to estimate UCS using textural characteristics [J]. Int J Min Sci Technol, 2012, 22(2): 229-236.
[45] BANDINI A, BERRY P. Influence of marble��s texture on its mechanical behavior [J]. Rock Mechanics and Rock Engineering, 2013, 46: 785-799.
[46] AJALLOEIAN R, MANSOURI H, BARADARAN E. Some carbonate rock texture effects on mechanical behavior, based on Koohrang tunnel data, Iran [J]. Bull Eng Geol Environ, 2016, 76(1): 295-307.
[47] ERSOY H, ACAR S. Influences of petrographic and textural properties on the strength of very strong granitic rocks [J]. Environ Earth Sci, 2016, 75: 1461-1476.
(Edited by ZHENG Yu-tong)
���ĵ���
�ṹ�����Գ����ҹ������ʵ�Ӱ��
ժҪ����ʯ��ѧ���ԵĹ����ڸ������������зdz���Ҫ����Щ������Ҫ����ʯϸ�ṹ������Ӱ�졣Ϊ�˽�֯��ϵ������ѧ������ϵ�����������˸����ء���Ч��϶�ʡ������ָ����ʩ���ػص�Ӳ�ȡ����Όѹǿ�Ⱥ�֯��ϵ��������ASTM��ISRM����Kalidromo (ϣ���в�)�ɼ��˰���9��ʯ���Һ�11���������ڵ�20���������Ʒ�����Խ�����ȫ���ʵ���Ҳ��ԣ��������ѧ����ʯѧ���ʡ��ṹ������X��������������о��������ý��������ͳ�������ͷ���������ϵ�������ֵΪ0.13����СֵΪ0.50�����������ϸߵ���ʯ��ֵ��ߡ����ûع�����ķ����о��˽ṹϵ���빤������֮��Ĺ�ϵ�������˾��鷽�̲�ѡȡ����ѵľ���ϵ����������������й�������������ϵ���������õ�����ԡ�
�ؼ��ʣ��������ʣ�����ϵ�����ع������ʯ���ң�����
Received date: 2019-01-28; Accepted date: 2020-01-24
Corresponding author: DIAMANTIS Konstantinos, PhD, Lecturer; Tel: +30-6977364756; E-mail: kostasdiam@aua.gr; ORCID: https://orcid.org/ 0000-0002-1384-6940
Abstract: As it is commonly known, the estimation of physical and mechanical characteristics of rocks is very important issue in various geotechnical projects. The characteristics are mainly influenced by the microfabric-texture features of rocks. In this research, dry unit weight, effective porosity, point load index, Schmidt rebound hardness, uniaxial compressive strength, and texture coefficient were measured with the aim of correlating the physical and mechanical properties to the texture coefficient. For this purpose, a comprehensive laboratory testing program was conducted after collecting twenty sedimentary block samples including nine limestones and eleven mudstones, taken from Kalidromo (central Greece) in accordance with ASTM and ISRM standards. Also, mineralogical and petrographic properties, textural characteristics as well as X-ray diffractions were studied and the obtained results were statistically described and analysed. The maximum and minimum values of the texture coefficient were 0.13 and 0.50, respectively. The highest value was obtained for the rocks with a large amount of grains. Regression analyses were used to investigate the relationships between the texture coefficient and the engineering properties. Thus, empirical equations were developed and because of the good determination coefficients, they showed that all of the engineering properties were well correlated to the texture coefficient.
