
J. Cent. South Univ. (2017) 24: 569-588
DOI: 10.1007/s11771-017-3459-z

Bacterial graphical user interface oriented by particle swarm optimization strategy for optimization of multiple type DFACTS for power quality enhancement in distribution system
M. Mohammadi, M. Montazeri, S. Abasi
Department of Electrical Engineering, Borujerd Branch, Islamic Azad University, Borujerd, Iran
 Central South University Press and Springer-Verlag Berlin Heidelberg 2017
Abstract:
This study proposes a graphical user interface (GUI) based on an enhanced bacterial foraging optimization (EBFO) to find the optimal locations and sizing parameters of multi-type DFACTS in large-scale distribution systems. The proposed GUI based toolbox, allows the user to choose between single and multiple DFACTS allocations, followed by the type and number of them to be allocated. The EBFO is then applied to obtain optimal locations and ratings of the single and multiple DFACTS. This is found to be faster and provides more accurate results compared to the usual PSO and BFO. Results obtained with MATLAB/Simulink simulations are compared with PSO, BFO and enhanced BFO. It reveals that enhanced BFO shows quick convergence to reach the desired solution there by yielding superior solution quality. Simulation results concluded that the EBFO based multiple DFACTS allocation using DSSSC, APC and DSTATCOM is preferable to reduce power losses, improve load balancing and enhance voltage deviation index to 70%, 38% and 132% respectively and also it can improve loading factor without additional power loss.
Key words:
1 Introduction
Modem power systems are complex networks, where hundreds of generating stations and thousands of load centers are interconnected through long power transmission and distribution networks [1]. The main concern of consumers is the quality and reliability of power supplies at various load centers where they are located. Even though the power generation in most well developed countries is fairly reliable, the quality of the supply is not so reliable. Power distribution systems, ideally, should provide their customers with an uninterrupted flow of energy at smooth sinusoidal voltage at the contracted magnitude level and frequency [2]. The traditional solutions for power quality improvement are by applying passive harmonic filters and zigzag reactors, nonetheless the best and most effective solution to mitigate power quality disturbances and protect sensitive equipment is to install proper types of custom power devices (CPDs) [3]. One of CPDs is static switche which improves the power quality of system by changing the distribution system configuration and another type of CPDs is distribution FACTS, namely DFACTS. Active power conditioner (APC), dynamic voltage restorer (DVR), distribution static synchronous series compensator (DSSSC), distribution static compensator (DSTATCOM) and unified power quality conditioner (UPQC) are some of main DFACTS devices. However, the benefits of these devices are severely dependent on their type, size, number and location in the distribution system [4]. Therefore, elaborate studies are done on the subject of placement of these devices for optimal improvement of power system operation. Both the choice of the adapted DFACTS devices and its site in the distribution electricity network depend on the objectives that we want to reach.In stationary regime, the DFACTS devices are used to control the transits of powers in order to eliminate or reduce the power loss in the distribution feeders and control the voltage at load buses. The required objectives have either technical nature or economic one [5]. The placement and sizing of the DFACTS should be determined based on economic feasibility, in which optimization is usually considered in the procedure. Up to now, few researches have investigated the optimal placement and sizing of DFACTS devices in distribution system for power quality improvement. For instance, a fuzzy based optimal location of active power line conditioner for minimizing harmonic distortion was proposed [6]. A GA based optimal placement of dynamic voltage restorer for voltage sags compensation was reported [7]. A solution to the problem of optimal placement of DSTATCOM was suggested by using the binary gravitational search algorithm to improve reliability of distribution systems [8]. The optimal placement and sizing of unified power quality conditioner for improving voltage and current profiles and reducing power was considered by using differential evolution algorithm [9]. In Ref. [10], FARHOODNEAA et al applied a multi-based new heuristic optimization technique using the improved discrete firefly algorithm (IDFA) for determining the optimal size and location of APCs. In Ref. [11], a modified discrete particle swarm optimization (MDPSO) has been proposed to optimize the placement and size of multiple active power line conditioners (APLCs) to minimize the investment cost, while the voltage total harmonic distortion and the individual harmonic distortion as constraints are maintained within the standard level. In Ref. [12], optimal location and sizing of DSTATCOM for the sake of power loss reduction, and improvement of current and voltage profile in distribution networks are using effective biologically inspired algorithm (immune algorithm). In Ref. [13], the power quality improvement was described using particle swarm optimization for optimal placement and sizing of distribution static synchronous series compensator in radial distribution networks to enhance the power quality including improvement of voltage and reduction of line losses. In the last two decades, many types of optimization algorithms, such as biogeography based optimization [14], imperialist competitive algorithm [15, 16], genetic algorithm [17, 18], and modified teaching�Clearning based optimization algorithm [19, 20], have been widely developed and applied in distribution feeder reconfiguration, simultaneous distributed generation and capacitor placement, simultaneous sectionalizing switches and distributed generation placement. Sometimes, to avoid trammeling in local minimum answers. The researchers have developed and employed the hybrid evolutionary optimization algorithms, such as hybrid fuzzy and genetic algorithm [21, 22], hybrid particle swarm with genetic algorithm [23], hybrid immune algorithm [24], hybrid immune-hill climbing optimization approach [25], hybrid artificial bee colony algorithm [26], and hybrid fuzzy bacterial foraging optimization algorithm [27]. On the other hand, this combination can lead to increasing the convergence speed and result to more accurate solutions.
The optimal placement problem of single type of distribution flexible alternating current transmission system for improving the overall network power quality performance of a power system was solved [5-14]. Shunt connected converters can improve current quality which can compensate current harmonics and compensate reactive current and therefore leads to power reduction of feeders, while the series connected regulators might be employed to improve voltage profile quality. Also equalizing the feeder load balancing in distribution system could be achieved by shunt connected converters. Therefore, this work aims to find multi type DFACTS, including DSSSC, APC and DSTATCOM at optimal location with optimal value. This work utilized the enhanced bacterial foraging optimization (EBFO) algorithm to solve the optimal placement problem of several types of DFACTS in distribution system. This work presented a GUI based on EBFO to seek the optimal locations and values of a given set of DFACTS devices for more efficient use of power system assets. In this user-friendly framework called the DFACTS Placement Toolbox, the user has the opportunity to choose the distribution test system network, determine the EBFO settings and select the number and types of DFACTS device to be allocated in the network. Three different DFACTS devices are used in this GUI: APC, DSSSC, and DSTATCOM. The simulation results show that the DFACTS placement toolbox is effectively applicable to find the optimal locations and values of the given multi-type DFACTS devices mix in a given power system so as to maximize objective function under security constraints.
2 Modeling of active power conditioner
APC is a parallel multi-function compensating device depending on the available controller design, which is able to mitigate voltage sag and harmonic distortion, performs power factor correction, and improves the overall power quality. The voltage-source converter is the main part of the APC, which converts the DC-link voltage into three-phase AC voltages with controllable amplitude, frequency and phase. Considering the steady-state APC losses such as transformer and inverter losses, an accurate load flow model of the APC should be obtained.
Figure 1 shows the schematic diagram of an APC and its Norton equivalent circuit with respect to bus N.
As shown, the injected current IAPC at bus N in fundamental and harmonic frequencies can be expressed as
 (1)
(1)
where IAPLC is the injected current by APC with phase angle ��i; Icon is the Norton current with phase angle ��con; IS is the utility side current with phase angle ��i; VS is the utility side voltage with phase angle ��v; VN is the voltage at bus N with phase angle ��v-N-; IL is the load side current with phase angle ��i; ZS is the utility impedance; ZAPC is APC Norton impedance (1/YAPC); h is harmonic orders, like 1, 2, 3, ��, H.
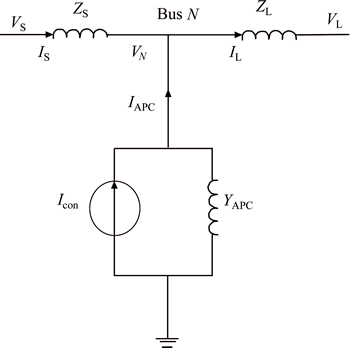
Fig. 1 APC single-line Norton equivalent circuit
Equation (1) shows that the injected APC current  can correct voltage sag, voltage variation and harmonic distortion at bus N by adjusting the voltage drop across the impedance ZAPC in the fundamental and harmonic frequencies.
To compute the bus voltage variations in fundamental and harmonic frequencies in the presence of APC, it is assumed that APC is added to the system as a PQ bus (the bus with the specified real power |P| and reactive power |Q|) with impedance  between the existing bus N and the newly added virtual bus K in a M-bus system.
Therefore, the new impedance matrix of the system should be modified based on  as [28]
 (2)
(2)
The new column accounts for the increase of all bus voltages due to  Considering virtual bus K is short circuited to the reference node, the virtual bus K can be eliminated using the Kron reduction method on Eq. (2) as
 (3)
(3)
Hence, the bus voltages calculated at the fundamental and harmonic frequencies due to the presence of APC can be obtained using the modified impedance matrix in Eq. (2) and Eq. (3) as
 (4)
(4)
 (5)
(5)
where 

 and
and  are the node voltage at the kth iteration, equivalent current injection at the kth iteration, and the real and imaginary parts of the equivalent current injection at the kth iteration, respectively. In addition, V, Z and I are the bus voltage vector, system impedance matrix, and nodal injected current vector in fundamental and harmonic frequency, respectively.
Equations (4) and (5) can be solved using the backward/forward sweep method [29, 30]. Note that the values of P and Q in Eq. (4) are positive for conventional PQ (load) buses and negative for bus with APC. The bus voltage at bus i in the fundamental and harmonic frequencies and the voltage THD can be changed by altering the rating of the installed APC during the optimization process.
3 Mathematical modeling of DSSSC
FACTS technology opens up new opportunities for controlling power and enhancing the usable capacity to the present, as well as the new and upgraded lines. It has the ability to control the interrelated parameters that manage the operation of transmission systems including series impedance (e.g. SSSC), shunt impedance, current, voltage and phase angle. The application of this technology has paved way for an innovative and superior transmission and distribution control [31]. A static synchronous generator is operated without an external electric energy source as a series compensator. But the SSSC consists of transiently rated energy storage or energy absorbing device to improve the dynamic performance of the power system. The overall active voltage drop of the line can be temporarily increased and decreased by adding temporary active power compensation devices [32, 33].
DSSSC injects voltage by voltage source converter that must be kept in quadrature with load current and the model of a typical SSSC is shown in Fig. 2.
In principle, the inserted series voltage changes the impedance (i.e. reactance) of the transmission line. Therefore, the real and reactive power flow of transmission line can be controlled.
Consider a system with two buses ��i�� and ��j�� as shown in Fig. 3. By installing DSSSC in distribution system, all node voltages, particularly the nearby nodes of DSSSC position and branch currents of the network changes are in the steady state condition.
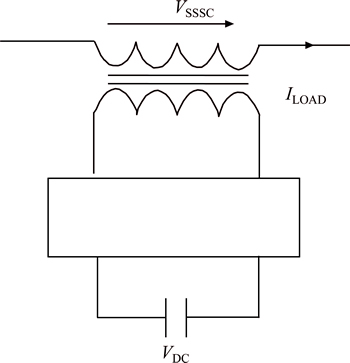
Fig. 2 Typical model of SSSC
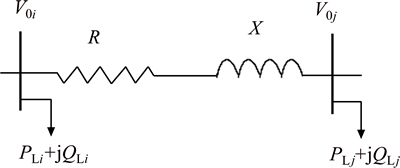
Fig. 3 Single-line diagram of two buses of a distribution system
Schematic diagram of buses ��i�� and ��j�� of a distribution system when DSSSC is installed for voltage regulation in bus ��j�� is shown in Fig. 4.
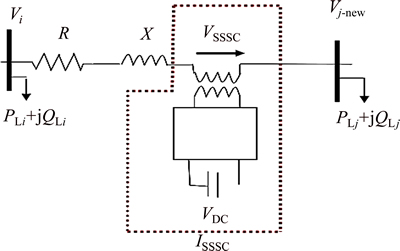
Fig. 4 Single-line diagram of two buses of a distribution system with consideration of DSSSC
Figure 5 shows the phasor diagram of voltages and current of the system shown in Fig. 2. Using DSSSC, voltage of bus ��j�� changes from Vj to Vj-new as shown in the phasor diagram of Fig.5. For the sake of simplicity, the angle of voltage Vi, i.e. �� is assumed to be zero in phasor diagram. Equation (6) is developed from Figs. 4 and 6.
 (6)
(6)
Also,
 (7)
(7)
DSSSC consists of a voltage source inverter connected in series through a coupling transformer to the distribution line. An energy source is required to provide and retain the DC voltage across the DC capacitor and compensation of DSSSC losses. Figrue 7 shows the equivalent circuit of two buses of a distribution system with DSSSC. From Fig. 7, it is obtained that
 (8)
(8)
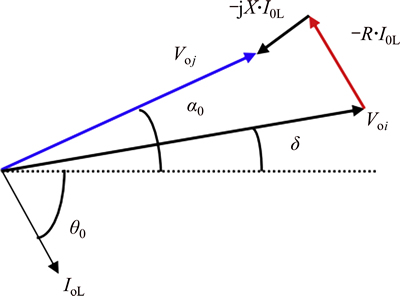
Fig. 5 Phasor diagram of voltages and current of system shown in Fig. 2

Fig. 6 Phasor diagram of voltages and currents of system shown in Fig. 4
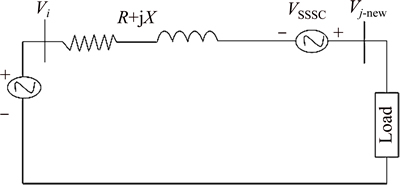
Fig. 7 Equivalent circuit of two buses of a distribution system with DSSSC
Separating the real and imaginary parts of Eq. (6) yields:

 (9)
(9)

 (10)
(10)
Finally, injected reactive power by SSSC can be expressed as
 (11)
(11)
where
 (12)
(12)
 (13)
(13)
4 DSTATCOM structure and modeling in distribution load flow
DSTATCOM is a shunt device that injects or absorbs both active and reactive current at a point of common coupling connection. DSTATCOM is also a DC/AC converter consisting of a DC-link capacitor or a DC energy storage device that provides constant DC-link voltage, and a three-phase PWM voltage source converter (VSC) bridge.
All these are usually connected to the network via a coupling transformer [34]. A DSTATCOM can work as a synchronous voltage source with a variable magnitude and phase angle. Hence, it is capable of controlling its bus voltage and correcting the power factor. Figure 8 shows a bus in a distribution system equipped with a proposed DSTATCOM. Switch changing can absorb or generate the current by considering control strategy and depend on voltage of common coupling bus.
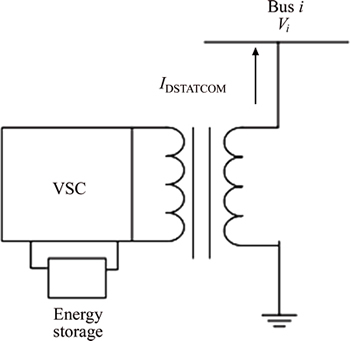
Fig. 8 A typical DSTATCOM connected to bus i
In steady-state operation with heavy loading or some short-circuit events, DSTATCOM typically injects appropriate compensating current to the point of coupling connection, and thus voltage at the load bus regulated by the DSTATCOM will be lifted close to the nominal or a given value [35-37].
Generally, DSTATCOM has the ability of exchanging active and reactive power simultaneously. The amount of active power exchanging depends on the capacity of energy source.
Backward/forward sweep load flow calculations are used in this work, in conjunction with a suitable steady state model for DSTATCOM as presented in Ref. [38]. Many distribution networks have radial structures which only feed from one side. A section of a sample distribution network is shown in Fig. 9 [39, 40] which assumes that three-phase radial distribution network is in balance.
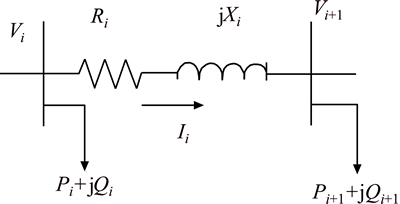
Fig. 9 Single line diagram of two consecutive buses of a distribution system
Impedance between buses i and i+1 are shown with Ri + jXi. Local loads connected in buses i and i+1 are named Pi+jQi and Pi+1+jQi+1, respectively. Vi and Vi+1 are voltages of these buses. The phasor diagram for Fig. 9 is presented in Fig. 10. KVL equation can be stated as
 (14)
(14)
Values of variables are derived from load flow. Usually in traditional networks, the buses voltage is less than 1 pu, in which case, one can assume that voltage of bus i+1 is also less than 1 pu. A DSTATCOM device is installed in this work in order to compensate voltage of bus i+1 to a desired value. As noted earlier, DSTATCOM is used for voltage regulation and loss reduction in steady state condition and can inject only reactive power to the system. Consequently, IDSTATCOM must be kept in quadrature with respect to the system voltage. As shown in Figs. 11 and 12, by installing DSTATCOM in bus i+1, currents Ii and IDSTATCOM flow in branch simultaneously.
 (15)
(15)

 (16)
(16)
Therefore  can be determined as
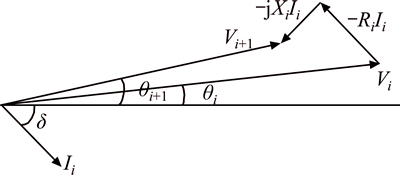
Fig. 10 Phasor diagram of voltage and current of system shown in Fig. 2
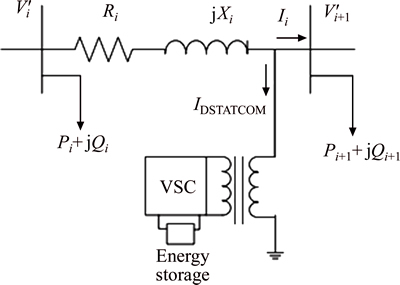
Fig. 11 DSTATCOM installation in bus i+1 of proposed distribution system
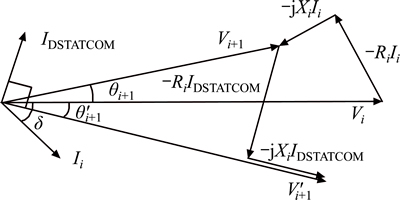
Fig. 12 Phasor diagram of voltage and current of system shown in Fig. 4
 (17)
(17)
Current magnitude of DSTATCOM can be calculated by the appropriate separated real and imaginary equations as
 (18)
(18)
Thus IDSTATCOM and voltage of common coupling bus are calculated using Eqs. (30), (31), and (22).
Finally reactive power injected to the network by DSTATCOM for voltage correction of connected bus up to  can be expressed as
 (19)
(19)
5 Problem formulation
5.1 Minimizing voltage deviation
Excessively low voltages can lead to an unacceptable service quality and can create voltage instability problems. Shunt DFACTS devices connected at the appropriate location play a leading role in improving voltage profile and avoiding the voltage collapse in the power system. Therefore, the first objective is to minimize bus voltage deviation. This objective function can be expressed as [41]
 (20)
(20)
where Vm is the voltage magnitude at bus m; Vmref is the nominal voltage of bus m and k is the number of buses for which bus voltage limit is violated. In this work, bus voltage from 0.95 pu to1.05 pu is considered acceptable. Low value of f1 indicates flat voltage profile.
5.2 Minimizing power losses
The objective to minimize power loss can be formulated as follows [42]:
 (21)
(21)
5.3 Maximizing voltage stability index
Figure 13 shows a branch of radial system. When DFACTs are connected to a distribution network, the voltage stability index is changed. This index, which can be evaluated at all of the buses in radial distribution systems, is presented in Ref. [43]. The equations used to formulate this index are presented in Ref. [44] to solve the load flow for radial distribution systems. The voltage stability index of the system is given by

 (22)
(22)
where  and
and  demonstrate total real and reactive power load fed through bus ni and these values can be modeled as a function of base power using loading factor as follows:
 (23)
(23)
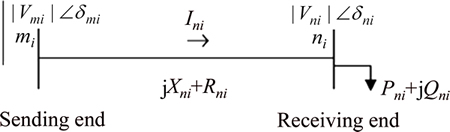
Fig. 13 A representative branch of a radial distribution system
The objective function to improve voltage stability index is
 (24)
(24)
For stable operation of the radial distribution systems, SI(ni)>0 and the maximum value of SI(ni) for ni=2, 3, ��, nn, causing a minimum value of J3, there is a feasible solution. Buses with the minimum of the voltage stability index may be unstable, and it is very important to identify weak buses. SI(ni) must be maximized for improving voltage stability [43]. As its result, the proposed objective function will be minimized.
5.4 Improving feeder load balancing
The last objective function is equalizing the feeder load balancing (LB, Lb) in distribution system [45].
 (25)
(25)
where ns is total number of sections in the system; Ik is the current passing through line k and nf is the total number of feeders.
The objective function to improve feeder load balancing index is
 (26)
(26)
The aim of optimization process is to minimize the following objective vector Linear weighted sum approach is used to transform multi-objective problem into a single-objective problem:
 (27)
(27)
5.5 OPF equations and constraints
Load balancing constraint is expressed as follows for each bus [46]:
 (28)
(28)
 (29)
(29)
5.6 Voltage constraint
Voltage lonstraint is as follows:
 (30)
(30)
where Vi is the voltage magnitude of bus i; Vmin and Vmax are the minimum and maximum voltage limits, respectively.
5.7 Current branch constraint
The current at each branch is restricted by conductor capacity ratings. These constraints can be expressed by the following equations:
 (31)
(31)
where Ii and Ii-max are the current magnitude and maximum current limit of branch i.
6 Bacterial foraging optimization
This optimization approach is based on the foraging behavior exhibited by E.coli bacteria inside human intestine. Here the bacteria undergo natural selection and the ones with poor foraging strategies are eliminated, whereas those with good foraging strategies survive. It was introduced by Passino in 2002 and further established by Mishra in 2005 for harmonic estimation in power system voltage/current waveforms. BFO mimics four principal mechanisms observed in bacteria viz. chemotaxis, swarming, reproduction and elimination�C dispersal [47].
6.1 Chemotaxis
If �� and J(��) represent the position and fitness of a bacterium, we want to find the minimum of J(��),  where we do not have measurements or an analytical description of the gradient
  Following is the three conditions:
1) J(��)<0, nutrient-rich environment;
2) J(��)=0, neutral environment;
3) J(��)>0, noxious environment.
Basically, chemotaxis is the movement of E.coli bacteria in search of nutrient rich location, away from noxious environment.
This is accomplished with the help of the locomotory organelles known as Flagella. Chemotactic movement is achieved by either of the following two ways:
1) Swimming (in the same direction as the previous step);
2) Tumbling (in an absolutely different directions from the previous one).
Suppose that ��i(j, k, l) represents the ith bacterium at the jth chemotactic, the kth reproductive and the lth elimination�Cdispersal step. Then movement of the bacterium may be mathematically represented by equation later.
 (32)
(32)
In the expression, C(i) is the size of unit step taken in a random direction and ��(i) indicates a vector in the arbitrary direction whose elements lie in [-1,1].
6.2 Swarming
This group behavior is seen in several motile species of bacteria, which helps them to propagate collectively as concentric patterns of swarms with high bacterial density while moving up in the nutrient gradient. The cell-to-cell signaling in bacterial swarm via attractant and repellant  may be modeled as equation later.


 (33)
(33)
where S indicates the total number of bacteria in the population; P is the number of variables to be optimized;  is a point in the P-dimensional search domain that represents the positions of bacteria in the swarm; and
  is the mth component of the ith bacterium position ��i. The coefficients datt, Watt, hrep and Wrep are the measures of quantity and diffusion rate of the attractant signal and the repellant effect magnitude respectively. Now, the resulting objective function becomes:
 (34)
(34)
6.3 Reproduction
The fitness value for the ith bacterium after travelling Nc chemotactic steps can be evaluated by the following equation:
 (35)
(35)
where  represents the health of the ith bacterium. The least healthy bacteria constituting half of the bacterial population (Sr) are eventually eliminated, while each healthier bacterium is asexually reproduced by splitting into two, which are then placed in the same location. Ultimately, the population remains constant. If S number of bacteria constitutes the population, then
 (36)
(36)
6.4 Elimination and dispersal
It is possible that the local environment where bacterial population lives changes either gradually via consumption of nutrients or suddenly due to some other influence such as significant heat rise.
Following this behavior, BFO algorithm makes some bacteria to get eliminated and dispersed with probability Ped after Nre number of reproductive events. This is to ensure that the bacteria do not get trapped into local optima instead of global optimum.
7 Enhanced bacterial foraging optimization
Taking into consideration all the drawbacks and advantages of PSO and BFO algorithms, an enhanced BFO algorithm is developed here that has the combined advantages of BFO and PSO, and is also capable of overcoming the limitations in both. The performance of PSO is degraded in problems with multiple optima owing to a phenomenon called premature convergence, where the particles tend to converge and ultimately get trapped in a local best position as the global best remains undiscovered [48-50]. Enhanced BFO overcomes this drawback through elimination�Cdispersal of bacteria, thereby ensuring convergence to global optimum. Furthermore, the movement of individuals in traditional BFO algorithm is not defined in any specific direction. Random search directions delay the convergence to global solution. However, unlike BFO, at any particular instant in PSO each particle memorizes its own best solution (local best) as well as the best solution of entire swarm (global best) owing to the memory it possesses. Thereby, velocity and direction of particles are obtained as outcome of their social interactions and memory storage capability. This characteristic of PSO is incorporated in enhanced BFO that improves search efficiency, global optimum solution accuracy and convergence speed, which are the key attributes of an optimization algorithm. In enhanced BFO, the chemotaxis, swarming, reproduction, and elimination�C dispersal events carried out in BFO realizing cell-to-cell communication, survival of the fittest, elimination of least healthy bacteria in the population, and exploration of new search areas are supplemented with the ability of PSO to exchange social information and possession of adaptable particle velocity. Hence, this algorithm yields relatively more optimized result compared to BFO and PSO implemented alone. The mechanism of enhanced BFO and the iterative algorithm realizing this mechanism are presented below in detail. A flowchart of the entire enhanced BFO technique is depicted in Fig. 14.
8 Mechanism of enhanced bacterial foraging optimization
In the beginning of search process, a group of bacteria are randomly dispersed all throughout the search space. Each bacterium is assigned with an arbitrary particle velocity. Fitness values of the bacteria are calculated by taking into consideration the cell-to-cell swarming effect. For the initial population, the local best and global best positions are figured out in exactly the same way as done in PSO. In order to update the positions of individuals, chemotaxis is carried out, which utilizes a velocity factor obtained from the velocity update expression used in PSO. After each chemotactic step, fitness value of each particle is calculated. During the search, reproduction and elimination�Cdispersal events of BFO are also executed. For reproduction, half of the bacterial population with least health is eliminated, while rest half of the population asexually reproduces by each of them splitting into two. Ultimately, the population size remains constant. To simulate elimination�Cdispersal phenomenon, some bacteria are liquidated at random with a very small probability, while the new replacements are randomly initialized over the search space. At the end of search process, the bacteria reach the global optimum position.
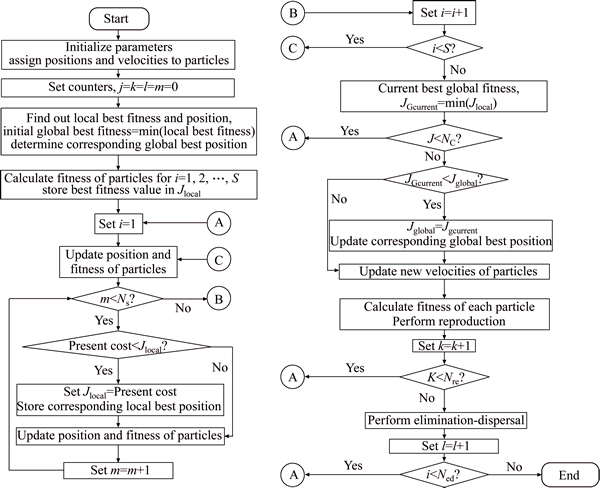
Fig. 14 Enhanced bacterial foraging optimization algorithm
9 Iterative algorithm for enhanced bacterial foraging optimization
Step 1: Initialization. To begin with, all the parameters related to proposed algorithm are initialized. Each particle in the group is assigned with a random initial position ��(i) and an initial velocity v which is a random number in the interval [-1, 1] with elements 
Step 2: Preliminary assessment of bacterial population.
(a) For i=1, 2, 3, ��, S, current fitness  of each bacterium in the search space is determined:
 (37)
(37)
(b) In the beginning of search process, since the bacterial movement is not yet started, the local best fitness  and local best position
  of each bacterium are its current fitness value and current position respectively, i.e.
 (38)
(38)
(c) The initial global best fitness of the population is the minimum value of fitness possessed by any of the particle in the population and can be given by
 (39)
(39)
where i =1, 2, ��, S.
The position corresponding to Jglobal is assigned the global best position 
Step 3: Iterative algorithm.
(a) Initially, the counters for chemotactic loop (j), reproduction loop (k), elimination dispersal loop (l), and counter for swim length (m) are all set to zero.
(b) Taking into account the cell-to-cell attractant effect, the cost function estimated for each of the i=1, 2, ��, S bacteria is calculated as

(40)
 (41)
(41)
The best cost function value is stored in Jlast until a further better cost is obtained and the best cost of each bacterium is updated as
 (42)
(42)
(c) Chemotactic loop: Starting with i=1, the position and cost function for all the S number of bacteria in the entire population are updated as
 (43)
(43)
while m<>s, if  then set

Updating position and cost function, we get using Eq. (40), the current position (xcurrent) of each bacterium can be given by
 (44)
(44)
The position corresponding to local best fitness is stored in 
Increase the counter as, m=m +1.
End the while loop.
To proceed to next bacterium, set i=i+1 until i=S.
(d) In each chemotactic step, calculate the current global best fitness function value (JGcurrent) and continue the chemotactic loop if still j<>c.
 (45)
(45)
where i =1, 2, ��, S.
If  set
set  The global best position
  is updated with the position corresponding to
The particles update their new velocities and directions by the equation,

 (46)
(46)
(f) Reproduction: The health of each bacterium is calculated using the expression given below and then sorted in ascending order of cost function.
 (47)
(47)
Sr is the number of least healthy bacteria that are discarded out of the population and individuals with best health are split in to two, keeping the population size constant.
(g) If k<>re, continue with the next reproductive iteration by setting, k=k+1.
The entire iterative process is executed repeatedly until the specified number of reproductive steps (generations) are executed.
(h) Elimination�Cdispersal loop: With a probability of Ped, the elimination�Cdispersal event is performed to ease the exploration of new search areas that may lead to better optimal solution.
If elimination�Cdispersal loop counter l<>ed, execute successive elimination�Cdispersal events with the increment of counter l after each iteration.
Terminate the iterative process when the counter l reaches its maximum specified value, i.e., the number of elimination�Cdispersal events Ned.
10 Application of EBFO for DFACTs design
We should classify the coding program into four different categories as follows:
1) Single-type allocation;
2) Multiple-type allocation.
Based on the two above categories, we will have different types of bacterial for the EBFO algorithm optimization process. For example, in first category the typical individuals are shown in Fig. 15.

Fig. 15 Typical example of individual of single-type DFACTS device allocation
It is clear from Fig. 15 that the first part of each individual��s string is related to DFACTS location (for example DSTATCOM location) and the second part is related to optimal value corresponded to optimal position.
In the second category, the typical individuals are shown in Fig. 16.
It is clear from Fig. 16 that the first part of each individual��s string is related to the DFACTS type. For each specific DFACTS device there is a specific code, namely, 1 for APC, 2 for DSSSC and 3 for DSTATCOM.
For example in the second category, the following combination was selected by the GUI user as the input DFACTS device types with corresponding numbers: DSSSC (1), APC (2) and DSTATCOM (1), four DFACTS devices from three different DFACTS types.
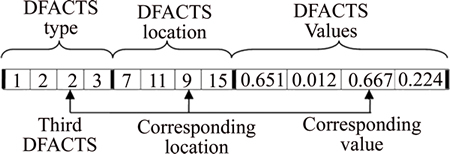
Fig. 16 Typical example of an individual of multi-type DFACTS device allocation
In the examples of Fig. 16, since we have four DFACTS devices, the DFACTS types shown in the individual��s string have four columns. The number of total columns of each individual��s string can be calculated by 2n for the first category and by 3n for the second category.
The second slot of each individual��s string corresponds to the locations associated with the first slot in the string. Each specific DFACTS device has its own location. Repeated locations are not allowed in our optimization process and each line or bus should appear only once in the string.
The third and last part of the individual��s string include the rating values of the DFACTS devices, which are normalized between 0 and 1 with 0 corresponding to the minimum value of the device and 1 to the maximum.
The prime steps of EBFO applied to minimize the objective function are as follows.
Step 1: Initialization of EBFO parameters;
Let m be the index for the chemotactic step. Let k be the index for the reproduction step. Let l be the index of the elimination-dispersal event. Let q be the index for the iteration loop. Also p is the dimension of the search space; number of DFACTs and its locations and sizes are determined to minimize the objective function. The loss sensitivity factors are calculated from the load flows and sorted in descending orders. For 33-bus test system, the first part of the dimension signifies the bus location where DFACT is installed among candidate buses, so the first part of the dimension is p=4 and the second part signifies the DFACT type at the selected candidate buses. The code 1 is corresponded to DSSS type; the code 2 is corresponded to APC type; The code 3 is corresponded to DSTATCOM type; So, the second part of the dimension is p=3. The third part of the dimension signifies the DFACT values at the selected candidate buses p=4. P1, P2, P3, P4 are DFACT locations; P5, p6, p7 are of DFACT types; P8, P9, P10 and P11 are of DFACT sizes.
The base power loss and voltages at all nodes without and with DFACTs are calculated from the power flow.
Step 2: Iteration loop: q=q+1;
Step 3: Chemotaxis loop: m=m+1;
Step 4: Reproduction loop: k=k+1;
Step 5: Elimination-dispersal loop: l=l+1.
11 Graphical user interface description: DFACTs placement toolbox
The overall view of the implemented GUI is presented in Fig. 17. To start, the user should choose between single and multiple type custom power device allocation, followed by the type and number of custom power device to be allocated (Five types including: DSSSC, APLC, DSTATCOM, DVR, DUPFC). The next step is to determine the genetic algorithm settings which are number of generations, initial population size, number of elite children, and ratio of crossover fraction, fitness limit and time limit.
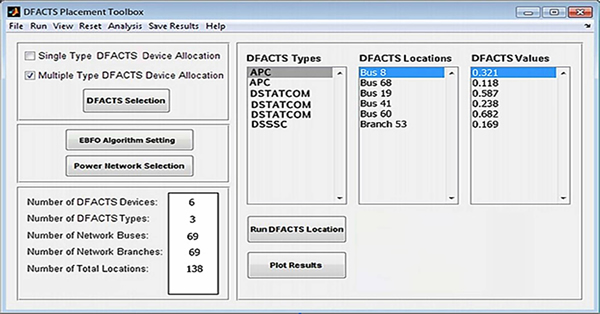
Fig. 17 Main graphical user interface of DFACTS placement toolbox
Finally, the user can pick a network among several IEEE test systems whose complexity at present ranges from 4 to 300 buses.
The EBFO repeatedly modifies a population of individual solutions. At each step, some individuals are randomly selected from the current population for the next generation. Over successive generations, the population evolves toward an optimal solution [39, 40].
The EBFO begins by creating a random initial population. To take an example, assume the two individuals in Fig. 16 as an initial population (it is assumed that the type of custom power device to be allocated is five-type including DSSSC, APLC, DSTATCOM, DVR and DUPFC. The algorithm then creates a sequence of new populations. This is done by ranking the members of the current population according to their fitness values.
Some of the individuals in the current population that have the best fitness value are chosen and so are passed on to the next population.
The flowchart of the DFACTS device placement procedure using the implemented GUI is depicted in Fig.18.
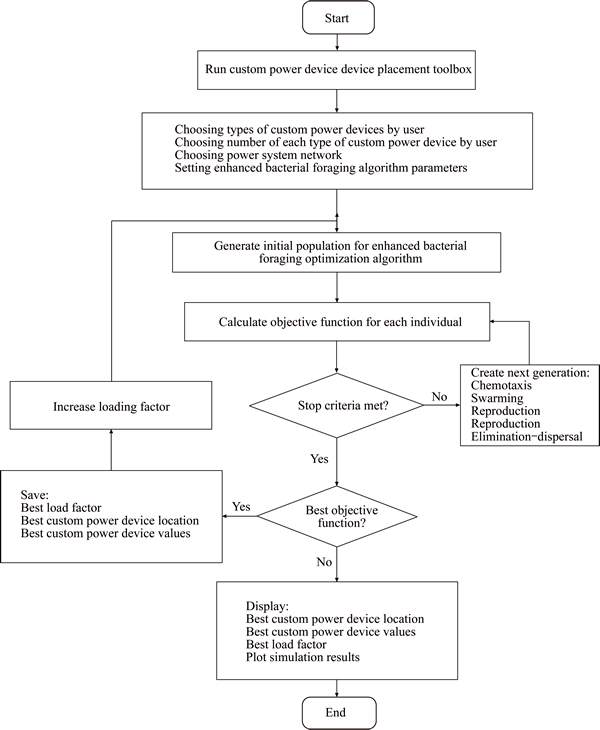
Fig. 18 Flowchart of overall procedure of DFACTS placement toolbox
12 Simulation and results
12.1 Analyzing DFACTs allocation in small system for selecting best method
At first, in order to select a suitable searching method, a small scale system with 12 buses has been considered and DFACTS placement and sizing problem were solved using four intelligent methods including GA, PSO, BFO and EBFO.
The simulation results of this analysis show the significant computational time reduction and faster convergence of EBFO in comparison with GA, PSO and BFO. Therefore, in large scale radial system with 33 and 69 buses, the proposed problem is solved using EBFO.
The GA, PSO, BFO and the EBFO algorithms are applied to obtain optimal solution of DFACTs problem for as follows:
Scenario 1: Single-type allocation using DSSC.
Scenario 2: Single-type allocation using DSTATCOM.
Scenario 3: Single-type allocation using APC.
Scenario 4: Multiple-type allocation. In this case, the user has not decided to select a special DFACTS and the program detects the type of DFACTS at their optimal location.
The 12-bus test system is chosen for a detailed presentation to demonstrate how the different modules of the GUI work. Pushing the ��Run DFACST Location�� button in Fig. 17 starts the allocation process and we would see the DFACTS placement results of 33-bus test system presented in Table 1. Finally, pushing the ��Plot Results�� button in Fig. 17 produces comparative figures. To save space, we present just four typical results, including bus voltages of the networks with and without FACTS devices.
Figure 19 shows the active power loss of proposed method for different scenarios in a 12-bus distribution test system. The multiple-type allocation shows more reduction in power losses.
Figure 20 shows the voltage profiles comparison of 12-bus IEEE test system before and after optimal single-type and multiple-type DFACTS allocation. The voltage profile is obviously improved after the multiple- type allocation.
Table 2 gives the comparison results for DFACTS placement using the proposed method in 12-bus IEEE test system.
The computational time using BFO and EBFO is approximately 400 ms and using GA and PSO it is 600 ms. The time is system dependent, in our case Intel Core 2 duo, T5800 @ 2 GHz. The convergence of the solutions to optimal cost is shown in Fig. 21.
In Table 3, the comparison results of proposed method based on the power loss, maximum and minimum bus voltage, cost iterations number, computational time using mentioned intelligent methods are shown.
One of the conventional methods of solving this problem is lambda-iteration method but owing to tedious calculations and its inability to solve multi-modal and discontinuous problems. Novel techniques have replaced it. The optimal cost of small scale problem is found out to be 22861 US dollar using lambda iteration method, while as shown in Table 3 the optimal cost is calculated as 28879, 25220, 23700 and 23235 US dollar using GA, PSO, BFO and EBFO, respectively.
Also as listed in Table 3, the EBFO result to optimize the total cost is closer to the result of lambda iteration method. As shown in Table 3, a total of 680, 420, 436 and 350 iterations respectively were required to converge to the optimal solution for the problem using GA, PSO, BFO and EBFO, respectively. It is to be noted that the number of iterations for EBFO is actually the number of chemotactic steps and cannot be directly compared with the number of iterations for GA, PSO and BFO. The final computational time has been obtained by averaging the times for 1000 runs.
Table 1 DFACTS placement toolbox results of 12-bus test system with DFACTS number of 2
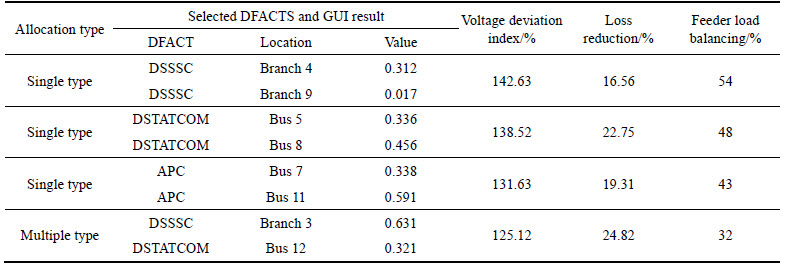
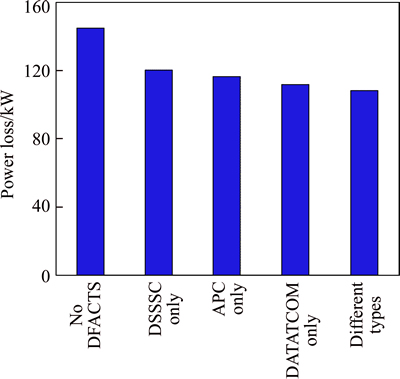
Fig. 19 Comparison of different cases of proposed method for loss reduction in a 12-bus system
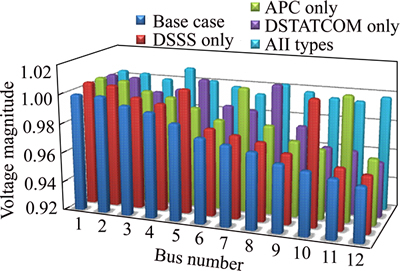
Fig. 20 Comparison of voltage profile in 12-bus test system
Table 2 Comparison results for DFACTS placement using proposed method in 12-bus IEEE test system
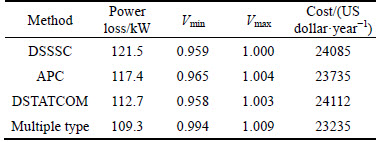
The test results show that EBFO algorithm converges to optimal cost with reduced computational time when compared to GA, PSO and BFO. This is primarily due to the dispersal feature in EBFO that introduce randomness during the optimization process results in significant computational time reduction.
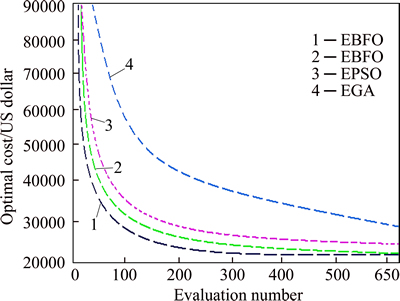
Fig. 21 Cost function vs number of iterations for 12-bus system
In Fig. 22, the comparison of four mentioned optimization approaches for DFACTs allocation problem from point of views accuracy, computational time and convergence speed are analyzed, which indicates the more ability of EBFO compared to other methods.
12.2 DFACTs allocation in 33-bus system using EBFO-based toolbox
The 33-bus test system is chosen for a detailed presentation to demonstrate how the different modules of the GUI work. In this simulation, the following combination is selected by the GUI user as the input DFACTS device types with corresponding numbers, DSSSC (1), APC (2) and DSTATCOM (1). Pushing the ��Run DFACST Location�� button in Fig. 17 starts the allocation process and we would see the DFACTS placement results of 33-bus test system presented in Table 4.Finally, pushing the ��Plot Results�� button in Fig. 17 produces comparative figures. To save space, we present just four typical results, including bus voltages of the networks with and without FACTS devices.
In this section, the influence of different combinations of DFACTS devices, multiple type or single type, with different numbers of each, is verified using the EBFO-based toolbox. The standard IEEE test system (33-bus) test system is chosen as the base case for this study. The same analysis could have been done on other networks using the implemented toolbox. The results of 33-bus are presented in Table 4. The loss reduction values in Table 4 as a fraction of base case��s power loss for four of the configurations studied, are as follows.
Table 3 Comparison results for DFACTS placement using proposed method in 12-bus IEEE test system
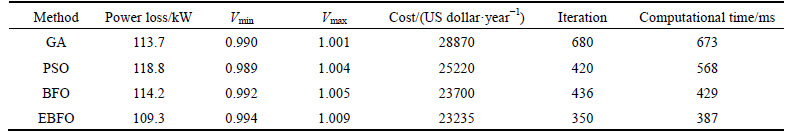
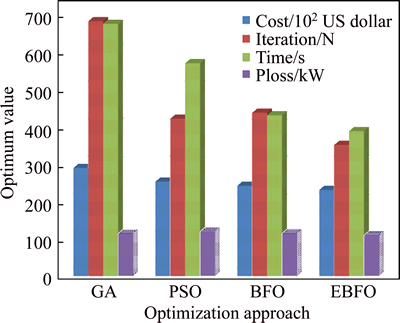
Fig. 22 Comparison results of four optimization approaches for 10-bus test system
For scenario 1 by single-type allocation of DSSSC in 33-bus test system, the power loss reduction is 47.16%; for scenario 2 by single-type allocation of DSTATCOM this value is 65.42%; for scenario 3 by single-type allocation of APC this value is corresponded to 55.43% and finally for scenario 4 by multiple-type allocation of DFACTS, the power loss reduction is 73.57% which has the most effective in power loss reduction compared to other configurations studied.
The voltage deviation index with DFACTS devices is also presented in the last column of Table 4. Voltage deviation index results of different scenarios are 142.63, 138.52, 131.63, and 125.12 for scenarios 1 to 4 respectively.
The results of scenario 1 for the 33-bus test system indicate four small DSSSCs (0.312, 0.017, 0.578 and 0.768) used in the optimal case which are placed on branches 6, 9, 15 and 31, respectively.
The results of scenario 2 for the 69-bus test system indicates four small DSTATCOMs (0.336, 0.456, 0.653 and 0.021) used in the optimal case which are placed on buses 9, 15, 19 and 23, respectively.
The results of scenario 3 for the 69-bus test system indicate four small APCs (0.338, 0.582, 0.437 and 0.591) used in the optimal case which are placed on buses 6, 13, 19 and 27, respectively.
The results of scenario 4 indicate four small DFACTs including one DSSSC with value 0.631 which is placed on branches 7, two APCs with values (0.019 and 0.618) which are placed on buses (7,11) and one DSTATCOM with value 0.321 pu, which is placed on bus 15 respectively.
Figure 23 shows the active power loss of proposed method for different scenarios in a 33-bus distribution test system. The multiple-type allocation shows more reduction in power losses compared with single-type allocation. Also the most power loss reduction using single-type allocation is achieved in scenario 3 through DSTATCOM allocation.
Figure 24 shows the voltage profiles comparison of 33-bus IEEE test system before and after optimal single-type and multiple-type DFACTS allocation. The voltage profile is obviously improved after the multiple- type allocation.
Table 4 DFACTS placement toolbox results of 33-bus test system with DFACTS number of 4
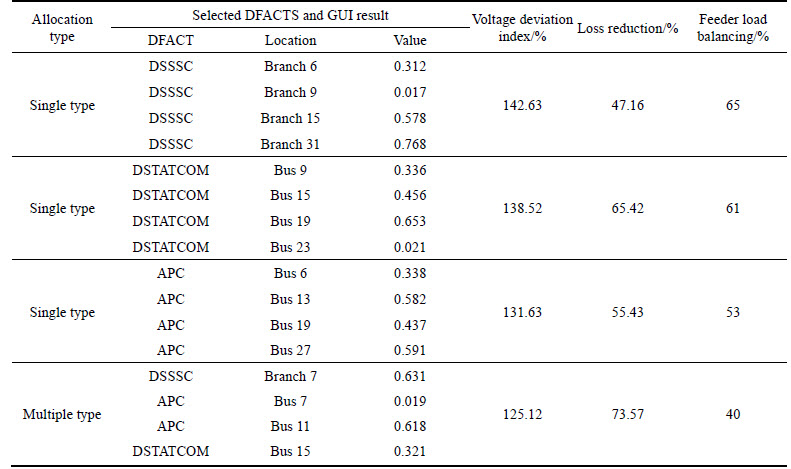
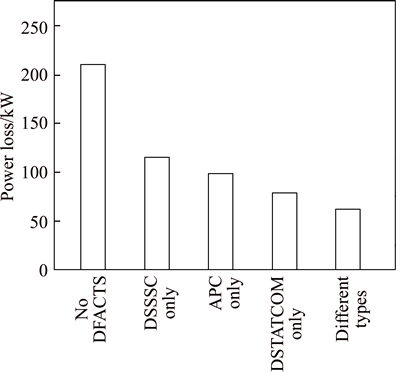
Fig. 23 Comparison of different cases of proposed method for loss reduction in a 33-bus system
Comparing all cases in Fig. 24, we can find that the buses which inject multiple DFACTS have the improvement in voltage magnitude. For example, the voltage of 65-bus system improves from 0.9118 in case 1 to 0.9713 in case 4.
Voltage stability index values can be modeled as a function of base power using loading factor as follows. Under variation of loading factor in the stable zone, the variation of power loss as a function of loading factor for different case studies in 69-bus test system is shown in Fig. 25. These results show that the power loss changes of system in scenario 4 with presence of multiple-type DFACTS as a function of loading factor in the stable zone is a smooth line whereas in other states, this function is similar to a parabola curve.
As seen in Fig. 25, it is obvious that when loading factor varies from 1 to 2, the additional power loss which incurred by system is about 68 kW for base case, about 50 kW for scenario 1, about 40 kW for scenario 2, about for 35 kW for scenario 3, and about 21 kW for scenario 4.
12.3 DFACTs allocation in 69-bus system using EBFO-based toolbox
In another study, the 69-bus test system is chosen for a detailed presentation to demonstrate how the different modules of the EBFO-based GUI work. In this simulation, the following combination was selected by the GUI user as the input DFACTS device types with corresponding numbers: DSSSC (1), APC (2) and DSTATCOM (3).
As seen in Table 5, the results are compared through the four scenarios.
The reduction of distribution feeder losses in the network and voltage deviation index with DFACTS devices is also presented in the last column of Table 5.
The results of scenario 1 for the 69-bus test system indicate that the power loss has been reduced to 135.5 kW, namely 38.92% compared to the initial condition of the network the power loss has been reduced. Voltage deviation index shows the value of 134.84 in this case. Six small DSSSCs (0.134, 0.372, 0.027, 0.621, 0.085 and 0.153) are used in the optimal case which are placed on branches 11, 16, 24, 32, 44, and 64, respectively.
The results of scenario 2 for the 69-bus test system indicate that the power loss has been reduced to 102.13 kW, namely 53.72% compared to the initial condition of the network the power loss has been reduced. Voltage deviation index shows the value of 123.32 in this case. Six small DSTATCOMs (0.562, 0.1947, 0.042, 0.032, 0.227 and 0.243) are used in the optimal case which are placed on buses 6, 17, 28, 33, 43 and 55, respectively.
The results of scenario 3 for the 69-bus test system indicate that the power loss has been reduced to 79.63 kW, namely 62.74% compared to the initial condition of the network the power loss has been reduced. Voltage deviation index shows the value of 128.43 in this case. Four small APCs (0.651, 0.712, 0.061, 0.157, 0.683 and 0.411) are used in the optimal case which are placed on buses 9, 11, 25, 41, 49 and 63, respectively.
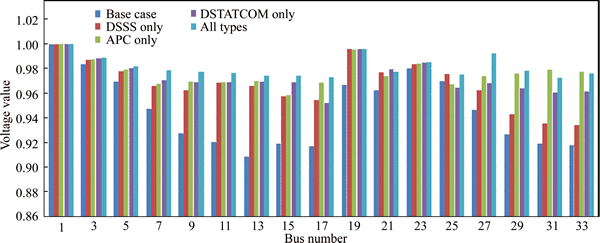
Fig. 24 Comparison of voltage profile in a 33-bus test system
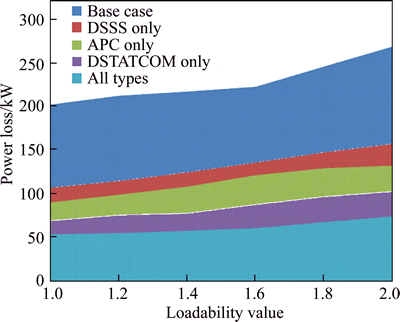
Fig. 25 Power loss changes as function of loading factor for 33-bus system
The results of scenario 4 for the 69-bus test system indicate that the power loss has been reduced to 68.23 kW, namely 69.52% compared to the initial condition of the network the power loss has been reduced. Voltage deviation index shows the value of 132.43 in this case. Six small DFACTSs including one DSSSC, two APCs and three DSTATCOMs with values (0.169, 0.321, 0.118, 0.587, 0.238 and 0.682) are optimal placed on branch 53, buses 8, 68, 19, 41 and 60, respectively.
Figure 26 shows the active loss reduction of proposed method for different scenarios in a 69-bus distribution test system. The multiple-type allocation shows more reduction in power losses compared with single-type allocation. As shown in Table 6, the most power loss reduction using single-type allocation is achieved using APC allocation.
Figure 27 shows the voltage profiles of 69-bus IEEE test system before and after optimal single-type and multiple-type DFACTS allocation. The voltage profile is obviously improved after the multiple-type allocation.
Table 5 DFACTS placement toolbox results of 69-bus test system with DFACTS number of 6
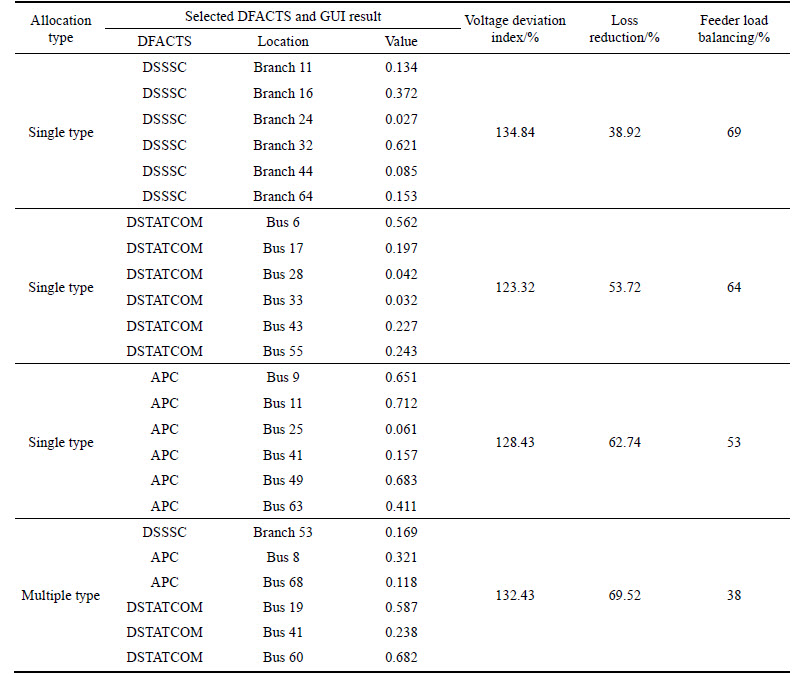
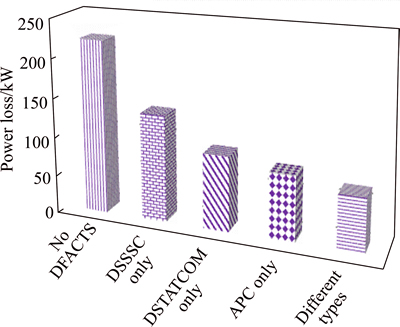
Fig. 26 Comparison of different cases of proposed method for loss reduction in a 69-bus system
In case 1 (base case), the minimum bus voltage of the system versus per unit is 0.9118, which occurs at bus 65, while using single-type allocation of DSSSC (case 2) the minimum bus voltage of the system is 0.9374, which occurs at bus 61.
In case 3, using the single-type allocation of DSTATCOM the minimum bus voltage of the system is 0.9352, which occurs at bus 61.
In case 4, using the single-type allocation of APC the minimum bus voltage of the system is 0.9313, which occurs at bus 65; while in case 5 using the multiple-type allocation of DFACTS the minimum bus voltage of the system is 0.9713, which occurs at bus 65. This indicates that in case 5 the voltage profile is improved greatly.
Voltage stability index values can be modeled as a function of base power using loading factor as follows.Under variation of loading factor in the stable zone, the variation of power loss as a function of loading factor for different case studies in 69-bus test system is shown in Fig. 28.
As seen in Fig. 28, it is obvious that in the presence of multiple-type allocation of DFACTS, the variation of power loss under variation of loading factor is a liner function with much low slope, so that with variation of loading factor between 1 to 2, the power loss changes between 68.23 kW and 87.1 kW whereas in other states, the power loss changes between 221.78 kW and 312.87 kW in base case, between 135.51 kW and 197.26 kW in scenario 1, and between 95.12 kW and 125.2 kW in scenario 2 and changes between 82.62 kW to 142.23 kW in scenario 3. These results show that the power loss changes of system in scenario 4 in the presence of multiple-type DFACTS as a function of loading factor in the stable zone is a smooth line whereas in other states, this function is similar to a parabola curve.
13 Conclusions
1) This work focuses on the single type and multiple type implementations of distribution FACTS devices, DFACTS in distribution system. This is considered a multi-objective problem in which four objective functions including the maximization of voltage stability, power loss reduction and minimization of voltage deviation and equalizing the feeder load balancing in distribution system are investigated in this research.
2) At first, in order to select a suitable searching method, a typical small scale system (12-bus) has been considered and DFACTS placement and sizing problem are solved using four intelligent methods including GA, PSO, BFO and EBFO. The simulation results show that EBFO algorithm converges to optimal cost with reduced computational time compared to GA, PSO and BFO.
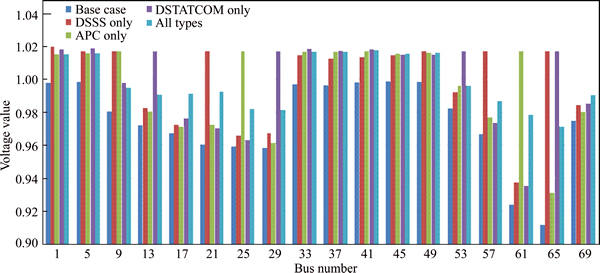
Fig. 27 Comparison of voltage profile in 69-bus test system
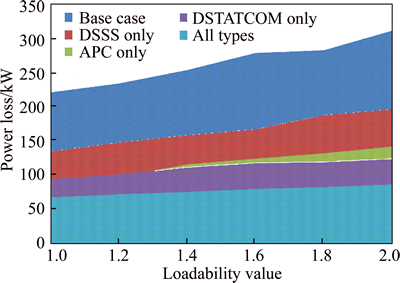
Fig. 28 Power loss changes as function of loading factor for 33-bus system
3) In the next step, a graphical user interface (GUI) based on an enhanced bacterial foraging optimization (EBFO) is proposed to solve the single type and multiple type allocation of DFACTS in medium scale (33 bus) and large scale (69 bus) distribution system. To start, the user should choose between single and multiple DFACTS allocation, followed by the type and number of them to be allocated (Three types including DSSSC, APC and DSTATCOM).
4) Simulation results conclude that the EBFO based multiple DFACTS allocation using DSSSC, APC and DSTATCOM is preferable to reduce power losses, improve load balancing and enhance voltage deviation index to 70%, 38% and 132%, respectively and also it can improve loading factor without additional power loss.
Acknowledgments
This work was supported by Islamic Azad University, Borujerd Branch, Iran. The authors would like to acknowledge staffs of University.
References
[1] MENDOZA JORGE E, HECTOR E. Automatic voltage regulators siting in distribution systems considering hourly demand [J]. Electric Power System Research, 2011, 81: 124-1131.
[2] ARUN M, ARAVINDHABABU P. Fuzzy based reconfiguration algorithm for voltage stability enhancement of distribution systems [J]. Expert System with Application, 2010, 37: 6974-6978.
[3] FARHOODNEA M, MOHAMED A, SHAREEF H, ZAYANDEHROODI H. A comprehensive review of optimization techniques applied for placement and sizing of custom power devices in distribution networks [J]. Przegl  Elektrotechniczny (Electrical Review), 2012, 88: 261-265.
[4] PHADKE A R, FOZDAR M, NIAZI K R. A new multi- objective fuzzy-GA formulation for optimal placement and sizing of shunt FACTS controller [J]. International Journal of Electrical Power and Energy System, 2012, 40: 46-53.
[5] HOSSEINI M, SHAYANFAR H A, FOTUHI-FIRUZABAD M. Modeling of series and shunt distribution FACTS devices in distribution systems load flow [J]. Journal of Electrical System, 2008, 4(4): 1-12.
[6] KALANTAR M. Active power line conditioner optimum placement using fuzzy controller [C]// IFSA World Congress and 20th NAFIPS International Conference. Vancouver, British Columbia, Canada: IEEE, 2001, 241: 245-250.
[7] CHANG C S, ZHEMIN Y. Distributed mitigation of voltage sags by optimal placement of series compensation devices based on stochastic assessment [J]. IEEE Transactions on Power System, 2004, 19: 788-795.
[8] SALMAN N, MOHAMED A, SHAREEF H. Reliability improvement in distribution systems by optimal placement of DSTATCOM using binary gravitational search algorithm [J]. Przegl Elektrotechniczny (Electrical Review), 2012, 88: 295-299.
[9] TAHER S A, AFSARI S A. Optimal location and sizing of UPQC in distribution networks using differential evolution algorithm [J]. Mathematical Problems in Engineering, 2012, 2012: 1-20.
[10] FARHOODNEAA M, MOHAMEDA A, SHAREEF H, ZAYANDEHROODI H. Optimum placement of active power conditioner in distribution systems using improved discrete firefly algorithm for power quality enhancement [J]. Applied Soft Computing, 2014, 23: 249-258.
[11] ZIARI I, JALILIAN A. Optimal placement and sizing of multiple APLCs using a modified discrete PSO [J]. International Journal of Electrical Power and Energy System, 2012, 43: 630-639.
[12] TAHER S A, AFSARI S A. Optimal location and sizing of DSTATCOM in distribution systems by immune algorithm [J]. International Journal of Electrical Power and Energy System, 2014, 60: 34-44.
[13] DEVI S, GEETHANJALI M. Optimal location and sizing of distribution static synchronous series compensator using particle swarm optimization [J]. International Journal of Electrical Power and Energy System, 2014, 62: 646-653.
[14] VALIPOUR K, DEHGHAN E, SHARIATKHAH M.H. Optimal placement of capacitor banks and distributed generation for losses reduction and voltage THD improvement in distribution networks based on BBO algorithm [J]. IRJABS: International Research Journal of Applied Basic Science, 2013, 4(7): 1663-1670.
[15] MIRHOSEINI S H, HOSSEINI S M, GHANBARI M, AHMADI M. A new improved adaptive imperialist competitive algorithm to solve the reconfiguration problem of distribution systems for loss reduction and voltage profile improvement [J]. International Journal of Electrical Power and Energy System, 2014, 55: 128-143.
[16] MOHAMMAD H M, ZEINALZADEH A, MOHAMMADI Y, ABEDINI M. An efficient hybrid method for solving the optimal sitting and sizing problem of DG and shunt capacitor banks simultaneously based on imperialist competitive algorithm and genetic algorithm [J]. International Journal of Electrical Power and Energy System, 2014, 54: 101-111.
[17] SZUVOVIVSKI I, FRENANDES T S P, AOKI A R. Simultaneous allocation of capacitor and voltage regulators at distribution networks using genetic algorithms and optimal power flow [J]. International Journal of Electrical Power and Energy System, 2012, 40(1): 62-69.
[18] TORRES J, GUARDADO J L, F, MAXIMOV S, MELGOZA E. A genetic algorithm based on the edge window decoder technique to optimize power distribution systems reconfiguration [J]. International Journal of Electrical Power and Energy System, 2013, 45(1): 28-34.
[19] SULTANA S, KUMAR ROY P. Optimal capacitor placement in radial distribution systems using teaching learning based optimization [J]. International Journal of Electrical Power and Energy System, 2014, 54: 387-398.
[20] NIKNAM T, GOLESTANEH F, SADEGHI M S. multiobjective dispatch teaching�Clearning-based optimization for dynamic economic emission [J]. IEEE Systems Journal, 2012, 6(2): 341-352.
[21] SAHOO N C, PRASAD K. A fuzzy genetic approach for network reconfiguration to enhance voltage stability in radial distribution systems [J]. Energy Conversion and Management, 2006, 47: 3288-3306.
[22] PRASAD P V, SIVANAGARAJU S, SREENIVASULU N. A fuzzy-genetic algorithm for optimal capacitor placement in radial distribution systems [J]. ARPN Journal of Engineering and Applied Sciences, 2007, 2(3): 28-32.
[23] MORADI M H, ABEDINI M. A combination of genetic algorithm and particle swarm optimization for optimal DG location and sizing in distribution systems [J]. International Journal of Electrical Power and Energy System, 2012, 34(1): 66-74.
[24] YILDIZ A R. A novel hybrid immune algorithm for global optimization in design and manufacturing [J]. Robotics and Computer-Integrated Manufacturing, 2009, 25: 261-270.
[25] YILDIZ A R. An effective hybrid immune-hill climbing optimization approach for solving design and manufacturing optimization problems in industry [J]. Journal of Materials Processing Technology, 2009, 209: 2773-2780.
[26] YILDIZ A R. A new hybrid artificial bee colony algorithm for robust optimal design and manufacturing [J]. Applied Soft Computing, 2013, 13: 2906-2912.
[27] TABATABAEI S M, VAHIDI B. Bacterial foraging solution based fuzzy logic decision for optimal capacitor allocation in radial distribution system [J]. Electric Power System Research, 2011, 81: 1045-50.
[28] SAADAT H. Power system analysis [M]. 2nd ed. London: McGraw-Hill Higher Education, 2009.
[29] JEN-HAO T, CHUO-YEAN C. Backward/forward sweep-based harmonic analysis method for distribution systems [J]. IEEE Transaction on Power Delivery, 2007, 22: 1665-1672.
[30] TENG J. A network topology based three-phase load flow for distribution systems [J]. Proceedings of National Science Council of China, Part A: Physical Science and Engineering, 2000, 24(4): 259-264.
[31] JAZEBI S, HOSSEINIAN S.H, VAHIDI B. DSTATCOM allocation in distribution networks considering reconfiguration using differential evolution algorithm [J]. Energy Conversion and Management, 2011, 52: 2777-2783.
[32] DEVI S, GEETHANJALI M. Optimal location and sizing determination of Distributed Generation and DSTATCOM using particle swarm optimization algorithm [J]. International Journal of Electrical Power and Energy System, 2014, 62: 562-570.
[33] GHAZI R, KAMAL H. Optimal size and placement of DVR's in distribution system using simulated annealing [C]// 18th International Conference and Exhibition on Electricity Distribution (CIRED 2005). 2005: 75-82.
[34] BLAZIC B, PAPIC I. A new mathematical model and control of DSTATCOM for operation under unbalanced conditions [J]. Electric Power System Research, 2004, 72(3): 279-287.
[35] HINGORANI N. Introducing custom power [J]. IEEE Spectrum, 1995, 32(6): 41-48.
[36] NILSSON S. Special application consideration for custom power systems [C]// IEEE Conference of Power Engineering Society. New York: IEEE, 1999, bol.2: 1127-1130.
[37] ADYA A. Application of DSTATCOM for isolated system [C]// IEEE Region 10 Conference. New York: IEEE, 2004, 3: 351-354.
[38] GHOSH S, DAS D. Method for load-flow solution of radial distribution networks [J]. IEE Proceedings on Generation Transmission Distribution, 1999, 146(6): 641-648.
[39] HOSSEINI M, SHAYANFAR H A, FOTUHI M. Modeling of series and shunt distribution facts devices in distribution load flow [J]. Journal of Electrical System, 2008, 4(4): 1-12.
[40] ACHA E, FUERTE-ESQUIVEL C R, AMBRIZ-PEREZ H, ANGELES-CAMACHO C. FACTS modeling and simulation in power networks [M]. New York: Wiley, 2004.
[41] ZIARI I, LEDWICH G, GHOSH A, CORNFORTH D, WISHART M. Optimal location and sizing of capacitors to minimize the transmission line loss and to improve the voltage profile [J]. Computers and Mathematics with Applications, 2010, 60: 1003-1013.
[42] SRINIVASAS RAO R, NARASIMHAM S V L, RAMALINGARAJU M. Optimal capacitor placement in a radial distribution system using plant growth simulation algorithm [J]. International Journal of Electrical Power and Energy System, 2011, 33: 1133-1139.
[43] CHARKRAVORTY M, DAS D. Voltage stability analysis of radial distribution networks [J]. International Journal of Electrical Power and Energy System, 2001, 23(2): 129-135.
[44] VOVOS P N, BIALEK J W. Direct incorporation of fault level constraints in optimal power flow as a tool for network capacity analysis [J]. IEEE Transactions on Power System, 2005, 20(4): 2125-2134.
[45] BARAN M E, WU F. Network reconfiguration in distribution system for loss reduction and load balancing [J]. IEEE Transactions on Power Delivery, 1989, 4(2): 1401-1407.
[46] KUMAR A, GAO W. Optimal distributed generation location using mixed integer non-linear programming in hybrid electricity markets [J]. IET Generation Transmission Distribution, 2010, 4(2): 281-298.
[47] PASSINO K M. Biomimicry of bacterial foraging for distributed optimization and control [J]. IEEE Control Systems, 2002, 22(3): 52-67.
[48] PATNAIK S S, PANDA A K. Particle swarm optimization and bacterial foraging optimization techniques for optimal current harmonic mitigation by employing active power filter [J]. Applied Computational Intelligence and Soft Computing, 2012, 2012: 897127.
[49] BISWAS A, DASGUPTA S, DAS S, ABRAHAM A. Synergy of PSO and bacterial foraging optimization: A comparative study on numerical benchmarks [C]// 2nd International Symposium Hybrid Artificial Intelligent Systems, Advances in Soft Computing Series, innovations in hybrid intelligent systems, ASC Springer Verlag, Germany, 2007, 44: 255-263.
[50] PATNAIK S S, PANDA A K. Optimizing current harmonics compensation in three-phase power systems with an Enhanced Bacterial foraging approach [J]. International Journal of Electrical Power and Energy System, 2014, 61: 386-398.
(Edited by FANG Jing-hua)
Cite this article as:
M. Mohammadi, M. Montazeri, S. Abasi. Bacterial graphical user interface oriented by particle swarm optimization strategy for optimization of multiple type DFACTS for power quality enhancement in distribution system [J]. Journal of Central South University, 2017, 24(3): 569-588.
DOI:https://dx.doi.org/10.1007/s11771-017-3459-zFoundation item: Project supported by Borujerd Branch, Islamic Azad University, Iran
Received date: 2015-11-24; Accepted date: 2016-01-31
Corresponding author: M. Mohammadi, PhD; Tel: +98-09188607414; E-mail: mohamdi.m@iaub.ac.ir
Abstract: This study proposes a graphical user interface (GUI) based on an enhanced bacterial foraging optimization (EBFO) to find the optimal locations and sizing parameters of multi-type DFACTS in large-scale distribution systems. The proposed GUI based toolbox, allows the user to choose between single and multiple DFACTS allocations, followed by the type and number of them to be allocated. The EBFO is then applied to obtain optimal locations and ratings of the single and multiple DFACTS. This is found to be faster and provides more accurate results compared to the usual PSO and BFO. Results obtained with MATLAB/Simulink simulations are compared with PSO, BFO and enhanced BFO. It reveals that enhanced BFO shows quick convergence to reach the desired solution there by yielding superior solution quality. Simulation results concluded that the EBFO based multiple DFACTS allocation using DSSSC, APC and DSTATCOM is preferable to reduce power losses, improve load balancing and enhance voltage deviation index to 70%, 38% and 132% respectively and also it can improve loading factor without additional power loss.
