

Influence of variables in deep drawing of AA 6061 sheet
S. RAJU1, G. GANESAN1, R. KARTHIKEYAN2
1. Department of Manufacturing Engineering, Annamalai University,
Annamalai Nagar �C 608 002, Tamilnadu, India;
2. Department of Mechanical Engineering, BITS, Dubai
Received 30 September 2009; accepted 4 May 2010
Abstract:
Deep drawing is one of the most important processes for forming sheet metal parts. It is widely used for mass production of cup shapes in automobile, aerospace and packaging industries. Cup drawing, besides its importance as forming process, also serves as a basic test for the sheet metal formability. The effect of equipment and tooling parameters results in complex deformation mechanism. Existence of thickness variation in the formed part may cause stress concentration and may lead to acceleration of damage. Using TAGUCHI��s signal-to-noise ratio, it is determined that the die shoulder radius has major influence followed by blank holder force and punch nose radius on the thickness distribution of the deep drawn cup of AA 6061 sheet. The optimum levels of the above three factors, for the most even wall thickness distribution, are found to be punch nose radius of 3 mm, die shoulder radius of 8 mm and blank holder force of 4 kN.
Key words:
deep drawing; aluminium alloy; thickness distribution; signal to noise ratio;
1 Introduction
Sheet metal forming is a significant manufacturing process for producing large variety of automotive parts and aerospace parts as well as consumer products. Deformation of sheet materials in the stamping process is classified by the four deformation modes, i.e. deep drawing, stretching, stretch flanging and bending[1]. Deep drawing is one of the widely used sheet metal working processes in the industries, to produce cup shaped components at a very high rate. Cup drawing, besides its importance as forming process, also serves as a basic test for the sheet metal formability. During the course of deep drawing, the following five processes take place[2]. They are: 1) pure radial drawing between the die and blank holder, 2) bending and sliding over the die profile, 3) stretching between the die and the punch, 4) bending and sliding over the punch profile radius, and 5) stretching and sliding over the punch face. Thus, the deep drawing process involves complex deformation mechanisms. The parameters that affect the success or failure of a deep drawing operation are the punch and die radii, the punch and die clearance, the press speed, the lubrication and the type and the extent of restraint to metal flow material in deep-drawn shapes. Among these, the die shoulder radius[3-6], punch nose radius[3-5] and the blank holder force[4-8] are considered to be the significant parameters in deep-drawing processes. Noticeable differences in forming behaviour on the stamping have been observed in the aluminum alloys. The relationship between the material, die design parameters and test parameters versus the deep drawability has not been well defined[9]. The quality characteristics chosen for the experiment should reflect as accurately as possible the design parameters under study. Thickness is one of the major quality characteristics in sheet metal formed part[4, 6]. The thickness is unevenly distributed in the part after deep drawing. Generally, the thickness is uniform at the bottom face of the punch, minimum at the punch nose radius and vertical surface, and thicker at the flange area. Existence of thickness variation from the production stage may cause stress concentration in the part, leading to the acceleration of damage. The selection of appropriate process parameters and their combination results in high quality parts. In this work, a statistical approach based on TAGUCHI��s signal-to-noiseratio was adopted to determine the degree of importance of the parameters such as die shoulder radius, punch nose radius and the blank holder force on the thickness distribution of the deep drawn cup of AA 6061 sheet and to determine the optimum combination of these three factors for the most even wall thickness distribution.
2 Experimental
2.1 Material
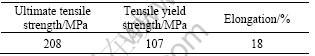
The material used in the present work was the commercially available AA 6061 aluminum alloy sheet. The thickness of the sheet was 0.80 mm. The mechanical properties of the material were determined by conducting tensile test in the Instron machine and are given in Table 1.
Table 1 Uniaxial tensile test data for AA 6061 aluminium alloy sheet
2.2 Parameters and levels
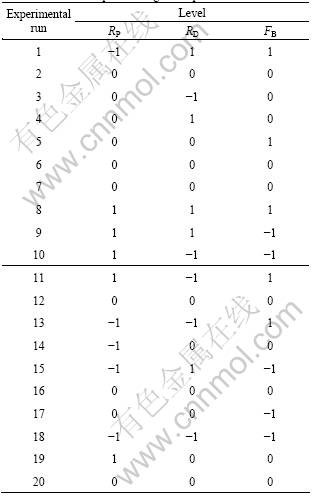
The experimental design was based on central composite rotatable design. The punch nose radius (PR), die shoulder radius (DR) and blank holder force (BHF) were considered to be the predominant parameters. In deep drawing, the quality of the formed parts is affected by the amount of the metal drawn into the die cavity. Excessive metal flow will cause wrinkles in the part while insufficient metal flow will result in tears or splits. The blank holder force plays a key role in regulating the metal flow[6-7]. The geometry of the punch[3-5] and the die[4-7] also influences the deep drawing processes. It has been shown that for a punch nose radius (RP) that is less than twice the thickness of the blank (t), the cup fails due to tearing, whilst for RP greater than 10t, stretching may be introduced. In addition, within region 4t<>P<10t, the radius does not significantly affect the limiting draw ratio (LDR)[2]. Therefore, according to the thickness of the blank, the most suitable shoulder radii for the die and punches were found to be 3, 5.5 and 8 mm with a constant punch stem diameter of 100 mm and a die cavity of 102.5 mm[10]. Proper tool steel with appropriate mechanical properties and hardening treatment was used for the materials for the punches and dies. The tools were ground to finish and final hardness of HRC 64. The amount of blank holder force required to prevent wrinkles is largely determined by trail and error. The blank holder force required to hold a blank flat for a cylindrical draw varies from very little to a maximum about one third of the drawing pressure[11]. For the selected material of 0.80 mm-thick sheet, the maximum blank holder force arrived to be 10 kN. The three levels of the parameters were selected and twenty experimental runs were obtained from the central composite design. Table 2 exhibits the different levels of the chosen parameters. The experimental runs in coded form are shown in Table 3.
Table 2 Parameters and their levels
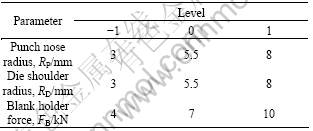
Table 3 Central composite design of experimental runs
2.3 Conducting experiments
The deep drawing was conducted using a double action hydraulic press with a maximum load capacity of 150 t. The lubricant used was a commercially available mineral oil[12]. The experimental setup is shown in Fig.1. The blanks of 180 mm in diameter were cut from the sheet and cups were drawn according to the experimental design. Drawn cups were sectioned at the middle and are shown in Fig.2. The punch stem diameter, the depth of drawing and the blank diameter were selected according to the benchmark specification given in Numisheet 2002[10].
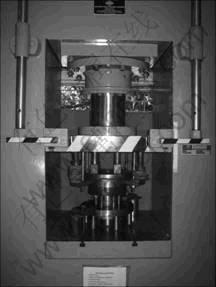
Fig.1 Photograph of experimental setup
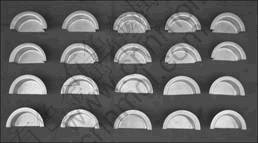
Fig.2 Cups sectioned at middle
2.4 Signal-to-noise ratio and response of process
One of the quality criteria in sheet metal formed parts is thickness distribution. Failure in deep drawn parts usually occurs by thinning; therefore, it is important to determine the variation of strain in thickness direction during deformation[13-14]. The objective is to reduce thickness variation in deep drawn part. Therefore, in this study, the response selected from the experiments is the thickness distribution. The response of a system, and, as a result, its quality characteristics, are influenced by three types of factors[15]: 1) signal factors that are set by the operator of the system in later stages of the product life; 2) control factors that are set by the designer of the system; and 3) noise factors that cannot be directly controlled by neither the designer nor the operator. Control factors are those design parameters that can be freely specified by the designer. TAGUCHI[16-17] divided these control factors into two subsets, with one
subset consisting of those factors influencing both the response mean and the response variance, and second subset consisting of those factors influencing only the response mean. Noise factors are usually classified by TAGUCHI into three classes: 1) external noise factors that typically describe the environmental conditions, such as temperature, dust and humidity; 2) unit-to-unit variation that typically addresses the inevitable variations in a manufacturing process; and 3) deterioration that typically refers to the deterioration in functional characteristics of sold products as time passes.
TAGUCHI��s main idea was to control the noise factors indirectly by examining how they are affected by different settings of the control factors. He suggested analyzing the joint effects of control and noise factors, and for this purpose, proposed a performance criterion called signal-to-noise ratio (S/N). Defectives due to wrinkles and excessive localized thinning alter the product geometry from the designed one, causing difficulties in joining and assembly of sheet products, and limiting the product serviceability[18]. Therefore, thickness of the deep drawn cup section should be as uniform as possible, i.e. the nominal values are preferred throughout the section. If the nominal value for a characteristic is the best, then the designer should maximize the S/N ratio, accordingly the S/N ratio chosen was given below[19]:
![]() (1)
(1)
![]() (2)
(2)
![]() (3)
(3)
where y is the measured value of thickness, and n is the number of experiments.
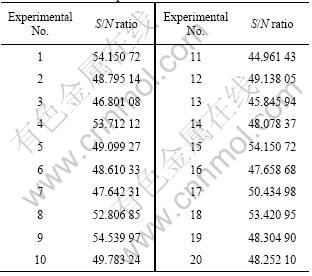
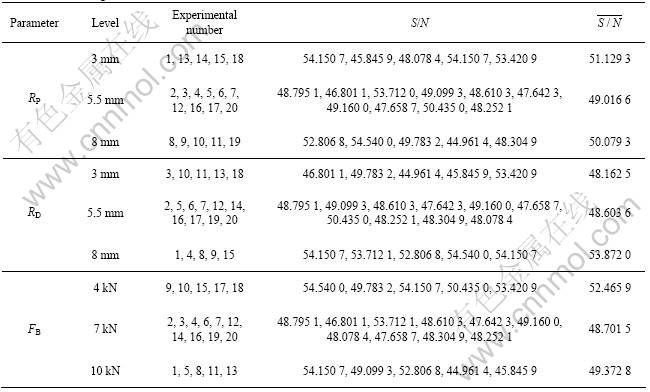
TAGUCHI��s objective was to design a system such as to maximize the S/N value while keeping the response on the target[4, 19]. The calculated S/N values are given in Table 4.
3 Results and discussion
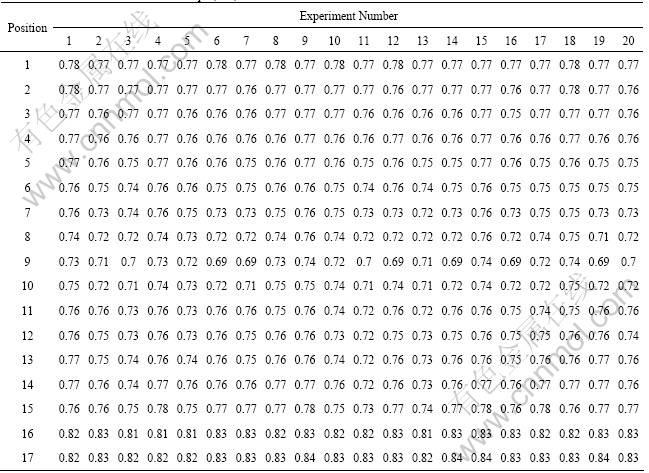
The drawn cups were sectioned at the middle and the thickness was measured at seventeen points at uniform intervals from the centre of the cup to the edge of the flange, as shown in Fig.3.
The measured thickness values are shown in Table 5. The percent contribution measures proposed by TAGUCHI were used for the interpretation of experimental results[17, 20]. The percent contribution values reflect the relative portion of the total variation observed in an experiment which is attributed to each factor. It is a function of the sums-of-squares, for each
Table 4 S/N ratio for experiments
factor, indicating its relative power to reduce the response variation. In other words, the percent contribution of a given factor indicates the potential reduction in the total variation that can be achieved, if this factor is controlled precisely[15]. The level average and the percent contribution of each parameter were calculated as described below[21].
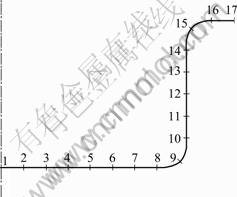
Fig. 3 Points of thickness measurements
The overall mean from which all the variation is calculated is given by
![]() (4)
(4)
where n is the number of test runs.
The grand total sum of squares (GTSS) is given by
![]() (5)
(5)
Table 5 Measured thickness values of cups (mm)
It can be decomposed into two parts: the sum of squares due to overall mean and the sum of squares due to variation around overall mean:
ST=Sm+Sv (6)
The sum of squares due to overall mean is
![]() (7)
(7)
where n is the number of test runs.
The sum of squares due to variation around overall mean is
![]() (8)
(8)
The Sv can be further decomposed into the sums of the squares of the variation induced by individual parameter effects around overall mean.
For parameter RP, the sum of squares due to variation around overall mean is
![]()
![]() (9)
(9)
where nRi is the number of tests conducted at level i of
parameter RP; ![]() is the level average S/N of
is the level average S/N of
parameter RP at level i. The calculated values of level average for all the parameters are given in Table 6. Similarly, the sum of square due to variation around overall mean is calculated for the remaining two parameters. Then, the contribution of each parameter is
calculated:
Cj=Sj/Sv (10)
The calculated contributions of the parameters are shown in Table 7.
The level average response analysis by S/N ratio is shown in Table 6 and Fig.4. Although the physical meaning of S/N ratio is not as straight forward as simple level average response analysis by values, it is more objective towards the target because the S/N ratio reflects both the average (mean) and the scatter (variance)[21]. For optimum values of the selected parameters, the level that gives the highest S/N ratio was chosen[19]. Therefore, it can be stated that the optimum levels for the three significant factors, for the most even wall thickness distribution[4,19] are punch nose radius of 3 mm, die shoulder radius of 8 mm, and blank holder force of 4 kN, which are the parameter level settings for the experimental No.15. The larger die shoulder radius allows the material to be easily drawn into the die cavity, thereby reducing the extent of stretching along the cup wall. The lowest thickness was found at the punch nose radius as a result of minimum punch nose radius (points 9 and 10 in Fig.5). And also it was found that the thickness values at the cup bottom (points 1-5 in Fig.5) are higher than the thickness values at the cup wall (points 11-15 in Fig.5). The flow of material from the cup bottom to the side wall is restricted due to the minimum punch nose radius. At the same time, the lower
Table 6 Level averages of S/N ratios
value of the blank holder force allows the material to be drawn easily to form the wall of the cup and is also sufficient to prevent wrinkles. The thickness at the flange end is the highest due to the hoop stresses produced in the flange.
Table 7 Contribution of parameters

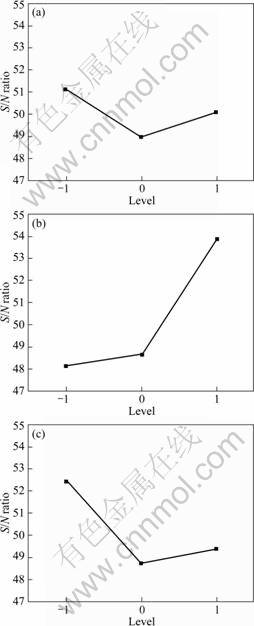
Fig. 4 Plots of level average values of three parameters: (a) Punch nose radius; (b) Die shoulder radius; (c) Blank holder force
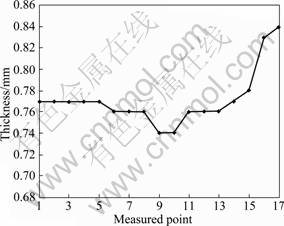
Fig.5 Thickness values measured at different points for experiment No.15
4 Conclusions
Deep drawing experiments were carried out according to the central composite design. The optimum parameter setting for most even wall thickness was found out using TAGUCHI��s signal-to-noise ratio. The parameter settings are punch nose radius of 3 mm, die shoulder radius of 8 mm, and blank holder force of 4 kN. The degrees of influence of the selected parameters on the deep drawing behaviour of circular cup in order to improve the quality of the formed part were determined. The die shoulder radius has major influence (66.49%) followed by blank holder force (29.16%) and punch nose radius (9.23%).
References
[1] PARK K C, KIM Y S. The effect of material and process variables on the stamping formability of sheet materials [J]. Journal of Material Processing Technology, 1995, 51: 64-78.
[2] JOHNSON W, MELLOR P B. Engineering plasticity [M]. Ellis Horwood: Camelot Press, 1983.
[3] MOSHKSAR M M, ZAMANIAN A. Optimization of the tool geometry in the deep drawing of aluminium [J]. Journal of Material Processing Technology, 1997, 72: 363-370.
[4] BROWNE M T, HILLERY M T. Optimising the variables when deep-drawing CRI cups [J]. Journal of Material Processing Technology, 2003, 136: 64-71.
[5] BRABLE G, NANU N, RADU E M. Deep drawing tools and process optimization based on Taguchi and LMecA-Taguchi methods for the compensation of errors generated by springback [C]//Proceedings of National Conference on Excellence Research-A way to Innovation. Brasov, 2008: 27-29.
[6] PADMANABAN R, OLIVEIRA M, ALVES J L, MENEZES L F. Influence of process parameters on the deep drawing of stainless steel [J]. Finite Elements in Analysis and Design, 2007, 43: 1062-1067.
[7] SHENG Z Q, JERATHEARANAT S, ALTAN T. Adaptive FEM simulation for prediction of variable blank holder force in conical cup drawing [J]. International Journal of Machine Tools and Manufacturing, 2004, 44: 487-494.
[8] LEU D K. The limiting drawing ratio for plastic instability of the cup drawing process [J]. Journal of Material Processing Technology, 1999, 86: 168-176.
[9] JAIN M, ALLIN J, BULL M J. Deep drawing characteristics of automotive aluminium alloys [J]. Material Science and Engineering A, 1998, 256: 69-82.
[10] NUMISHEET 2002, Design innovation through virtual manufacturing [C]//Proceedings of the 5th International Conference and Workshop on Numerical simulation of 3D Sheet Forming Processes. Jeju Island, Korea, 2002: 673-678.
[11] Fundamentals of tool design [M]. American Society of Tool and Manufacturing Engineers. New Delhi: Prentice Hall, 1983.
[12] American Society of Metals Hand Book [M]. Vol. 8, 9th Edition. 1989.
[13] REES D W. A sheet orientation and formability limits under diffuse necking [J]. Applied Mathematical Modelling, 1996, 20(8): 624-635.
[14] RAVIKUMAR D. Formability analysis of extra deep drawing steel [J]. Journal of Material Processing Technology, 2002, 130/131: 31-41.
[15] BEN-GAL I E. On the use of data compression measures to analyze robust designs [J]. IEEE Transactions on Reliability, 2005, 54: 381-388.
[16] BYRNE D M, TAGUCHI S. The Taguchi approach to parameter design [J]. Quality Progress, 1987, 20(12): 19-26.
[17] PHADKE M S. Quality engineering using robust design [M]. Englewood Cliffs, New Jersey: Prentice Hall, 1989.
[18] WIFI A, MOSALLAM A. Some aspects of blank-holder force schemes in deep drawing process [J]. Journal of Achievements in Materials and Manufacturing Engineering, 2007, 24(1): 315-323.
[19] BAGCHI T P. Taguchi methods explained [M]. New Delhi: Prentice Hall of India, 1993.
[20] ROSS P J. Taguchi techniques for quality engineering [M]. New York: Mcgraw-Hill, 1988.
[21] KANG J, HADFIELD M. Parameter optimization by Taguchi methods for finishing advanced ceramic balls using a novel eccentric lapping machine [J]. Journal of mechanical engineering manufacture, 2001, 215(1): 69-78.
Corresponding author: S. RAJU; Tel: +9144-229444: E-mail: harsuraju@yahoo.com
DOI: 10.1016/S1003-6326(09)60386-1
[2] JOHNSON W, MELLOR P B. Engineering plasticity [M]. Ellis Horwood: Camelot Press, 1983.
[12] American Society of Metals Hand Book [M]. Vol. 8, 9th Edition. 1989.
[19] BAGCHI T P. Taguchi methods explained [M]. New Delhi: Prentice Hall of India, 1993.
[20] ROSS P J. Taguchi techniques for quality engineering [M]. New York: Mcgraw-Hill, 1988.
