
Trans. Nonferrous Met. Soc. China 23(2013) 1977-1984
Sensitivity model for prediction of bead geometry in underwater wet flux cored arc welding
Yong-hua SHI, Ze-pei ZHENG, Jin HUANG
School of Mechanical and Automotive Engineering, South China University of Technology, Guangzhou 510640, China
Received 29 September 2012; accepted 25 March 2013
Abstract:
To investigate influence of welding parameters on weld bead geometry in underwater wet flux cored arc welding (FCAW), orthogonal experiments of underwater wet FCAW were conducted in the hyperbaric chamber at water depth from 0.2 m to 60 m and mathematical models were developed by multiple curvilinear regression method from the experimental data. Sensitivity analysis was then performed to predict the bead geometry and evaluate the influence of welding parameters. The results reveal that water depth has a greater influence on bead geometry than other welding parameters when welding at a water depth less than 10 m. At a water depth deeper than 10 m, a change in travel speed affects the bead geometry more strongly than other welding parameters.
Key words:
underwater welding; bead geometry; sensitivity analysis; flux cored arc welding (FCAW);
1 Introduction
The demand for underwater welding technology is increasing because of the fast development of the exploitation of marine resources and flux cored arc welding (FCAW) has been applied underwater because of its high efficiency. The bead geometry (including bead width, penetration and reinforcement height) of an underwater weld plays an important role in determining the mechanical properties of a weld joint. Because of a number of competing process parameters involved, determining optimal welding conditions in a given situation is complex. Actually, many trials are often necessary to fix the process in most cases. Therefore, if the bead geometry of an underwater FCAW joint can be predicted based on the welding parameters (e.g., arc current, voltage and travel speed) by a mathematical model, the number of trial runs would be reduced and the process of fixing schedules would be simplified [1].
Various statistical techniques such as regression analysis, response surface methodology (RSM) and Taguchi method have been applied to modeling and optimization of weld bead geometry in gas metal arc welding (GMAW) [2-5]. PALANI and MURUGAN [6] developed mathematical model for prediction of weld bead geometry in FCAW using a RSM method. Taguchi method was also used to analyze the effect of each welding process parameter on the weld bead geometry [7,8]. Effect of pulse current on weld bead profiles of gas tungsten arc welded aluminum alloy joints has been studied [9].
Because the solution of a mathematical model to predict bead geometry is complex and the parameters involved are highly coupled, some researchers have resorted to artificial neural network (ANN) and genetic algorithm (GA) techniques based on large experimental databases [1,10,11]. NAGESH and DATTA [12] proposed an integrated method using neural network for predicting the weld bead geometry and genetic algorithm for optimization of process parameters.
However, the statistical and ANN techniques cannot quantify the effects of process parameters on the bead geometry. Sensitivity analysis is a method to identify critical parameters and rank them by their order of importance, and therefore it has been applied to the prediction of bead geometry of various welding process [13-16]. PALANI and MURUGAN [14] evaluated the effect of welding parameters on the weld bead geometry using sensitivity analysis in FCAW of stainless steel.
KIM et al [13,15] investigated the sensitivity of welding parameters on weld quality in robotic GMAW process. KARAOGLU and SECGIN [16] studied the sensitivity of submerged arc welding process parameters.
Research work on the influence of welding parameters on the bead geometry of underwater wet FCAW has not been reported. In this work, investigation was carried out to study the relationship between the process parameters and the bead geometry in underwater wet FCAW. The quantitative effect of process parameters on bead geometry was calculated using sensitivity analysis, and thus critical parameters can be identified and ranked by their order of importance.
2 Experimental
Experiments of underwater wet FCAW are conducted in a hyperbaric chamber, in which there is an automatic underwater welding system. Figure 1 shows the experimental setup of underwater wet FCAW. The system mainly comprises a high pressure underwater welding chamber, a welding power source, a three-dimensional motion platform and other auxiliary equipments. Before welding, fresh water was poured into the chamber until the water surface was about 0.1 m higher than the work-piece surface. Compressed air was then pressurized into the chamber to simulate the pressure caused by the water depth. Every 10 m of water depth will cause a pressure of 0.1 MPa. During welding, the arc was burning in the water directly. Lincoln SW-707 self-shielded flux cored wire of 2.0 mm diameter was used to deposit bead-on-plate welds on Q235B steel plates with dimensions of 200 mm��40 mm�� 8 mm. The chemical compositions of the filler material are shown in Table 1.
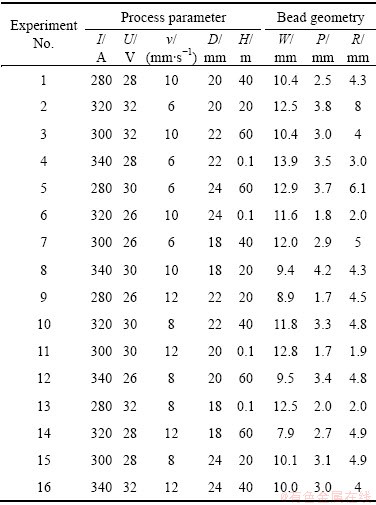
In underwater wet FCAW, the welding parameters, which affect the bead geometry, are welding current I, arc voltage U, travel speed v, contact tube-to-work distance (CTWD) D and water depth H. Researches showed that there is no interaction of the welding parameters which affect the weld bead geometry [14,16-18]. Therefore, no interaction among the factors is considered during the design of experiments in this study. To study the relationship between the bead geometry and the welding parameters, the L16(45) orthogonal array is used.
The previous researches have studied the relationships between the underwater wet FCAW parameters and process stability [19,20]. In this study, the levels of the welding parameters are carefully set to make sure that the welding processes are stable and can obtain good weld beads. The typical underwater wet FCAW bead appearances obtained in this study are shown in Fig. 2.
In order to accurately measure the bead width W, penetration P and reinforcement height R shown in Fig. 3, each weld was cross sectioned at the left side, middle and right side respectively, and then the measured values were averaged.
3 Results and discussion
3.1 Experimental results and mathematical modeling
Underwater wet FCAW process parameters and the corresponding bead geometry of orthogonal array experiments are presented in Table 2.

Fig. 1 Schematic illustration of underwater wet FCAW system
Table 1 Chemical composition of Lincoln SW-707 self- shielded flux cored wire
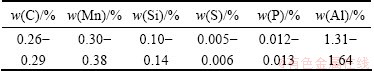
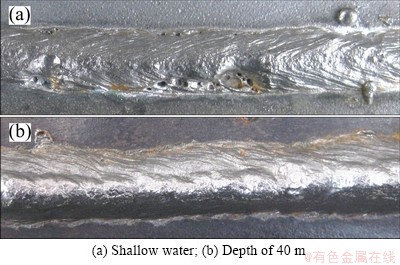
Fig. 2 Weld bead appearances of underwater wet FCAW
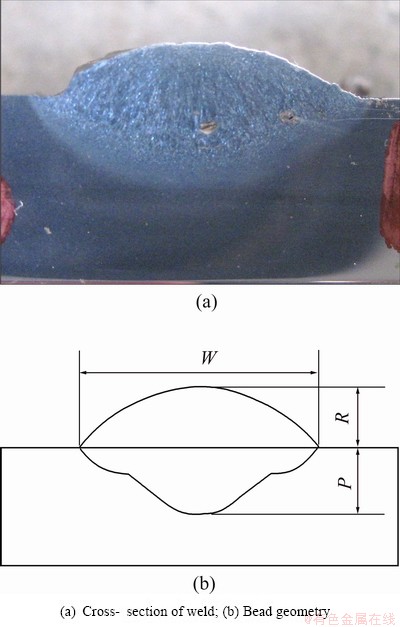
Fig. 3 Bead geometry of underwater wet FCAW
Table 2 Experimental layout using L16(45) orthogonal array and measured welding geometry
Mathematical model of wet FCAW can be constructed using multiple curvilinear regression analysis. The mathematical model simulating the relationship between weld bead geometry (W, P and R) and process parameters (I, U, v, D and H) is shown in Eqs. (1)-(3).
 (1)
(1)
 (2)
(2)
 (3)
(3)
where fW(I,U,v,D,H), fP(I,U,v,D,H) and fR(I,U,v,D,H) are weld bead width, penetration and reinforcement function at given weld condition, respectively; b0, b1, b2, b3, b4, b5, c0, c1, c2, c3, c4, c5, d0, d1, d2, d3, d4 and d5 are curvilinear coefficients to be estimated in the model.
Taking the natural logarithm of Eqs. (1)-(3) respectively, the above equations can be expressed by the following linear mathematical form:

 (4)
(4)

 (5)
(5)

 (6)
(6)
The regression coefficients of the above empirical formulae can be calculated using a Matlab program, according to the experimental data shown in Table 2. Substituting these coefficients into Eqs. (1), (2) and (3), the following empirical formulae can be obtained:
 (7)
(7)
 (8)
(8)
 (9)
(9)
3.2 Analysis of variance
The adequacy of the developed models and the significance of coefficients were tested by the analysis of variance (ANOVA) technique. Table 3 shows that calculated F ratios of W, P and R are larger than the tabulated values at a 95% confidence level. Therefore, the models are considered to be adequate.
The coefficient of determination (R2) is defined as the ratio of the sum of squares explained by a regression model and the total sum of squares around the mean, as shown in the following equation:
 (10)
(10)
where yi is the ith value of the variable to be predicted,  is the predicted value of yi, and
  is the mean of the observed data.
The correlation coefficients of the bead width, penetration and reinforcement are 0.8442, 0.8844 and 0.9571 respectively (Table 3). A value of R2 closer to 1 indicates a better fit. When the confidence level is 1%, the R2 critical value is 0.708. Therefore, R2 of the bead width, penetration, or reinforcement is much larger than the R2 critical value when the confidence level is 1%, indicating that the effects of the regression models are quite adequate.
Table 3 ANOVA for models developed
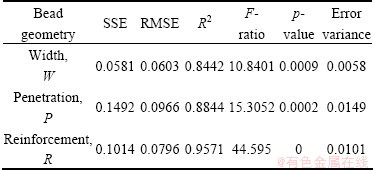
The sum of squares due to error (SSE) measures the total deviation of the response values from the fit to the original values. Root mean square error (RMSE) is also a frequently used measure of the differences between values predicted by a model and the values actually observed. A SSE or RMSE value closer to zero indicates a better fit. As shown in Table 3, the SSE and RMSE values of width, penetration and reinforcement are small and very close to zero, indicating that the fits of W, P and R in this work are good.
In respect of the mathematical models, the results are again plotted using scatter graphs of predicted values vs observed data of bead geometry, as shown in Figs. 4-6. The observed values and predicted values are scattered close to the 45�� line, indicating an accurate fit of the developed empirical models.
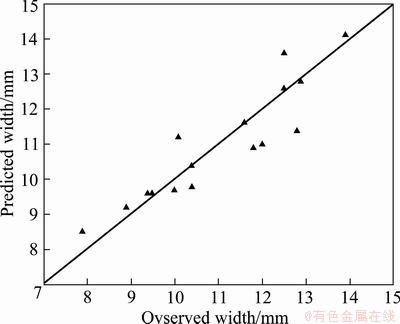
Fig. 4 Scatter diagram for bead width
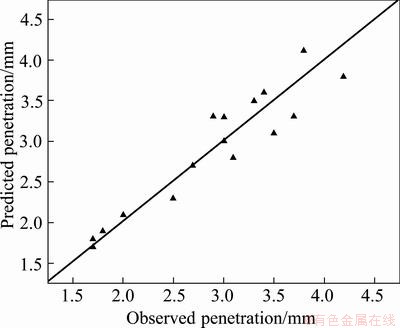
Fig. 5 Scatter diagram for bead penetration
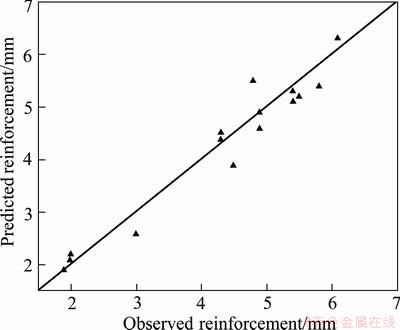
Fig. 6 Scatter diagram for bead reinforcement
4 Sensitivity analysis
4.1 Derivations of sensitivity equations
The sensitivity equations for various parameters on bead width, penetration, and reinforcement are obtained by partially differentiating Eqs. (7)-(9) with respect to I, U, v, D and H, respectively. According to Eq. (7), bead width sensitivities with respect to various process parameters are obtained as follows:
 (11)
(11)
 (12)
(12)
 (13)
(13)
 (14)
(14)
 (15)
(15)
According to Eq. (8), the bead penetration sensitivities with respect to various parameters are as follows:
 (16)
(16)
 (17)
(17)
 (18)
(18)
 (19)
(19)
 (20)
(20)
According to Eq. (9), the bead reinforcement sensitivities with respect to various parameters are as follows:
 (21)
(21)
 (22)
(22)
 (23)
(23)
 (24)
(24)
 (25)
(25)
4.2 Evaluation of sensitivity analysis results
The purpose of this investigation is to show the effect of process parameters by the direct sensitivity analysis technique on these empirical equations. Through the derivation of sensitivity equations, the sensitivities of welding parameters on weld bead geometry can be quantified. If the weld bead geometry sensitivities with respect to a certain process parameter are positive, the bead geometry will increase as this parameter increases, whereas negative sensitivities state the opposite.
Substituting orthogonal experiment parameters into Eqs. (11)-(25), the sensitivity values for corresponding process parameters are obtained. Figure 7 shows that the sensitivities of water depth on weld bead geometry are relatively large in the shallow water (depth is 0.1 m), and the sensitivities of the other four process parameters change very little in the shallow water. Therefore, it indicates that water depth has the greatest influence on bead geometry when welding at shallow water. Thus, what follows in this work is the investigation of various parameters�� impacts on weld geometry when water depth is larger than 10 m, and the sensitivity values are shown in Fig. 8.
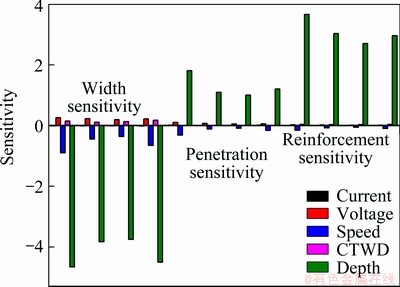
Fig. 7 Bead width, penetration and reinforcement sensitivities at shallow water
In the case of welding at a water depth greater than 10 m, it can be observed from Fig. 8 that changes in sensitivity of bead width, penetration and reinforcement are more pronounced for changes in travel speed. It is also shown that arc voltage and CTWD have a large influence on bead width in Fig. 8(a). Welding current and water depth have comparatively less impact on bead geometry. Whereas, it is shown in Fig. 8(b) that arc voltage and welding current have effect on bead penetration. In Fig. 8 (c), it is shown that the influence of CTWD and arc voltage on reinforcement is notable.

Fig. 8 Histogram of sensitivities of bead geometry on welding parameters at water depth larger than 10 m

Fig. 9 Sensitivity of various welding parameters on weld bead geometries
According to the comparison of Figs. 8(a), (b) and (c), the influence of welding current on penetration is larger than on bead width or reinforcement. But the sensitivity of welding current is very small compared with those of other process parameters, which means that welding current cannot be used to adjust bead geometry in wet FCAW.
The sort of influence of arc voltage on weld geometry, from large to small, is bead width, penetration depth and reinforcement. Compared with bead width and reinforcement, the influence of CTWD on penetration depth is small. The influence of water depth on reinforcement is larger than on bead width or penetration.
Figure 9(a) shows the sensitivity of welding current on bead geometry. Of all the bead geometries, bead penetration is more sensitive to the welding current than others. The sensitivity of welding current on bead penetration also increases with the increase in welding current, indicating that the influence of welding current on bead penetration increases.
Figure 9(b) shows the sensitivity of arc voltage on bead geometry. Bead width is more sensitive to arc voltage than others. The sensitivities of arc voltage on bead width, penetration and reinforcement are all positive, which means that bead width, penetration and reinforcement will increase with the increase in arc voltage. The sensitivity of arc voltage on bead width has a slowly declining trend with the increase in arc voltage, indicating that the influence of arc voltage on bead width slowly decreases. While the sensitivity of arc voltage on the penetration and reinforcement essentially keeps unchanged.
Since the sensitivity of travel speed on bead geometry is much higher than other process parameters (Fig. 8), the change of travel speed is more useful in control of bead geometry. It is shown in Fig. 9(c) that the sensitivities of travel speed on bead geometry are all negative, indicating that bead width, penetration and reinforcement will decrease with the increase in travel speed. The sensitivity of travel speed on bead width rises rapidly as the speed is less than 11 mm/s, and keeps almost unchanged as the travel speed is faster than 11 mm/s, meaning that the influence of travel speed on bead width is large when the travel speed is less than 11 mm/s.
Figure 9(d) shows bead width is more sensitive to CTWD compared with reinforcement, meaning that the variation in CTWD causes large change of bead width and small change of reinforcement. Variation in CTWD causes little change of bead penetration as the sensitivity of CTWD on penetration is close to zero. The sensitivity of CTWD on bead width shows a declining trend with the increase in CTWD, indicating that the influence of CTWD on bead width decreases with the increase in CTWD. The sensitivities of CTWD on bead width and reinforcement are positive, indicating that bead width and reinforcement increase.
Figure 9(e) shows the sensitivity of water depth on bead geometry as the water depth is larger than 10 m. The sensitivity of water depth is large at lower water depth and turns to be close to zero if the water depth is at higher region (beyond 50 m). This implies that when the water depth is from 10 m to 50 m, the influence of water depth on bead width, penetration and reinforcement gradually decreases with the increase in water depth.
When water depth is greater than 50 m, the sensitivities of water depth on bead width, penetration and reinforcement are very small and remain unchanged. The sensitivity of water depth on bead width is negative and on the penetration or reinforcement is positive, which means that bead width decreases and penetration and reinforcement increase with the increase in water depth.
5 Conclusions
1) The influence of water depth on bead geometry is much greater than other four welding parameters at low water depth (less than 10 m), but they gradually decrease with the increase in water depth.
2) When water depth is larger than 10 m, the sensitivities of travel speed on all three bead geometries are relatively larger than other four process parameters.
3) All three bead geometries of underwater wet FCAW are very sensitive to travel speed and arc voltage. The sensitivities of welding current on all three bead geometries are small.
References
[1] CHAN B, PACEY J, BIBBY M. Modelling gas metal arc weld geometry using artificial neural network technology [J]. Canadian Metallurgical Quarterly, 1999, 38(1): 43-51.
[2] PAL K, PAL S K. Soft computing methods used for the modelling and optimisation of gas metal arc welding: A review [J]. International Journal of Manufacturing Research, 2011, 6(1): 15-29.
[3] MURUGAN N, PARMAR R S. Effects of MIG process parameters on the geometry of the bead in the automatic surfacing of stainless steel [J]. Journal of Materials Processing, 1994, 41(4): 381-398.
[4] KIM I S, BASU A, SIORES E. Mathematical models for control of weld bead penetration in the GMAW process [J]. International Journal of Advanced Manufacturing Technology, 1996, 12(6): 393-401.
[5] RAO P S, GUPTA O P, MURTY S N, RAO A B K. Effect of process parameters and mathematical model for the prediction of bead geometry in pulsed GMA welding [J]. International Journal of Advanced Manufacturing Technology, 2009, 45(5-6): 496-505.
[6] PALANI P K, MURUGAN N. Development of mathematical models for prediction of weld bead geometry in cladding by flux cored arc welding [J]. International Journal of Advanced Manufacturing Technology, 2006, 30(7-8): 669-676.
[7] PAL S, MALVIYA S K, PAL S K, SAMANTARAY A K. Optimization of quality characteristics parameters in a pulsed metal inert gas welding process using grey-based Taguchi method [J]. International Journal of Advanced Manufacturing Technology, 2009, 44(11-12): 1250-1260.
[8] TARNG Y S, YANG W H. Optimisation of the weld bead geometry in gas tungsten arc welding by the Taguchi method [J]. International Journal of Advanced Manufacturing Technology, 1998, 14(8): 549-554.
[9] KARUNAKARAN N, BALASUBRAMANIAN V. Effect of pulsed current on temperature distribution, weld bead profiles and characteristics of gas tungsten arc welded aluminum alloy joints [J]. Transactions of Nonferrous Metals Society of China, 2011, 21: 278-286.
[10] KIM I S, SON J S, PARK C E, KIM I J, KIM H H. An investigation into an intelligent system for predicting bead geometry in GMA welding process [J]. Journal of Materials Processing, 2005, 159(1): 113-118.
[11] SUBASHINI L, VASUDEVAN M. Adaptive neuro-fuzzy inference system (ANFIS)-based models for predicting the weld bead width and depth of penetration from the infrared thermal image of the weld pool [J]. Metallurgical and Materials Transactions B, 2012, 43(1): 145-154.
[12] NAGESH D S, DATTA G L. Genetic algorithm for optimization of welding variables for height to width ratio and application of ANN for prediction of bead geometry for TIG welding process [J]. Applied Soft Computing, 2010, 10(3): 897-907.
[13] KIM I S, JEONG Y J, SON I J, KIM I J, KIM J Y, KIM I K, YARAGADA P K D V. Sensitivity analysis for process parameters influencing weld quality in robotic GMA welding process [J]. Journal of Materials Processing Technology, 2003, 140(1-3): 676-681.
[14] PALANI P K, MURUGAN N. Sensitivity analysis for process parameters in cladding of stainless steel by flux cored arc welding [J]. Journal of Manufacturing Processes, 2006, 8(2): 90-100.
[15] KIM I S, SON K J, YANG Y S, YARAGADA P K D V. Sensitivity analysis for process parameters in GMA welding processes using a factorial design method [J]. International Journal of Machine Tools & Manufacture, 2003, 43(8): 763-769.
[16] KARAOGLU S, SECGIN A. Sensitivity analysis of submerged arc welding process parameters [J]. Journal of Materials Processing Technology, 2008, 202(1-3): 500-507.
[17] KATHERASAN D, ELIAS J V, SATHIYA P, HAQ A N. Simulation and parameter optimization of flux cored arc welding using artificial neural network and particle swarm optimization algorithm [J]. Journal of Intelligent Manufacturing, 2012, 7: 1-10.
[18] SATHIYA P, ARAVINDAN S, JEYAPAUL R, AJITH P M, HAQ A N. Optimizing the weld bead characteristics of super austenitic stainless steel (904L) through grey-based Taguchi method [J]. Multidiscipline Modeling in Materials and Structures, 2010, 6(2): 206-214.
[19] SHI Yong-hua, ZHENG Ze-pei, HUANG Jin. Arc stability of shallow-wet and atmospheric in-air welding [J]. Journal of South China University Technology: Natural Science, 2012, 40(7): 67-72. (in Chinese)
[20] SHI Yong-hua, ZHENG Ze-pei, HUANG Jin. The arc stability of underwater wet flux-cored arc welding [J]. Transactions of China Welding Institution, 2012, 33(10): 49-53. (in Chinese).
ˮ��ʪ��ҩо��˿���Ӻ������Ԥ������ж�ģ��
ʯ������֣���࣬�� ��
����������ѧ ��е����������ѧԺ������ 510640
ժ Ҫ��������������鲢�ڸ�ѹ���ڽ�����0.2~60 m��ˮ��ʪ��ҩо��˿���ӣ����ö�Ԫ���ع鷽�������������н����˺��ӹ��ղ����ͺ�����γߴ�֮�����ѧģ�͡�Ȼ�������жȷ�����Ԥ�⺸�켸�γߴ磬�������������ղ����纸�ӵ�������ѹ�������ٶȡ�����������������(CTWD)��ˮ��Ժ��켸�γߴ��Ӱ�졣���������������ˮ���dz(С��10 m)ʱ��ˮ��Ժ��켸�γߴ��Ӱ������������Ĵ��ڽϴ��ˮ����(����10 m)�������ٶȵı仯�Ժ���ߴ��Ӱ�����
�ؼ��ʣ�ˮ�º��ӣ�����ߴ磻���жȷ�����ҩо��˿����(FCAW)
(Edited by Hua YANG)
Foundation item: Projects (51175185, 50705030) supported by the National Natural Science Foundation of China; Project (2012ZZ0052) supported by the Fundamental Research Funds for the Central Universities, China; Project (9151064101000065) supported by the Natural Science Foundation of Guangdong Province, China
Corresponding author: Yong-hua SHI; Tel: +86-20-87114407; E-mail: yhuashi@scut.edu.cn
DOI: 10.1016/S1003-6326(13)62686-2
Abstract: To investigate influence of welding parameters on weld bead geometry in underwater wet flux cored arc welding (FCAW), orthogonal experiments of underwater wet FCAW were conducted in the hyperbaric chamber at water depth from 0.2 m to 60 m and mathematical models were developed by multiple curvilinear regression method from the experimental data. Sensitivity analysis was then performed to predict the bead geometry and evaluate the influence of welding parameters. The results reveal that water depth has a greater influence on bead geometry than other welding parameters when welding at a water depth less than 10 m. At a water depth deeper than 10 m, a change in travel speed affects the bead geometry more strongly than other welding parameters.
