
Trans. Nonferrous Met. Soc. China 23(2013) 1428-1434
Constitutive model for thin sheet metal with one or several grains across thickness in micro-forming
Qian WANG1, Xiang-huai DONG1, Hai-ming ZHANG1, He-zong LI2, Yu SHEN1
1. National Die & Mold CAD Engineering Research Center, Shanghai Jiao Tong University, Shanghai 200030, China;
2. Deportment of Mechanical and Electrical Engineering, Hebei University of Engineering, Handan 056038, China
Received 9 May 2012; accepted 19 July 2012
Abstract:
Effects of four factors on thin sheet metal flow stress were considered, including grain size d, thickness t, grain number across thickness (t/d ratio) and surface property. Surface model was adopted to quantitatively describe the effect of t/d ratio on flow stress for pure copper. It is predicted that when t/d ratio is larger than a critical value, effect of t/d ratio on flow stress can be neglected. Existence of critical t/d ratio changes the Hall-Petch relationship and evolution of flow stress with thickness. A criterion was proposed to determine critical t/d ratio. Then a comprehensive constitutive model was developed to consider all the four factors, with parameters determined by fitting experimental data of high purity Ni. The predicted results show the same tendencies with experiment results. Particularly when t/d ratio decreases, Hall-Petch relationship and evolution of true stress show varied slopes with two transition points.
Key words:
constitutive model; flow stress; micro forming; size effect;
1 Introduction
Thin sheet metal forming is an important micro- forming process, and intensive researches have been implemented over decades. It is revealed by experimental researches that plastic deformation behaviors of thin sheet metals are mostly affected by four important factors: grain size d, thickness t, grain number across thickness (t/d ratio) and surface property. As a result, it is impossible to directly adopt the design rules well established in conventional sheet metal forming processes in micro-forming through scaling down part size [1]. Therefore, it is necessary to develop an appropriate constitutive model to describe size effects in micro forming of metals.
A nearly linear relationship between the flow stress and grain size is described by the well-known Hall-Petch equation. However, recent researches show that if keeping d constant, as t decreases, the curve no longer keeps linear, but shows varied slops [2]. FU et al [3] found that for copper when grain size is progressively reduced, the slope of Hall-Petch relationship decreases significantly. LEDERER et al [4] also found that for high purity aluminum Hall-Petch relation can no longer be applied if most of the grain boundaries are on the free surface.
The grain number across thickness (t/d ratio) direction is another factor that affects size effects when thickness and grain size are in the same order. In some micro sheet metal forming processes, the number of grains across thickness approaches unity, in which effects of t/d ratio become significant [5-7]. As t/d ratio decreases, a weakening effect occurs for the samples with free surface. However, the effect of t/d ratio has a limited range: there are two obvious transition points in flow stress curve [5,8,9]. Between the two points, flow stress is obviously affected by t/d ratio. If t/d ratio is larger than a critical value or less than unity, its effects become negligible. The existence of critical grain number might be the reason why Hall-Petch relationship no longer applies when thickness or grain size decreases significantly.
Thickness effects, however, seem to show two opposite tendencies. One kind of the thickness effects reflects decreasing flow stress with decreasing thickness while d is kept constant. This ��thinner is weaker�� effect has been found in many tension tests of thin sheet material, such as high purity Ni [10], pure copper [11, 12], Al99.5 [13], SUS304 stainless steel [14], CuZn36 [15] and SE-CU 58 [16]. The other kind of the thickness effects reflects ��thinner is stronger��, as found by LI et al [17] in CuZn37 brass tension tests, and by other researchers [18,19]. The physical mechanisms of the above two completely contrary thickness effects have not been fully understood yet. GEERS et al [8] attributed the ��thinner is weaker�� trend to the presence of free surface, at which dislocation glide is less obstructed and thus grains are more deformable. On the contrary, when the sheet is covered with oxide layer or passivated layer on its surface, which is harder than the substrate and makes the surface layer grains less deformable, and flow stress will increase as the volume fraction of surface layer becomes larger with decreasing thickness, showing the ��thinner is stronger�� trend [20]. FAN et al [21] pointed out that the mechanism of those thickness effects lies in the competition between the exterior surface constraint and interior grain boundary (GB) constraint on gliding dislocations. No matter in what type the surface film is, thickness effects gradually disappear when the number of grains in thickness direction is large enough.
Based on the above experimental observations, some phenomenological constitutive models were proposed by some researchers [2,5,22-25]. These models directly added dimensional factors like t or d to conventional constitutive models to fit their experiment data. Significant efforts have been made to introduce the effect of the presence of free surface layer, among which the surface layer model proposed by GEIGER et al [26] is commonly used. The basic idea of the model is to divide deformed material into surface portion and inner portion. As a result, the key factor in developing appropriate surface models is how to evaluate the contribution of the two portions, which were intensively studied by some researchers [11,27-29]. However, when t/d ratio approaches unity, those surface models and enhanced versions no longer apply. As for materials with oxide layer or passivated layer, it is not considered yet by the surface models. There is no existing model attempting to consider all the four factors together.
As the four factors discussed above contribute jointly to mechanical properties of thin sheet metal [5,27], it is necessary to take all of them into consideration in order to develop an comprehensive constitutive model. In this work, firstly a surface model is adopted based on the analysis of strain hardening mechanism, and a criterion is proposed to determine the critical value of t/d ratio; then a comprehensive constitutive model is proposed to take into account all the four factors. The predicted results were compared with experiment results of existing literatures, and it is confirmed that some phenomena observed in experiments can be predicted.
2 Surface model and criterion of critical t/d ratio
In this section, surface model is adopted to investigate the effects of t/d ratio on flow stress in thin sheet micro forming, and try to figure out the physical mechanism of those phenomena.
2.1 Basic idea of surface model
As already mentioned, the basic idea of surface model is to divide deformed material into surface layer part and inner part. Macro stress of thin sheet material �� can be described as a weighted average of stress in surface layer part ��sur and stress in inner part ��inner as follows:
 (1)
(1)
where fsur and finner are the volume fractions of surface layer portion and material inner portion, respectively.
2.1.1 Flow stress of specimen with free surface
The mechanisms of different flow stresses in the two portions could be understood through observing the evolutions of dislocation structures near surface. The dislocation structures in the vicinity of free surface were found to be softer than those in the core region across thickness [5]. In other word, dislocation density is much lower in front of free surface, which is the proof of dislocation exiting surface freely. Accordingly, free surface shows lower stress level than inner part. When thickness decreases with grain size kept constant, volume fraction of free surface part fsur increases. According to Eq. (1), a stress decrease occurs reflecting ��thinner is weaker�� effect. Free surface layer part is often assumed as surface grains. Hence, the volume fractions can be expressed as follows [11]:
 ,
,  (2)
(2)
One of the modified versions of surface models further divides a grain into grain interior (GI) and grain boundary (GB) [11]. Therefore, stress of the inner portion can also be calculated by weighted average of stresses in the two parts.
 (3)
(3)
where fGI and fGB are the average volume fractions of grain interior and grain boundary of grains, respectively; ��GI and ��GB are the stresses in grain interior and grain boundary, respectively. The stress is related to dislocation density according to the classical Taylor relation as follows:
 (4)
(4)
 (5)
(5)
where M is the Taylor factor; b is the Burger��s vector; �� is the shear modulus; �� is a material parameter taking into account the dislocation arrangement; ��GI and ��GB are the dislocation densities in grain interior and grain boundary, respectively.
As is well known, grain boundaries obstruct the movements of dislocations. Micro plasticity of grains strongly depends on the penetrability of grain boundaries [30]. It has already been proved that a layer of high dislocation density exists in the direct vicinity of the grain boundaries by TEM observations [31], so the stress is higher in the grain boundary region than in the grain interior [32,33] as revealed by Eqs. (4) and (5).
The stress in surface layer is assumed equal to ��GI for thin sheet with free surface, so Eq. (1) can be rewritten as
 (6)
(6)
where
 (7)
(7)
and FGI and FGB are volume fractions of grain interior and grain boundary of deformed material, respectively.
2.1.2 Flow stress of specimen with oxide layer surface
Unlike free surface, the oxide surface layer blocks dislocation glide leading to pile ups, which has already been proved with the help of an electron microscope [4]. Besides causing dislocation pile ups, the oxide layer and/or passivated layer are often harder than the material itself. Thus, the surface layer should be divided into two sub-layers. One sub-layer could be much harder than the grain, and the other sub-layer contains high dislocation density.
 (8)
(8)
According to Eq. (1) and Eq. (8), a stress increase occurs when thickness decreases with grain size kept constant, reflecting ��thinner is stronger�� effect.
2.2 Prediction of flow stress and critical t/d ratio
2.2.1 Critical t/d ratio
Firstly, free surface is assumed to study size effects on true stress quantitatively. As defined by Eq. (6), the flow stress depends on FGI, FGB, ��GI and ��GB for a given strain level. If t/d ratio is given, then FGI and FGB can be determined. For pure copper, assuming ��GI=25 MP and ��GB=426.28 MPa [34] as case 1, and ��GI=129 MP and ��GB=300 MPa [11] as case 2, the relationship between true stress and t/d ratio can be obtained. Here normalized true stress is adopted for comparison as shown in Fig. 1. Normalized true stress of a specimen is defined as the relative value of the specimen stress divided by stress of specimen with the largest t/d ratio, which is very close to the conventional specimen. When t/d ratio is large, both curves tend to be flattened. Size effects occur when t/d ratio decreases to a critical value. In this work, the critical t/d ratio, Nc, is defined and determined by the following parameter:
 (9)
(9)
where ��i and ��i-1 are stresses corresponding to sheet material with i and i-1 grains across thickness, respectively.
It can be seen from Fig. 1 that �� increases with decreasing grain number with thickness kept constant. When �� approaches 2%, the corresponding t/d ratio is defined as the critical value Nc. In Fig. 1, critical transition point is 7-8 for case 1, and for case 2 it is around 5 which is very close to the critical grain number of 6 in Ref. [11]. So, Nc is strongly influenced by mechanical properties of grain boundary and grain interior.
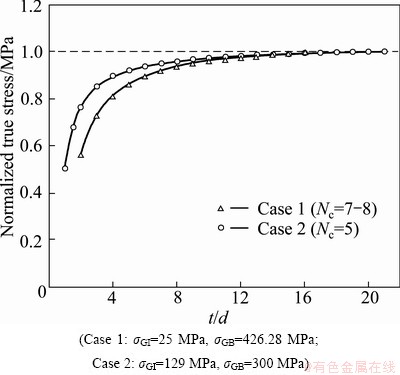
Fig. 1 Variation of normalized true stress with t/d ratio for different ��GI and ��GB
2.2.2 Effects of volume fraction of surface layer on critical t/d ratio
Surface fraction can be calculated by another formula [34]:
 (10)
(10)
Figure 2 shows the curves of normalized true stress versus t/d ratio with surface fraction calculated by Eq. (2) and Eq.(10), respectively. Assuming flow stress obtained by Eq. (10) as case 3. The only difference between case 1 and case 3 is the calculation of volume fraction of surface layer. In Eq. (10), the surface layer volume fraction is larger than that obtained by Eq. (2), and accordingly the resulted Nc value is larger. This is reasonable because the larger the surface fraction is, the more significantly the stress decreases, as seen from Eq. (6), thus the size effects get strong.
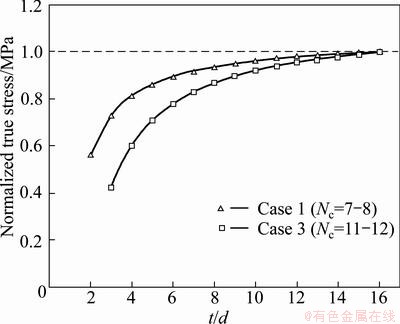
Fig. 2 Variation of normalized true stress with t/d ratio for different surface fraction definitions according to Refs. [11] (Case 1) and [34] (Case 3)
2.2.3 Effects of thickness and grain size on critical t/d ratio
For case 1, keeping d constant, the variation of true stress with thickness is shown in Fig. 3. It can be seen that true stress decreases with decreasing thickness, which is reasonable, since free surface shows ��thinner is weaker�� effect. Keeping t constant, the relationship of true stress with the reciprocal of square root of grain size is obtained and shown in Fig. 4. The small circles are the calculated results, while the two straight lines are obtained by fitting calculated data. It is obvious that the variation tendency of small circles is not linear, and shows two distinct stages shown by two lines. This phenomenon is consistent with experimental findings of Ref. [35]. In Fig. 3 and Fig. 4, the critical t/d ratio can be defined.
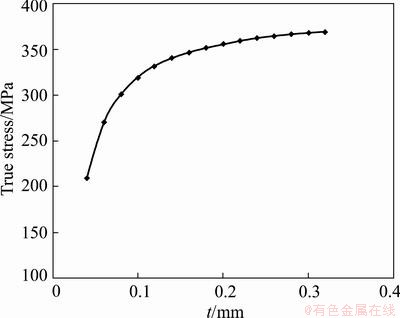
Fig. 3 Variation of true stress with thickness(d is kept constant)
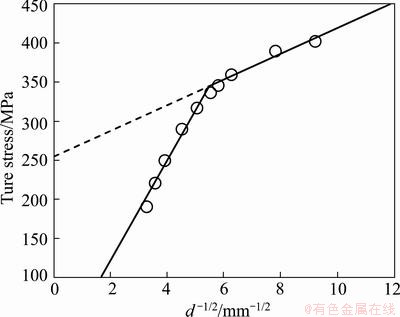
Fig. 4 Variation of true stress with grain size(t is kept constant)
As discussed above, the critical t/d ratio, Nc, does exist and strongly depends on material properties. In order to identify Nc, mechanical behaviors of grain boundary and grain interior, property of surface layer and volume fraction of surface layer should be determined, which is very complicated and costly. There is a limitation for this model: if t/d ratio is less than unity, then calculation of fsur by Eq. (2) is failed; if t/d ratio is less than two, then calculation of fsur by Eq. (10) is failed. In such case that all the material is taken to be grain interior, the true stress does not vary with t/d ratio any more, and the model cannot be applied.
3 Comprehensive constitutive model considering all four factors
3.1 Proposed constitutive model
An appropriate constitutive model applicable for larger range is necessary for describing all kinds of size effects in thin sheet micro-forming. Based on the above understandings, a constitutive model for thin sheet in micro-forming is proposed taking into account grain size d, thickness t, thickness to grain size ratio t/d and surface property effects by the following equation:
 (11)
(11)
where the three functions, f1(d), f2(t) and f3(t/d), in the square brackets denote the effects of grain size, thickness, both t/d ratio and surface property on flow stress, respectively, and are assumed as the following forms:
 (12)
(12)
 (13)
(13)

 (14)
(14)
where k0, k1, k2, k3, k4 and n are material parameters.
In Eq. (14), 1 and Nc are two transition values of t/d ratio. When t/d ratio varies between 1 and Nc, flow stresses vary rapidly with increasing t/d ratio. Beyond this interval, the effect of t/d ratio on flow stress tends to be negligible [5,8,9]. The signs of n and k3 reflect surface property effects: the positive sign of them represents free surface softening effect, and the negative sign represents hardening effect by oxide or passivated surface layer when they are harder and less deformable than grain boundaries.
��0 (��, t0, d0) is the reference flow stress, which could be chosen optionally. It is suggested to take the stress of thicker sheets with more grains across thickness as the reference stress because it is less affected by grain orientations. The unknown parameters of the model can be determined through fitting stress data at a given strain level of a set of t/d ratios with least square method and Newton iteration algorithm through FORTRAN coding.
3.2 Parameter determination with experiment results for material with free surface
In this work, experiment results by KELLER et al [5] for high purity nickel are used to identify the unknown parameters. Based on their research, Nc=4 is assumed, which is very close to that determined by Eq. (9); other parameters are determined by 16 sets of true stress data of a given strain level of 0.1. The best-fitted values of unknown parameters are listed in Table 1.
Table 1 Model parameters through least square method
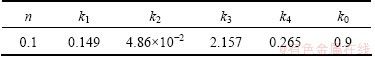
The mean flow stress of samples with t0=500 ��m, t0/d0=14, shown in Fig. 5, is adopted as the reference flow stress ��0. In this figure, the black dots are experiment results, while the curve is calculated by the proposed model through fitted parameters. It can be seen that they agree well with each other.
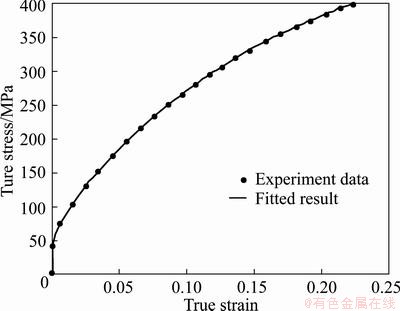
Fig. 5 True stress��true strain curve (t/d=14 and t=500 ��m)
Figure 6 shows the stress map surface with different t and d for ��=0.1 predicted by the proposed model. The predicted results by the model turn out to be applicable for a wide range and show the similar variation trends to experimental results in Ref. [5].
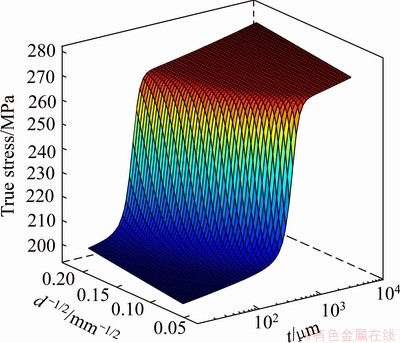
Fig. 6 True stress map surface as function of t and d-1/2 (��=0.1)
3.3 Verification with experiment results for material with free surface
Comparison between the model results and experiment results is shown in Fig. 7. The solid line is the results predicted by the new model, and other symbols are experiment data for three strain levels. Here, grain size d is kept constant. It can be seen that predicted normalized true stress for different strain levels overlap, as well as the experiment data. Compared with experiment data, effects of t/d ratio on evolution of stress can be described appropriately by the calculated curve. In Fig. 7, two critical t/d ratios appear and result in three obvious regions of stress variation. With the decrease of thickness, stress decreases slowly when t/d ratio is large. Then stress drops rapidly after the first critical t/d ratio reaches around 4. The second t/d ratio is around unity, below which stress variation has a little dependency on thickness. It could be noticed that when t/d ratio is less than unity, the predicted curve cannot represent experiment results well enough due to the scatter of experiment data, which is because grain orientations play an important role when there is only one grain in thickness direction.
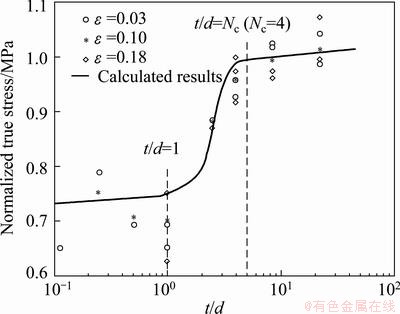
Fig. 7 Relationship between true stress and thickness (d=100 ��m)
From Fig. 6, section profiles are taken in order to compare with experiment data in Refs. [5,8,9], as shown in Fig. 8 and Fig. 9.
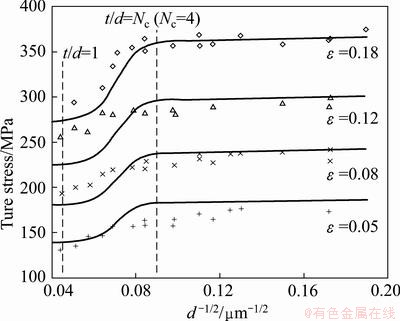
Fig. 8 Evolution of true stress with d-1/2 (t=500 ��m)
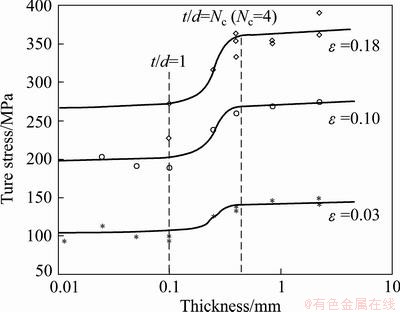
Fig. 9 Evolution of true stress with thickness (d=100 ��m)
Figure 8 compares the predicted Hall-Petch relationship with experimental data for different strain levels, in which t = 500 ��m is kept. True stress curves are in different levels due to different strain levels. As can be seen, the conventional linear Hall-Petch relationship is affected by t/d ratio effect particularly when the number of grains across the thickness is less than Nc with d-1/2 �� 0.09 and larger than unity as shown between two vertical dash lines in Fig. 8. Although the predicted curves can not consist with all the experiment data strictly, like those of ��=0.12, the proposed model can reconstruct the variation trend well generally.
Figure 9 compares the predicted true stress��thickness relationship with experimental data, in which d=100 ��m is kept. True stress curves are in different levels because of different strain levels. In Fig. 9, ��thinner is weaker�� effect is observed and the t/d ratio affects flow tress greatly within the interval of two transition points t/d=1 (t=100 ��m) and t/d=4 (t=400 ��m) as shown between two vertical dash lines in Fig. 9. The predicted curves are in agreement with experiment data.
4 Conclusions
1) Based on the analysis of strain hardening mechanism, a surface model is adopted to analyze the effect of t/d ratio on flow stress quantitatively, and is extended to material with oxide or passivated layer. A criterion is proposed to determine the critical value of t/d ratio Nc. The calculation results show that when the value of t/d ratio is below Nc, flow stress decreases obviously with decreasing thickness (d is kept constant) and increasing grain size (t is kept constant), and the value of Nc is influenced by material properties and the volume fractions of grain boundary, grain interior and surface layer. However, this model could not be applied when the value of t/d ratio is close to or less than 1.
2) A comprehensive model is proposed for thin sheet metal in micro-forming, in which four important factors, grain size d, thickness t, thickness to grain size ratio t/d and surface property on size effects, are considered. The predicted results are verified by some experimental results. It is particularly suitable for thin sheets with one or several grains across the thickness.
References
[1] ENGEL U, ECKSTEIN R. Microforming-from basic research to its realization [J]. Journal of Materials Processing Technology, 2002, 125-126: 35-44.
[2] KELLER C, HUG E, CHATEIGNER D. On the origin of the stress decrease for nickel polycrystals with few grains across the thickness [J]. Materials Science and Engineering A, 2009, 500: 207-215.
[3] FU H H, BENSON D J, MEYERS M A. Analytical and computational description of effect of grain size on yield stress of metals [J]. Acta Materialia, 2001, 49(13): 2567-2582.
[4] LEDERER M,  V, KHATIBI G, WEISS B. Size dependency of mechanical properties of high purity aluminium foils [J]. Materials Science and Engineering A, 2010, 527(3): 590-599.
[5] KELLER C, HUG E, FEAUGAS X. Microstructural size effects on mechanical properties of high purity nickel [J]. International Journal of Plasticity, 2011, 27: 635-654.
[6] KALS T A, ECKSTEIN R. Miniaturization in sheet metal working [J]. Journal of Materials Processing Technology, 2000, 103: 95-101.
[7] GAU J T, PRINCIPE C, WANG J. An experimental study on size effects on flow stress and formability of aluminum and brass for microforming [J]. Journal of Materials Processing Technology, 2007, 184: 42-46.
[8] GEERS M G D, BREKELMANS W A M, JANSSEN P J M. Size effects in miniaturized polycrystalline FCC samples: Strengthening versus weakening [J]. International Journal of Solids and Structures, 2006, 43(24): 7304-7321.
[9] JANSSEN P J M, KEIJSER T H D, GEERS M G D. An experimental assessment of grain size effects in the uniaxial straining of thin Al sheet with a few grains across the thickness [J]. Materials Science and Engineering A, 2006, 419(1-2): 238-248.
[10]  J S, EVANS A G. A microbend test method for measuring the plasticity length scale [J]. Acta Materialia, 1998, 46(14): 5109-5115.
[11] LIU J G, FU M W, LU J, CHAN W L. Influence of size effect on the springback of sheet metal foils inmicro-bending [J]. Computational Materials Science, 2011, 50(9): 2604-2614.
[12] FU M W, CHAN W L. Geometry and grain size effects on the fracture behavior of sheet metal in micro-scale plastic deformation [J]. Materials & Design, 2011, 32(10): 4738-4746.
[13] LI H Z, DONG X H, SHEN Y, DIEHL A, HAGENAH H, ENGEL U, MERKLEIN M. Size effect on springback behavior due to plastic strain gradient hardening in microbending process of pure aluminum foils [J]. Materials Science and Engineering A, 2010, 527: 4497-4504.
[14] PENG L F, LAI X M, LEE H J, SONG J H, NI J. Analysis of micro/mesoscale sheet forming process with uniform size dependent material constitutive model [J]. Materials Science and Engineering A, 2009, 526(1-2): 93-99.
[15] MICHEL J F, PICART P. Size effects on the constitutive behaviour for brass in sheet metal forming [J]. Journal of Materials Processing Technology, 2003, 141(3): 439-446.
[16] DIEHL A, ENGEL U, GEIGER M. Mechanical properties and bending behaviour of metal foils [J]. Proceedings of the Institution of Mechanical Engineers, Part B: Journal of Engineering Manufacture, 2008, 222: 83-91.
[17] LI He-zong, DONG Xiang-huai, SHEN Yu, ZHOU Rui, DIEHL A, HAGENAH H, ENGEL U, MERKLEIN M, CAO Jian. Analysis of microbending of CuZn37 brass foils based on strain gradient hardening models [J]. Journal of Materials Processing Technology, 2011, 212(3): 653-661.
[18] NICOLA L, XIANG Y, VLASSAK J J, van der GIESSEN E, NEEDLEMAN A. Plastic deformation of freestanding thin films: experiments and modeling [J]. Journal of the Mechanics and Physics of Solids, 2006, 54: 2089-2110.
[19] XIANG Y, VLASSAK J J. Bauschinger and size effects in thin-film plasticity [J]. Acta Materialia, 2006, 54(20): 5449-5460.
[20] GRUBER P A, BOHM J, ONUSEIT F, WANNER A, SPOLENAK R, ARZT E. Size effects on yield strength and strain hardening for ultre-thin Cu films with and without passivation: A study by synchrotron and bulge test techniques [J]. Acta Materialia, 2008, 56(10): 2318-2335.
[21] FAN Hai-dong, LI Zhen-huan, HUANG Min-sheng, ZHANG Xiong. Thickness effects in polycrystalline thin films: Surface constraint versus interior constraint [J]. International Journal of Solids and Structures, 2011, 48(11-12): 1754-1766.
[22] MAHABUNPHACHAI S, KOC M. Investigation of size effects on material behavior of thin sheet metals using hydraulic bulge testing at micro/meso-scales [J]. International Journal of Machine Tools and Manufacture, 2008, 48(9): 1014-1029.
[23] SINCLAIR C W, POOLE W J,  Y. A model for the grain size dependent work hardening of copper [J]. Scripta Materialia, 2006, 55(8): 739-742.
[24] YEH F H, LI C L, LU Y H. Study of thickness and grain size effects on material behavior in micro-forming [J]. Journal of Materials Processing Technology, 2008, 201(1-3): 237-241.
[25] WANG Yun, DONG Pei-long, XU Zhen-ying, YAN Hua, WU Jiang-ping, WANG Jing-jing. A constitutive model for thin sheet metal in micro-forming considering first order size effects [J]. Materials & Design, 2010, 31(2): 1010-1014.
[26] GEIGER M, KLEINER M, ECKSTEIN R, TIESLER N, ENGEL U. Microforming [J]. CIRP Annals-Manufacturing Technology, 2001, 50(2): 445-462.
[27] KIM G Y, NI J, KOC M. Modeling of the size effects on the behavior of metals in microscale deformation processes [J]. Journal of Manufacturing Science and Engineering, 2007, 129(3): 470-476.
[28] LAI Xin-ming, PENG Lin-fa, HU Peng, LAN Shu-huai, NI Jun. Material behavior modelling in micro/meso-scale forming process with considering size/scale effects [J]. Computational Materials Science, 2008, 43(4): 1003-1009.
[29] MOLOTNIKOV A, LAPOVOK R, DAVIES C H J, CAO W, ESTRIN Y. Size effect on the tensile strength of fine-grained copper [J]. Scripta Materialia, 2008, 59(11): 1182-1185.
[30] KUMAR R, SXEKELY F, van der GIESSEN E. Modelling dislocation transmission across tilt grain boundaries in 2D [J]. Computational Materials Science, 2010, 49: 46-54.
[31] MURR L E, HECKER S S. Quantitative evidence for dislocation emission from grain boundaries [J]. Scripta Metallurgica, 1979, 13(3): 167-171.
[32] SUITS J C, CHALMERS B. Plastic microstrain in silicon-iron [J]. Acta Metallurgica, 1961, 9(9): 854-860.
[33] WORTHINGTON P J, SMITH E. The formation of slip bands in polycrystalline 3% silicon iron in the pre-yield microstrain region [J]. Acta metallurgica, 1964, 12(11): 1277-1281.
[34] CHAN W L, FU M W. Experimental studies and numerical modeling of the specimen and grain size effects on the flow stress of sheet metal in microforming [J]. Materials Science and Engineering A, 2011, 528(25-26): 7674-7683.
[35] KELLER C, HUG E. Hall-Petch behaviour of Ni polycrystals with a few grains per thickness [J]. Materials Letters, 2008, 62(10-11): 1718-1720.
����������Ϊһ��������ʱ���Գ��εı���ģ��
�� ٻ1�����滳1���º���1�������2���� ��1
1. �Ϻ���ͨ��ѧ ģ��CAD���ҹ����о����ģ��Ϻ� 200030��
2. �ӱ����̴�ѧ ���繤��ѧԺ������ 056038
ժ Ҫ��Ϊ������4������(�����ߴ�d�����Ϻ��t����ȷ���ľ�����Ŀ(t/d)�Լ���������)�Խ���������Ӧ����Ӱ�죬�������ģ�ͺ�λ���ܶȽ�ϣ�����������ȷ�������Ŀ�Դ�ͭ������Ӧ����Ӱ�죬����ٽ羧����Ŀ���ж���Ԥ������������t/d����ijһ�ٽ�ֵʱ����ȷ�������Ŀ������Ӧ����Ӱ����Ժ��ԣ��������ٽ羧����Ŀ��Ӱ�죬�����ߴ�ͺ�ȷֱ�������Ӧ���ı仯����Ҳ�����������Ե�ת�۵㡣�������Ϸ�����������һ���ۺϵIJ��ϱ���ģ�͡���ģ��ͬʱ����������4�����ضԽ���������Ӧ����Ӱ�졣��ģ�͵ļ����������������иߴ�������ʵ�����ݽ��жԱȡ����������Ԥ������ʵ���������Ǻ��Ҿ�����ͬ�ı仯���ơ��ر�������t/d��ֵ�ļ�С��Hall-Petch��ϵ�Լ���ʵӦ���ı仯���߶�����2�����Ե�ת�۵㡣
�ؼ��ʣ�����ģ�ͣ�����Ӧ�������Σ��ߴ�ЧӦ
(Edited by Hua YANG)
Foundation item: Projects (50835002, 50975174, 50821003) supported by the National Natural Science Foundation of China; Projects (200802480053, 20100073110044) supported by the Specialized Research Fund for the Doctoral Program of Higher Education of China
Corresponding author: Xiang-huai DONG; Tel: +86-21-62813435; Fax: +86-21-62813435; E-mail: dongxh@sjtu.edu.cn
DOI: 10.1016/S1003-6326(13)62613-8
Abstract: Effects of four factors on thin sheet metal flow stress were considered, including grain size d, thickness t, grain number across thickness (t/d ratio) and surface property. Surface model was adopted to quantitatively describe the effect of t/d ratio on flow stress for pure copper. It is predicted that when t/d ratio is larger than a critical value, effect of t/d ratio on flow stress can be neglected. Existence of critical t/d ratio changes the Hall-Petch relationship and evolution of flow stress with thickness. A criterion was proposed to determine critical t/d ratio. Then a comprehensive constitutive model was developed to consider all the four factors, with parameters determined by fitting experimental data of high purity Ni. The predicted results show the same tendencies with experiment results. Particularly when t/d ratio decreases, Hall-Petch relationship and evolution of true stress show varied slopes with two transition points.
