
Trans. Nonferrous Met. Soc. China 27(2017) 2691-2703
Enhancing recovery of uranium column bioleaching by process optimization and kinetic modeling
H. ZARE TAVAKOLI1, M. ABDOLLAHY1, S. J. AHMADI2, A. KHODADADI DARBAN1
1. Mining Engineering Department, Tarbiat Modares University, Tehran 14115116, Iran;
2. Nuclear Science and Technology Research Institute, Tehran 113658486, Iran
Received 20 June 2016; accepted 7 November 2016
Abstract:
This research aimed to enhance the column bioleaching recovery of uranium ore by Acidithiobacillus ferrooxidans. Seven factors were examined for their significance on bioleaching using a Plackett-Burman factorial design. Four significant variables ([Fe2+]initial, pH, aeration rate and inoculation percent) were selected for the optimization studies. The effect of these variables on uranium bioleaching was studied using a central composite design (CCD). The optimal values of the variables for the maximum uranium bioleaching recovery (90.27��0.98)% were as follows: [Fe2+]initial=2.89 g/L, aeration rate 420 mL/min, pH 1.45 and inoculation 6% (v/v). [Fe2+]initial was found to be the most effective parameter. The maximum uranium recovery from the predicted models was 92.01%. This value was in agreement with the actual experimental value. The analysis of bioleaching residue of uranium ore under optimum conditions confirmed the formation of K-jarosite on the surface of minerals. By using optimal conditions, uranium bioleaching recovery is increased at column and jarosite precipitation is minimized. The kinetic model showed that uranium recovery has a direct relation with ferric ion concentration.
Key words:
column bioleaching; uranium ore; screening; optimization; kinetic model; Acidithiobacillus ferrooxidans;
1 Introduction
Nowadays, due to decreasing of high-grade uranium ore deposits and also environmental considerations, it will become necessary to process lower grade deposits to fuel the world��s nuclear reactor [1].
The combined chemical/microbial process is known as a bioleaching in which ferric-iron and protons form part of the reactant of the leaching reaction. The leaching agents generate and regenerate by the microorganisms to facilitate the reaction by creating a reactive space in which the leaching takes place and maintains high Fe3+/Fe2+ ratios due to continuous oxidation as part of their respiratory process [2,3]. Bioleaching can avoid the use of the conventional oxidants (MnO2, H2SO4, HClO3) while reducing the acid consumption in the presence of bacteria such as Acidithiobacillus ferrooxidans to continuously regenerate acidic ferric sulfate for uranium leaching and is known to be economical and environmentally acceptable [4,5]. The Fe2+ oxidation is an energy source for the growth of bacteria, so parameters that may influence bioleaching are the concentrations of Fe2+ and Fe3+ and the solution pH. It should be noted that the Fe3+ concentration is a limiting factor in bacterial growth inhibiting the molecular oxygen uptake [5-7].
Lower recovery and longer extraction time are main limitations of bioheap leaching that is related to a limited fundamental understanding of the process. Understanding of the physico-chemical, biological and environmental factors that drive a heap and affect recovery of metal from ore helps to improve the main process [8-13]. Physical and chemical parameters include temperature, pH, redox potential, O2 and CO2 contents and availability, nutrient availability, Fe3+ concentration and presence of inhibitors. Biological parameters include microbial activity, attachment to ore particles, adaptation abilities and inoculums. Ore characteristics include mineral type and composition, grain size, porosity, acid consumption, free surface area, hydrophobicity, galvanic interactions and formation of secondary minerals [2,12].
Column bioleaching, as a model of heap leaching, was investigated in previous studies for the recovery of uranium from different ores, but the longtime operation and slow leaching kinetics are some of the drawbacks [14-19]. To improve the efficiency of the process, it is necessary to determine and optimize the predominant parameters. GUAY et al [14] investigated uranium bioleaching in a column by Acidithiobacillus ferrooxidans. The results revealed that the maximum uranium biorecovery was 68% at the 9th day with initial ferrous ion concentration of 5 g/L and pH 2.3. JUNIOR [15] showed that uranium bioleaching recoveries during 45 d by small and tall columns were 60% and 50%, respectively. Uranium bioleaching in columns was also investigated by MUNOZ et al [16] for the Spanish uranium ore (0.087% U3O8) with 85% uranium recovery. Uranium bioleaching recovery of 96.82% was achieved by QIU et al [17] in the column on the 97th day. Several investigations by ABHILASH et al [18,19] about column bioleaching of different uranium ores exhibited uranium recoveries of 58.9% and 66% at pH 1.7 for 40 d. Furthermore, the authors�� previous study on column bioleaching of uranium ore showed that the maximum uranium recovery under the optimum conditions (particle size d80 5 mm, irrigation rate 0.34 L/(m2��min-1), and aeration rate 210 L/(m3��min-1)), was 63.85% [20]. For comprehensive understanding and control of the underlying fundamental processes, the study of the key parameters in the different ranges for the bioleaching is necessary. In this study based on physical, chemical and biological parameters, ore characteristics and hydrodynamic factors, different parameters such as initial Fe2+ concentration, initial pH, aeration rate, irrigation rate, particle size, temperature and inoculation percent were evaluated for enhancing the recovery of uranium bioleaching by the indigenous Acidithiobacillus ferrooxidans in column. A multi-objective optimization strategy for enhancing uranium bioleaching recovery was applied using response surface methodology (RSM) to find the optimal values for different factors. Finally, kinetic modeling of uranium bioleaching in column was studied under optimum conditions.
2 Experimental
2.1 Ore characterization
A bulk of low grade uranium ore was obtained from the Saghand Uranium Mine in the center of Iran. The bulk sample was initially crushed by a jaw crusher from 150 mm top size down to 20 mm. The sample was prepared in two particle sizes: d80 of 2.5 and 12.5 mm. The ore particle size distribution and uranium content are shown in Table 1. The chemical composition of the uranium ore is given in Table 2. The X-ray diffractometer (XRD, D8-Advance, Bruker AXS) was used to qualitatively analyze the mineral phases at room temperature (Fig. 1(a)). The analysis results showed that major minerals are magnetite, talc, actinolite, antigorite, pyrite and hematite. The sulfides are mainly presented by pyrite, which is 5.4% in the sample. The uranium oxide is located in the magnetite grains or intergrowth with them (Fig. 1(b)). The mineralogy of ore showed that uraninite (average size 100 ��m) was the main uranium mineral in the ore (Fig. 1(c)).
Table 1 Particle size distribution and uranium content of ore sample
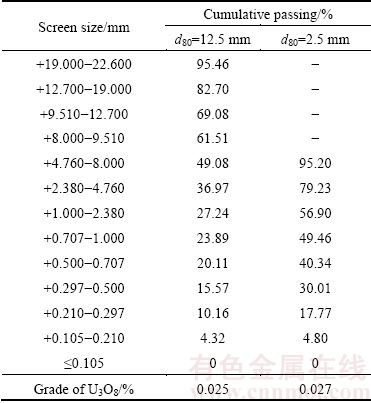
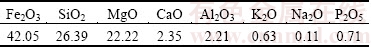
Table 2 Chemical composition of ore sample (mass fraction, %)
2.2 Microorganism and media
Previously isolated bacterium Acidithiobacillus ferrooxidans strain ZT-94 (NCBI GeneBank accession number KU726246.2) from uranium mine was used in this work. This isolate was grown in modified medium (pH 2) with 20 g/L FeSO4��7H2O, 2.0 g/L (NH4)2SO4, 0.5 g/L MgSO4��4H2O, 0.5 g/L K2HPO4, 0.1 g/L KCl and 0.01 g/L Ca(NO3)2��4H2O were incubated in Erlenmeyer flasks of corresponding medium on a rotary shaker at 150 r/min and 30 ��C. The cell concentration was about 2.8��107 cell/mL except for the control column.
2.3 Analytic methods
Samples of leaching solution were regularly withdrawn for concentration measurement of uranium and iron. Uranium concentration was determined by ICP-OES (Perkin Elmer Optima 2000 DV). 5-sulfosalicylic acid (SSA) testing was used for ferric ion and total iron measurement to evaluate the bacterial activity in ferrous ion oxidation to ferric using a standard diagram of absorbance [21]. The pH and the redox potential values were measured with a pH meter (Metrohm 827) and with a combined Pt-ring electrode (reference electrode Ag/AgCl, reference electrolyte 3 mol/L KCl), respectively. The number of free bacteria was estimated using a Neubauer chamber with a depth of 0.1 mm and an area of 0.0025 mm2. An optical microscope (Ceti) with a magnification of 1000 was used in this work.
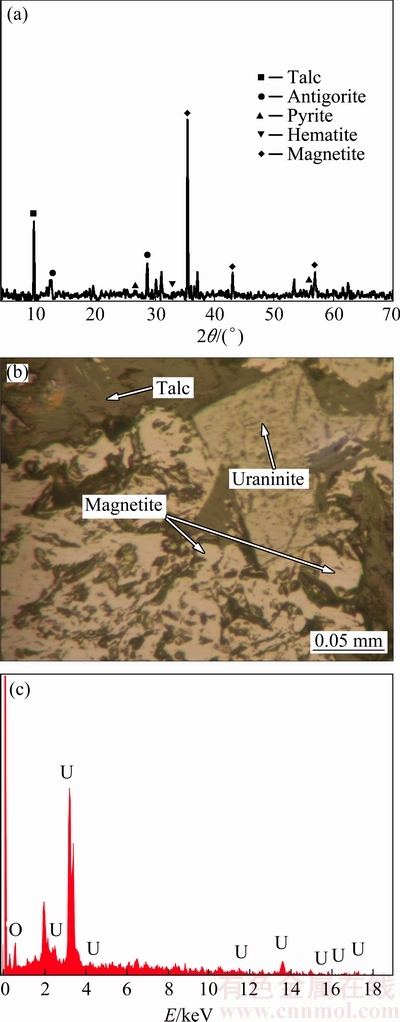
Fig. 1 XRD pattern of uranium ore (a), picture of mineral constituents of Saghand uranium ore under optical microscope (b) and EDX spectrum of uraninite (c)
2.4 Column bioleaching experiments
Six columns were fabricated from 5 mm thick glass, which was 50 cm high with an internal diameter of 7.5 cm. A plexiglass support plate with multiple holes (d1.5 mm) was fixed at the bottom of the column, allowing air to be injected and dispersed uniformly over the particle bed in the column. A 4 mm inert silica rock drainage layer was placed at the bottom of the column to prevent blockage during the percolation stage. The leaching solution was passed through the ore sample by gravity force and collected in PVC containers. The leaching solution was not re-circulated. The columns were maintained isotherm using an external heating coil wrapped around the columns and thermostat.
In order to prevent clogging in the space between the larger ore particles by fine particles and poor interaction between the ore and leach solution, the agglomeration process was used. The agglomeration of ore was done for 10 min at 50 r/min with solution containing 1.3 mol/L H2SO4 with humidities of 6.25% and 5.05% for particle sizes 2.5 and 12.5 mm, respectively. The agglomerated 3 kg ore was loaded in the columns. at the end of all experiments the columns were emptied and the contents were dried and sampled.
2.5 Plackett-Burman design
According to physical, chemical and biological parameters and ore characteristics, irrigation rate, aeration rate, the concentration of initial ferrous, pH, temperature, inoculation percent and particle size were picked up. The most significant parameters in column bioleaching of uranium ore were identified via the Plackett-Burman design. All of the parameters were represented at two levels. The selected ranges of parameters were determined based on authors�� previous studies and literature review. The uranium recovery was considered as a response of the Plackett-Burman design and the main effects of parameters on the bioleaching efficiency were estimated. The experimental parameters with the name, symbol code and actual level are shown in Table 3. Finally, four more efficient and significant factors that had a greater impact on the uranium bioleaching were identified for the optimization step. The Plackett-Burman factorial design did not describe the interaction among the factors, and it was used to screen and evaluate the important factors that affect the response. The experimental design and the statistical analysis of the data were performed using the Design Expert (version 7.1.4). Furthermore, the effects and the interactions of the four factors were examined in order to find the optimal conditions by using central composite design (CCD), the most popular response surface method.
Table 3 Experimental parameters in two levels used for column bioleaching of uranium ore by Acidithiobacillus ferrooxidans using Placket-Burman design

2.6 Response surface methodology
Response surface methodology (RSM) applies the mathematical and the statistical approaches by the aim of optimizing a response which is influenced by several independent variables. Although the mathematical model is empirical, knowing the detailed reaction mechanisms during modeling is not necessary [22]. The number of CCD experiments is calculated based on 2n factorial designs with 2n axial points and n0 center points (2n+2n+n0) [23]. A four-variable CCD using 30 experiments consisting of 16 factorial design points (24), 8 axial points and 6 center repeating points (to determine experimental error) was used to optimize the parameters. Each factor was defined at five levels (-��, -1, 0, +1, +��), where �� is the distance of the axial point from the center. For a full factorial design, the value of �� is determined as 2k/4, where k is the number of independent parameters. Empirical model describing the experimental results was developed using data collected from the designed experiments. To predict the uranium recovery, the model was selected.
2.7 Validation experiments
Three independent column bioleaching experiments were conducted applying the optimal conditions obtained from CCD design to confirm the agreement of both results (uranium recovery) achieved from the model and experiments.
2.8 Derivative kinetic model
The kinetics of leaching can generally be described by a rate expression of the following form [24]:
 (1)
(1)
where K(T) is a rate constant which is a function of temperature and initial mineral grain size, F(C) is a function of solution composition such as [Fe3+], [Fe2+] and proton. Assuming that temperature and particle size are all fixed, K(T) will be constant. W(1-X) is a semi-empirical function of the fraction of unreacted mineral, which represents the topology changing of the mineral surface over the leaching period. Often, for finely ground particles, W(1-X) conforms to some well-known forms, such as the shrinking sphere or shrinking core model [24].
For chemical function, F(C), previous studies showed that the leaching of UO2 by chemical oxidants took place by an electrochemical mechanism in acidic solutions. The kinetics of electrochemical leaching of UO2 considers the relationship between the rate of transfer of charge and the potential for the half-cell reactions Eqs.(2) and (3) [25,26].
The half reaction for oxidation of UO2,
 (2)
(2)
The reduction of oxidant in the solution, written as
 (3)
(3)
For different [Fe3+] and [Fe2+] in solution, F(C) can be one of the following cases [25-27]:
1) At high ratio of Fe3+/Fe2+, due to the anodic oxidation of Fe2+ the partial anodic current is negligible compared with that due to the anodic oxidation of UO2. Under these conditions, F(C) is a function of [Fe3+]m, m��0.5.
2) By increasing [Fe2+] in the solution, the rate of leaching of UO2 decreases. The anodic oxidation of UO2 is a function of [Fe3+]/[Fe2+] ratio. Under these conditions, F(C) is a function of ([Fe3+]/[Fe2+])m, m��0.5.
3) At higher [Fe2+], the anodic oxidation rate of Fe2+ on the UO2 surface is a function of ([Fe3+]/[Fe2+])m, m��0.5.
In bioleaching process because of bacterial activity, the concentration of ferric as an oxidant varies during the bioleaching process. To take account of the variation of [Fe3+] and [Fe2+], the model should be modified by changing F(C) by increasing the time.
The topological function used here is a simple power-law expression of the fraction unreacted [24]:
 (4)
(4)
where �� represents the leaching of any grain topology from uniform spheres to a broad range of grain sizes. If mineral particles are assumed to be spherical and to shrink at a rate proportional to the progress of the leaching, it can be equal to 2/3 (shrinking sphere or core model). It may also be as high as 3 when the distribution of the effective grain size is particularly wide [24,28]. Equation (1) can be integrated to the following equation:
 (5)
(5)
The parameter values of K, �� and m (power of oxidant) obtained by the minimization of mean squared error (MSE) between optimum conditions and model data by using Eq. (5).
3 Results and discussion
3.1 Selection and evaluation of main factors in column bioleaching of uranium
Using the Plackett-Burman screening design, seven assigned factors were screened in 12 experimental designs (Table 4). All the experiments were carried out in duplicate and the averages of the uranium extraction rates were taken as the response. The wide variation of uranium recovery from (4.75��0.47)% to (87.29��2.09)% showed the importance of optimization of the main factors to attain higher yields. Figure 2 depicts the estimated effect of each factor on uranium bioleaching. Initial Fe2+ concentration, pH, aeration rate and inoculation percent with higher effect, were selected for further optimization. It is seen from Fig. 2 that the most effective factor is initial Fe2+ concentration with positive effect, indicating that increasing initial Fe2+ concentration from 0-4 g/L increases uranium recovery, which is in accordance with the growth of bacteria depending on the Fe2+ oxidation as an energy source. The function of bacteria is mainly to enhance the oxidative leaching by Fe3+ ions from the biocatalysis of the reoxidation of Fe2+ by oxygen. Additional Fe3+ concentration only enhances the initial leaching rate but not the final leaching yields [28]. Fe addition can cause precipitation and heap clogging problems. The solubility of iron species is defined by their concentrations in solution. Thus, the optimization of these parameters may greatly improve the uranium recovery.
Table 4 Twelve-trial Placket-Burman design matrix for seven variables with coded values along with observed metal recovery
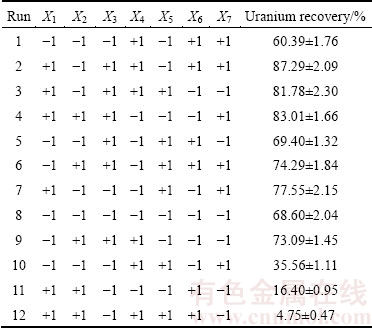
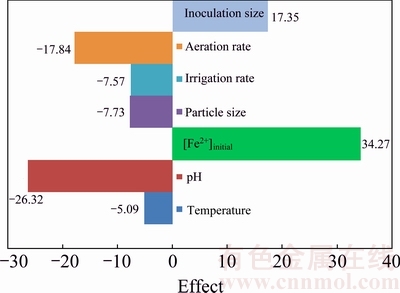
Fig. 2 Estimated effects of seven variables via Plackett�CBurman design on column bioleaching of uranium ore
The second important factor was pH with a negative effect on uranium bioleaching in columns in the range of 1-2.25, which is due to ferric ion and acid regeneration by microbial population. Thus, accurate determination of the leaching solution pH and acid consumption during uranium ore bioleaching is important for evaluation of leaching performance and cost. The pH has a significant effect on the dissolution process, controlling the oxidation of microorganisms [29].
Aeration rate, as the third significant factor, has a negative effect on the column bioleaching of uranium. Oxygen is often a limiting factor in heap bioleaching and therefore, aeration helps to increase leaching rates.
The last important factor, inoculation percent, has a positive effect on the bioleaching rate as the increase in inoculation percent raises the cell concentration in the medium and leads to better extraction of metals. But increasing inoculation percent causes some ions to precipitate on the ore in column. The insignificant variables were neglected and the optimum values of the four significant variables were further determined by a CCD design. All other variables used in the trials remained at the high or low level, according to the sign of their effects, except for temperature of 30 ��C.
3.2 Optimization of effective parameters by central composite design (CCD)
3.2.1 CCD and fitted regression model related to uranium recovery
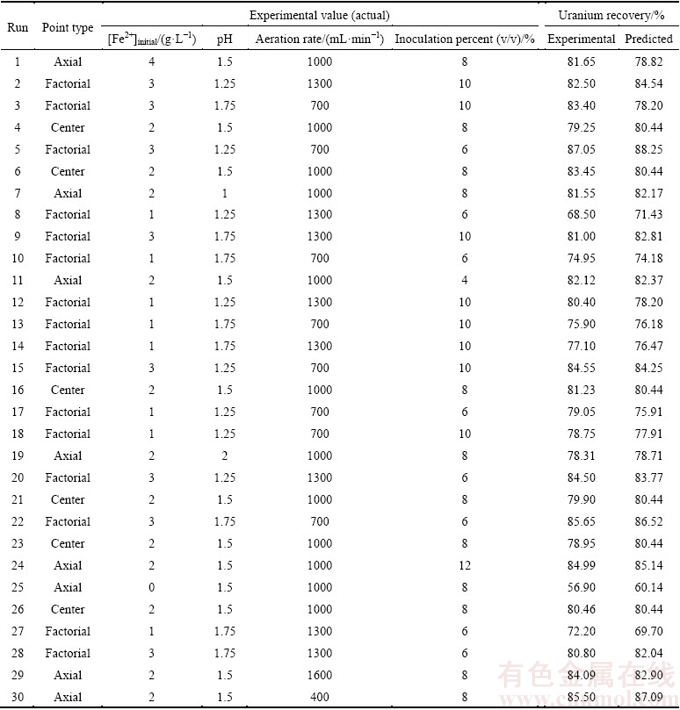
In this research, 30 column bioleaching experiments were performed for a four-factor design to satisfy a CCD. The boundaries for each variable (obtained from screening) are presented in Table 5. Data obtained from the experiments were statistically analyzed to identify the significance of the factors, their optimal values and interactions, also to attain the best possible regression model for the uranium recovery according to these factors. The design matrix and the corresponding results of CCD experiments are shown in Table 6.
Table 5 Selected parameters at different levels used for column bioleaching of uranium ore experiment
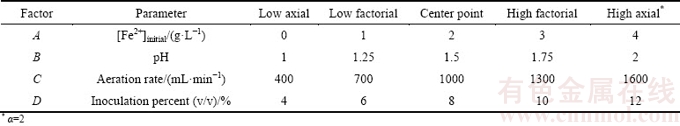
Table 6 Experimental plan based on CCD and results of uranium recovery
The modified quadratic model was used to predict uranium recovery. The model for column bioleaching of uranium using coded factors is presented in the following equation:
��=80.44+4.67A-0.87B-1.05C+0.69D-1.50AD+1.19CD-2.74A2+1.14C2+0.83D2 (6)
where �� is the uranium recovery (%); A, B, C and D are the coded values of the test variables, [Fe2+]Initial (A) in g/L, pH (B), aeration rate (C) in mL/min and inoculation percent (D) in % and the constant values of 80.44 is the offset term. Multiple letters (such as ��AD��) denote an interaction between the parameters.
The relative contribution of each term of the independent variable to each dependent variable (i.e., the predictor) was directly measured by the respective coefficient in the fitted model. Equation (6) shows that initial Fe2+ concentration has an important and positive effect on uranium recovery. Aeration rate and pH have a negative effect and inoculation percent has a positive effect on uranium column bioleaching. The empirical model also demonstrates that there is a negative interaction between [Fe2+]Initial and inoculation percent, while the interaction between aeration rate and inoculation is positive.
The best way to identify substantive departure from normality is to construct a normal probability plot that can evaluate the normality of a data set. A straight line on a normal probability plot shows that the error terms or residuals follow a normal distribution. Figure 3 shows the normal probability plot for uranium. All of points align fairly close to a straight line, indicating nearly normal data. In order to achieve an accurate polynomial function of the 2nd order, each experimental factor was evaluated with respect to linear, quadratic and interaction components. Multiple regression analysis was utilized to calculate the coefficients of the model.
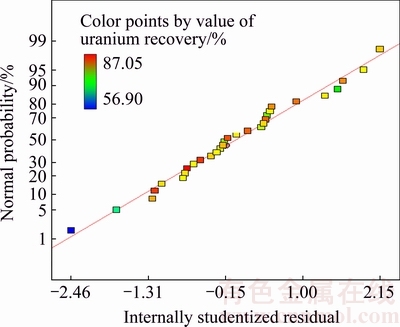
Fig. 3 Normal plot of residuals
The results of analysis of variance (ANOVA) are shown in Table 6. This statistical tool is required to test the significance and the adequacy of the model. Higher F-values indicate the increased importance of the factors [26]. In general, the calculated F-value should be several times greater than the tabulated value. The p-value in ANOVA indicates that the model is significant at R2 =0.9211 for uranium recovery. A p-value <0.05 indicates that the model term is significant at a 95% confidence level. p-values for the lack of fit were >0.05 and not significant, confirming the fitness of the model. As shown in Table 7, the ��Prob >F�� p-value for the model is <0.0001 (p<0.05), which indicates that the model is statistically significant with a confidence interval of 99.99%. The model F-value (25.93 for uranium recovery) implies that the model is significant and that there is only a 0.01%.
Table 7 Results of analysis of variance
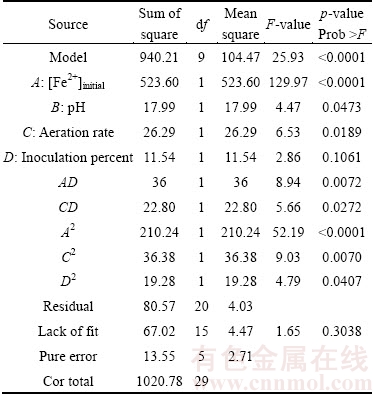
Figure 4 shows the data from the statistical model (Eq. (6)) versus experimental data (predicted vs actual). The locations of points around the diagonal line confirm the correlation of the predicted and experimental data.
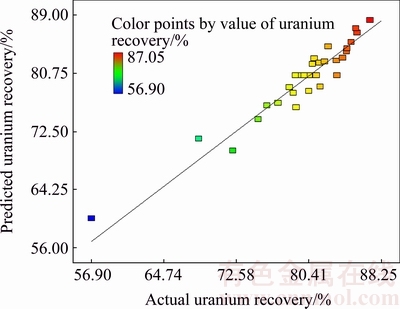
Fig. 4 Comparison of actual and predicted values for uranium recovery
The quality of fit of the model equation is expressed with the coefficient of determination (R2). The coefficient of determination (R2) provided the proportion of the total variation in the response variable described by the predictors included in the model. The coefficient of determination (R2) of the model is 0.9211 for uranium recovery, which further indicates that the model is suitable for adequate representation of the real relationships among the variables.
The coefficient of variance (CV) for the uranium recovery was determined to be 2.51%. The CV as the ratio of the standard error of estimate to the mean-value of the observed response (as a percentage) was used as a measure of reproducibility of the model. As a general rule, a model can be considered reasonably reproducible if the CV is not greater than 10%. The model showed no lack of fit, and the adequate precision value, which provided a measure of the signal-to-noise ratio, was found to be 24.263, which indicates an adequate signal. A signal-to-noise ratio >4 is desirable. All results showed that the predicted model for the uranium recovery can be used to build the space defined by the CCD.
3.2.2 Response surface plotting and column bioleaching optimization based on maximum uranium recovery
To have a better view of the results and to realize the relationship among the four factors, the three- dimensional response surface plots of uranium recovery as well as the contour plot of the regression model are presented in Figs. 5 and 6. Due to the meaningful effects of the interactions on uranium recovery, the axes in these plots were selected as the interaction statements with p<0.05 and the largest absolute coefficients in the fitted model: AD ([Fe2+]initial �� inoculation percent) and CD (aeration rate �� inoculation percent). In the model, A ([Fe2+]initial) was a significant variable affecting the response and this variable showed significant interaction with D (inoculation percent). Based on the predicted model, variable C (aeration rate) had interaction with variable D.
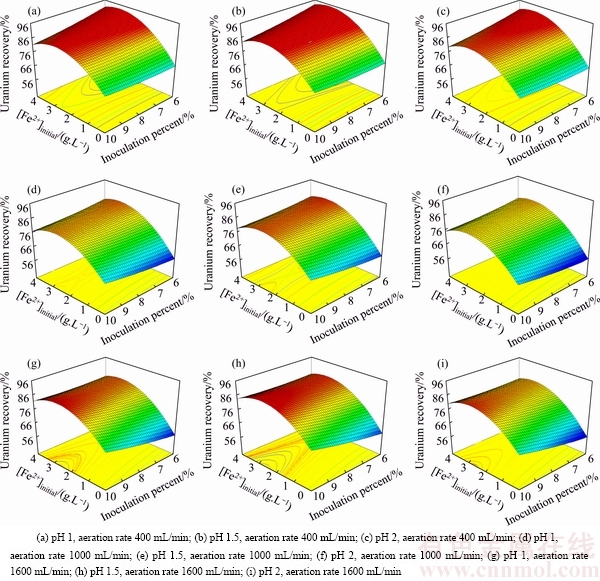
Fig. 5 Surface plots of interactive effect ([Fe2+]initial and inoculation percent) for uranium recovery at different levels of pH and aeration rate
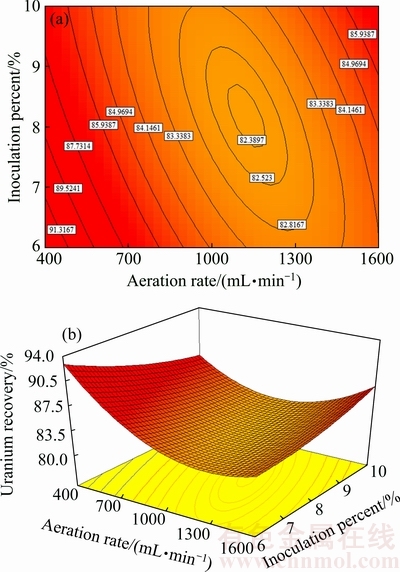
Fig. 6 Contour plot (a) and surface plot (b) of uranium recovery vs aeration rate and inoculation percent at [Fe2+]initial and pH values of 3 g/L and 1.5, respectively
Figure 5 shows three-dimensional surface plot of the empirical model for uranium recovery as a function of four factors. [Fe2+]initial and inoculation percent were used for RSM plots of uranium recovery, while the pH and aeration rate increased from 1 to 2 (at three levels from left to right) and from 400 to 1600 (at three levels from top to bottom), respectively. As shown in Fig. 5, the maximum uranium recovery was achieved at [Fe2+]initial about 3 g/L. In all conditions (Fig. 5) by increasing Fe2+ concentration from 0 to 3 g/L, uranium recovery increased while further increasing concentration from 3 to 4 g/L uranium recovery decreased. A curvature type relationship existed between the uranium recovery and the initial Fe2+ concentration. The importance of using biogenic Fe3+ in the biooxidation process should be emphasized as it plays a major role. Thus, bioleaching in the presence of Fe3+ can be exploited to achieve the higher leaching rate. Biological oxidation of Fe2+ has been proved to be a significant step in dissolving uranium. Fe2+ is readily oxidized to Fe3+ which can serve as an electron donor [30,31]. The uranium recovery is strongly influenced by initial Fe2+ concentration. It can be seen that, at low Fe2+ concentration, uranium recovery has the minimum value.
According to the surface plots, the highest recovery of uranium bioleaching is obtained at 6% inoculation percent, [Fe2+]initial �� 3 g/L, minimum aeration rate 400 mL/min and pH 1.5. At three levels of aeration rate (400, 1000, 1600 mL/min) by increasing the pH from 1 to 1.5, uranium recovery increased. With further increase of pH from 1.5 to 2, the uranium recovery decreases to its lowest values. The main reason for decreasing the uranium recovery at pH less than 1.5 is the inhibition of growth of the cells. An acidic environment must be maintained in order to keep Fe3+ and uranium in solution and facilitate leaching [32]. Acidity is controlled by the oxidation of iron, sulfur, metal sulfides, and by the hydrolysis of ferric iron.
Figure 5 shows that by changing the aeration rate from 1000 to 400 mL/min (at different levels of pH) the uranium recovery increased at low values of inoculation percent. On the other hand, when the aeration rate increasd from 1000 to 1600 mL/min, the uranium recovery increased but not as much as that at low aeration rate, besides the plot surface changed and maximum uranium recovery happened at the high value of inoculation percent (10%). The less the aeration rate and inoculation percent are, the lower the operational cost in the bioleaching process is. From Fig. 5 and Eq. (6), the inoculation percent was almost linear and had less considerable effect on the uranium bioleaching. Actually, the inoculation concentration does not significantly change the overall uranium extraction. This behaviour can be explained by the fact that bacteria initially grow exponentially, eventually the bacterial concentrations all reach the same peak (and drop due to ferrous ion limitation) regardless of the initial bacterial concentration. It takes longer for the bacteria to grow to the peak concentration. As presented in Fig. 5, the highest uranium recovery corresponded to the lowest value of inoculation percent (6%), aeration rate (400 mL/min), [Fe2+]initial �� 3 g/L and pH 1.5.
The dependence of uranium recovery on aeration rate and inoculation percent is shown by the second-order isoresponse counter and surface plot when [Fe2+]initial and pH were fixed at 3 g/L and 1.5, respectively. Availability and supply of oxygen and carbon dioxide by control of aeration rate help the growth of bacteria in different parts of column. The air transport is a function of column permeability and saturation. According to Figs. 5 and 6, the selected minimum level of aeration rate based on irrigation rate and low water saturation was adequate for uranium extraction by bacteria. As presented in Fig. 6, the highest uranium recovery corresponded to the lowest value of aeration rate and inoculation percent. If oxygen is sufficiently present at all the points of heap, an increase in aeration rate does not increase the leaching rate [12]. This is because mass transfer into the liquid phase is driven primarily by oxygen partial pressure in air, which would not change at the increased flow rates. However, the forced aeration of heaps has shown no statistically significant effect on leach kinetics. The forced aeration may be beneficial to operations where the gaseous porosity is marginal [33].
3.3 Determination of optimal conditions and validation of model
According to the numerical optimization by Design-Expert 7.1.4, and based on the maximum desirability function under optimal conditions as follows: [Fe2+]initial=2.89 g/L, aeration rate 420 mL/min, pH 1.45 and inoculation percent 6% (v/v), the maximum uranium recovery was predicted as 92.01%. This value is in agreement with the results obtained from the three-dimensional surface and contour plots. For the verification of these predictions, three independent bioleaching experiments and one experiment without bacteria (control test) under optimal conditions were carried out for 21 d. The results of the experiment performed under the optimal conditions are presented in Table 8. It is notable that the experimental and the predicted values from the polynomial model were in close agreement at a 95% confidence interval.
Figure 7(a) shows uranium ore column bioleaching by Acidithiobacillus ferrooxidans under optimal conditions. As can be seen, the maximum recovery of uranium is 90.27% at day 21, which is in accordance with the recovery predicted by the model from CCD design experiments.
Figure 7(b) shows the variation of pH and redox potential (ORP) vs time during uranium ore column bioleaching. According to Fig. 5, uranium extraction is directly related to Fe3+ concentration (ORP). The oxidation of ferrous to ferric ions by microorganism (Eq. (7)) produces adequate ferric ion for uranium leaching (Eq. (8)). The main role of the microorganisms is both to regenerate the leaching agents (Fe3+) and to facilitate the reaction by creating a reaction space in which the leaching process occurs [34-36]. Pyrite and magnetite minerals in the ore are responsible for increasing Fe content in solution. The dissolution of pyrite and magnetite is done by the bacterial oxidation and sulfuric acid, respectively (Eqs. (9) and (10)).

 (7)
(7)
 (8)
(8)

 (9)
(9)
 (10)
(10)
The presence of low Fe2+ level and high amount of Fe3+ produced biogenically, yielding high uranium recovery. The relationship among uranium dissolution, ferrous and ferric ions, and redox potential in the solution suggests that uranium recovery is accompanied by indirect leaching mechanism which is in accordance with other research results [5,31,37,38].
Table 8 Optimum process and validation experiment results
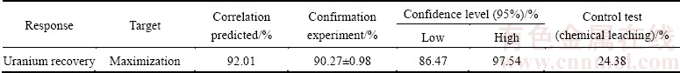
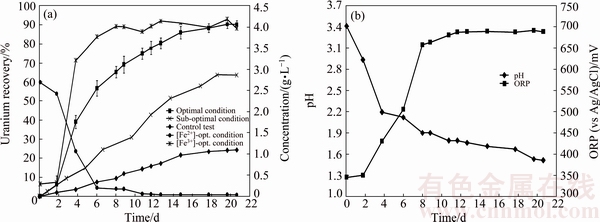
Fig. 7 Uranium recovery vs time under optimal conditions, sub-optimal conditions, control test and variation of Fe3+ and Fe2+ concetraions vs time under optimal conditions (a), and variation of pH and ORP vs time under optimal conditions (b)
For the control test (cell free), as shown in Fig. 7(a), the maximum uranium recovery is 24.38%. It is clear that without bacteria in the medium, there is not any oxidizing agent, low recovery of uranium is related to acidic medium and ferric ion was produced during slight chemical oxidation by air. By comparing bioleaching and chemical leaching, the effect of ferric ion and bacterial oxidizing in uranium bioleaching would be considerable. The results of uranium bioleaching under optimum conditions confirm the statistical model (Eq. (6)) priority of parameters. The pH variation from Fig. 7(b) shows that with increasing time, the pH decreased from 2.93 to 1.51. The pH decreasing progressively is due to sulfur oxidation by bacteria and precipitation of jarosite (Eq. (10)). A pH of 1-2.5 is considered suitable for the bioleaching; however, for rapid uranium extraction kinetics, a high Fe3+/Fe2+ ratio is necessary which determines the ORP of the leach liquor [22]. Active iron oxidizing bacteria, such as A. ferrooxidans, maintain high Fe3+/Fe2+ ratios due to continuous oxidation as part of their respiratory processes (Figs. 7(a) and (b)).
At the middle or end of the process of bioleaching, the concentrations of Fe3+ and  reached at a certain level which facilitated the production of jarosite precipitation with cations like K+, Na+ , NH4+ or H3O+ as follows [12,31]:

 (11)
(11)
where M= K+, Na+, NH4+ and H+.
The XRD analysis of the bioleaching residue under optimum conditions (Fig. 8) proved the formation of K-jarosite. The jarosite precipitated on the mineral surface and decreased the effectiveness of reagent and mineral surface interaction and scavenge available oxygen. In other words, the precipitates inhibited metal oxidation by microorganisms. The passivation layer is less reactive than uranium mineral and may inhibit the flow of electrons and oxidants to main minerals.

Fig. 8 XRD pattern of uranium ore bioleaching residue under optimum conditions
By using optimization method, ferrous ion concentration decreased from 4 to 2.89 g/L, resulting the fact that jarosite precipitation decreased and uranium bioleaching kinetics increased in comparison with pervious study (uranium recovery was 63.85% (Fig. 7(a), sub-optimal conditions) [20]). Under the optimized conditions, the model established in this work was demonstrated very successful results, because of higher uranium recovery and lower process cost.
3.4 Kinetic model of uranium bioleaching in column
For deriving kinetic model from Eq. (5), according to changing [Fe3+] and [Fe2+] by bacterial activity (Fig. 7(a)), F(C) has to be solved by considering the variation of [Fe3+] and [Fe2+] in the solution during the reaction time from Fig. 7(a). According to Fig. 7(a) by increasing the time, [Fe3+] increased and [Fe2+] reached the minimum values. The presence of Fe2+ in the first 6 d based on Cases 1 and 2 (Section 2.8) showed that, F(C) is a function of [Fe3+] or [Fe3+]/[Fe2+]. By minimization of mean squared error (MSE), the kinetic model parameters K, �� and m were obtained to be 0.067 d-1, 1.24 and 0.61, respectively.
Figure 9 shows the fitted curves on the experimental data of the conversion X(U) vs time. Also, Fig. 9 shows that the model with [Fe3+]0.61 has better fitting than the model with (Fe3+/Fe2+)0.5, proving direct relation between uranium column bioleaching and [Fe3+].

Fig. 9 Experimental data under optimum conditions and kinetic model of uranium bioleaching in column with F(C)=[Fe3+]0.61 and (Fe3+/Fe2+)0.5
Based on the previous investigation, the kinetics equation of uranium bioleaching in column with R2=0.99 can be written in the following form:
 (12)
(12)
4 Conclusions
The column bioleaching of uranium ore by indigenous strain of Acidithiobacillus ferrooxidans was carried out to investigate the optimum condition for enhancing uranium recovery. The four significant parameters (initial ferrous ion concentration, pH, aeration rate and inoculation percent) were selected for further optimization by applying Plackett-Burman design. Afterwards, these four factors were optimized via CCD as, [Fe2+]initial =2.89 g/L, aeration rate 420 mL/min, pH 1.45 and inoculation percent (v/v) 6%. The confirmation experiment approved the highest extraction of uranium under optimal conditions as 90.27%. ANOVA results showed that the most effective factor for uranium recovery was initial ferrous ion concentration and the less effective factor was inoculation percent. A couple of statistically significant interactions are derived between [Fe2+]initial and inoculation percent as well as aeration rate and inoculation percent. The analysis of the uranium ore bioleaching residue under different conditions confirmed the formation of K-jarosite on the surface of minerals. By using optimal conditions uranium bioleaching recovery increased at column and jarosite precipitation was minimized. The kinetic model for uranium column bioleaching is expressed as 
 which is consistent with experimental results.
Acknowledgments
The authors thank the Tarbiat Modares University & Nuclear Science and Technology Research Institute for their financial support.
References
[1] GILLIGAN R, NIKOLOSKI A N. The extraction of uranium from brannerite��A literature review [J]. Minerals Engineering, 2015, 71: 34-48.
[2] GHORBANI Y, BECKER M, MAINZA A N, FRANZIDIS J P, PETERSEN J. Large particle effects in chemical/biochemical heap leach processes a review [J]. Minerals Engineering, 2011, 24: 1172-1184.
[3] GHORBANI Y, BECKER M, PETERSEN J, MAINZA A N, FRANZIDIS J P. Investigation of the effect of mineralogy as rate-limiting factors in large particle leaching [J]. Minerals Engineering, 2013, 52: 38-51.
[4] TUOVINEN O H, HSU C J. Effect of pH, iron concentration, and pulp density on the solubilisation of uranium from ore material in chemical and microbiological acid leach solutions: Regression equation and confidence band analysis [J]. Hydrometallurgy, 1984, 12: 141-149.
[5] ABHILASH, PANDEY B D. Role of ferric ions in bioleaching of uranium from low tenor Indian ore [J]. Canadian Metallurgical Quaterly, 2011, 50(2): 102-112.
[6] FOWLER T A, HOLMES P R, CRUNDWELL F K. On the kinetics and mechanism of the dissolution of pyrite in the presence of Thiobacillus ferrooxidans [J]. Hydrometallurgy, 2001, 59: 257-270.
[7] HO E M, QUAN C H. Iron(II) oxidation by SO2/O2 for use in uranium leaching [J]. Hydrometallurgy, 2007, 85: 183-192.
[8] AHONEN L, TUOVINEN O H. Bacterial leaching of complex sulfide ore samples in bench-scale column reactors [J]. Hydrometallurgy, 1995, 37: 1-21.
[9] ACEVEDO F. Present and future of bioleaching in developing countries [J]. Electronic Journal of Biotechnology, 2002, 5(2): 52-56.
[10] MALIK A, DASTIDAR M G, ROYCHOUDHURY P K. Factors limiting bacterial iron oxidation in biodesulphurization system [J]. International Journal of Mineral Processing, 2004, 73: 34-42.
[11] DREISINGER D. Copper leaching from primary sulfides: Options for biological and chemical extraction of copper [J]. Hydrometallurgy, 2006, 83: 10-21.
[12] PRADHAN K C, NATHSARMA K, SRINIVASA R, SUKLA L B, MISHRA B K. Heap bioleaching of chalcopyrite: A review [J]. Minerals Engineering, 2008, 21: 355-362.
[13] MELLADO M E, CISTERNAS L A,  E D. An analytical model approach to heap leaching [J]. Hydrometallurgy, 2009, 95: 33-42.
[14] GUAY R, SILVER M, TORMA A E. Ferrous iron oxidation and uranium extraction by Thiobacillus ferrooxidans [J]. Biotechnology and Bioengineering, 1977, 19: 727-740.
[15] JUNIOR O G. Bacterial leaching of uranium ore from Figueira-PR, Brazil, at laboratory and pilot scale [J]. FEMS Microbiology Reviews, 1993, 11: 237-242.
[16] MUNOZ J A, BLASQUEZ M L, BALLESTER A, GONZALEZ F. A study of the bioleaching of a Spanish uranium ore. Part III: column experiments [J]. Hydrometallurgy, 1995, 38: 79-97.
[17] QIU G Z, LI Q, YU R, SUN Z H, LIU Y, CHE M, YIN H, YANG Z H, YI L L, XU L, SUN L, LIU X. Column bioleaching of uranium embedded in granite porphyry by a mesophilic acidophilus consortium [J]. Bioresource Technology, 2011, 102: 4697-4702.
[18] ABHILASH, MEHTA K D, KUMAR V, PANDEY B D, TAMRAKAR P K. Column bioleaching of a low grade silicate ore of uranium [J]. Mineral Processing and Extractive Metallurgy Review, 2010, 31: 224-235.
[19] ABHILASH, PANDEY B D, SINGH A K. Comparative performance of uranium bioleaching from low grade Indian apatite rock in column and bioreactor [J]. Energy Procedia, 2013, 39: 20-32.
[20] ZARE TAVAKOLI H, ABDOLLAHY M, AHMADI S J, KHODADADI DARBAN A. The effect of particle size, irrigation rate and aeration rate on column bioleaching of uranium ore [J]. Russian Journal of Non-Ferrous Metals, 2017, 58(3): 188-199.
[21] KARAMANEV D G, NIKOLOV L N, MAMATARKOVA V. Rapid simultaneous quantitative determination of ferric and ferrous ions in drainage waters and similar solutions [J]. Minerals Engineering, 2002, 15: 341-346.
[22] MONTGOMERY D C. Design and analysis of experiments [M]. New York: John Wiley and Sons, 2008.
[23] ARSHADI M, MOUSAVI S M. Multi-objective optimization of heavy metals bioleaching from discarded mobile phone PCBs: Simultaneous Cu and Ni recovery using Acidithiobacillus ferrooxidans [J]. Separation and Purification Technology, 2015, 147: 210-219.
[24] BOUFFARD S C. Understanding the heap biooxidation of sulfidic refractory gold ores [D]. Vancouver: University of British Columbia, 2003.
[25] FINKELESTEIN N P, NEEDED C R S, NICOL M J. An electrochemical model for the leaching of uranium dioxide [C]// National Institute for Metallurgy. Johannesburg (South Africa): IAEA, 1972.
[26] BURKIN A R. Chemical hydrometallurgy: Theory and principles [M]. London: Imperial College Press, 2001.
[27] ZARE TAVAKOLI H, ABDOLLAHY M, AHMADI S J, KHODADADI DARBAN A. Kinetics of uranium bioleaching in stirred and column reactors [J]. Minerals Engineering, 2017, 111: 36-46.
[28] DIXON D G, HENDRIX J L. A mathematical model for heap leaching of one ore more solid reactants from porous ore pellets [J]. Metallurgical and Materials Transactions B, 1993, 24(6): 1087-1102.
[29] DEVECI H, JORDAN M A, POWELL N, ALP I. Effect of salinity and acidity on biooxidation activity of mesophilic and extremely thermophilic bacteria [J]. Transactions of Nonferrous Metals Society of China, 2008, 18(3): 714-721.
[30] CABRAL T, IGNATIADIS I. Mechanistic study of the pyrite-solution interface during the oxidative bacterial dissolution of pyrite (FeS2) by using electrochemical techniques [J]. International Journal of Mineral Processing, 2001, 62: 41-64.
[31] ABHILASH, PANDEY B D. Microbially assisted leaching of uranium��A review [J]. Mineral Processing and Extractive Metallurgy Review, 2013, 34: 81-113.
[32] BHATTI T M, VUORINEN A, LEHTINEN, M, TUOVINEN O H. Dissolution of uraninite in acid solutions [J]. Journal of Chemical Technology and Biotechnology, 1998, 73(3): 259-263.
[33] SCHEFFEL R E. The rewards of patience [C]//Proceedings of SME Annual Convention. Missouri: SEM, 2006.
[34] SAND W, GERKE T, HALLMANN R, SCHIPPERS A. Sulfur chemistry, biofilm, and the (in) direct attack mechanism-a critical evaluation of bacterial leaching [J]. Applied Microbiology and Biotechnology, 1995, 43(6): 961-966.
[35] BOON M. Theoretical and experimental methods in the modelling of biooxidation kinetics of sulphide minerals [D]. Delft: Netherlands Technical University, 1996.
[36] SCHIPPERS A, SAND W. Bacterial leaching of metal sulfides proceeds by two direct mechanisms via thiosulfate or via polysulfides and sulfur [J]. Applied and Environmental Microbiology, 1999, 65(1): 319-321.
[37] IVARSON K C. Enhancement of uranous-ion oxidation by Thiobacillus ferrooxidans [J]. Current Microbiology, 1980, 3: 253-254.
[38] BOON M, HEIJNEN J J. Mechanisms and rate-limiting steps in bioleaching of sphalerite, chalcopyrite and pyrite with Thiobacillus ferrooxidans [C]//Biohydrometallurgical Technologies. Warrendale, PA: The Minerals, Metals and Materials Society, 1993: 217-236.
���ù����Ż��Ͷ���ѧģ������˿����������Ļ�����
H. ZARE TAVAKOLI1, M. ABDOLLAHY1, S. J. AHMADI2, A. KHODADADI DARBAN1
1. Mining Engineering Department, Tarbiat Modares University, Tehran 14115116, Iran;
2. Nuclear Science and Technology Research Institute, Tehran 113658486, Iran
ժ Ҫ��������������������˾���������������������ʣ�����Plackett-Burman������Ʒ��о������ض��˿��������������Ե�Ӱ�졣ѡȡ[Fe2+]intial��pHֵ��ͨ�����ʺͽ�����4�������Բ��������Ż����飬����һ�����ĸ�����Ʒ��о���Щ�������˿����������Ӱ�졣�˿�������������ʱ((90.27��0.98)%)��Ӧ���Ż��������£�[Fe2+]intial=2.89 g/L��ͨ������420 mL/min��pH 1.45��������6%(�������)��[Fe2+]intial���˿����������Ӱ�������Ԥ��ģ�͵õ��˵���������Ϊ92.01%����������ʵ�����ý���ǺϽϺá���ѽ����������˿�������ķ��������������������γ��˻Ƽ���������ѽ����������˵�������������ߣ��Ƽ��������������١�����ѧģ��Ԥ�����������˵Ļ�������Fe2+Ũ��������ء�
�ؼ��ʣ������������˿�ɸѡ���Ż�������ѧģ�ͣ���������������˾�
(Edited by Wei-ping CHEN)
Corresponding author: M. ABDOLLAHY; E-mail: Minmabd@modares.ac.ir
DOI: 10.1016/S1003-6326(17)60298-X
Abstract: This research aimed to enhance the column bioleaching recovery of uranium ore by Acidithiobacillus ferrooxidans. Seven factors were examined for their significance on bioleaching using a Plackett-Burman factorial design. Four significant variables ([Fe2+]initial, pH, aeration rate and inoculation percent) were selected for the optimization studies. The effect of these variables on uranium bioleaching was studied using a central composite design (CCD). The optimal values of the variables for the maximum uranium bioleaching recovery (90.27��0.98)% were as follows: [Fe2+]initial=2.89 g/L, aeration rate 420 mL/min, pH 1.45 and inoculation 6% (v/v). [Fe2+]initial was found to be the most effective parameter. The maximum uranium recovery from the predicted models was 92.01%. This value was in agreement with the actual experimental value. The analysis of bioleaching residue of uranium ore under optimum conditions confirmed the formation of K-jarosite on the surface of minerals. By using optimal conditions, uranium bioleaching recovery is increased at column and jarosite precipitation is minimized. The kinetic model showed that uranium recovery has a direct relation with ferric ion concentration.
