

J. Cent. South Univ. (2020) 27: 2696-2710
DOI: https://doi.org/10.1007/s11771-020-4492-x

A dynamic size-based time series feature and application in identification of zinc flotation working conditions
FAN Ying(��Ӱ), GUO Yu-qian(�����), TANG Zhao-hui(�Ƴ���),LUO Jin(��), ZHANG Guo-yong(�Ź���)
School of Automation, Central South University, Changsha 410083, China
 Central South University Press and Springer-Verlag GmbH Germany, part of Springer Nature 2020
Abstract:
Conventional feature description methods have large errors in froth features due to the fact that the image during the zinc flotation process of froth flotation is dynamic, and the existing image features rarely have time series information. Based on the conventional froth size distribution characteristics, this paper proposes a size trend core feature (STCF) considering the froth size distribution, i.e., a feature centered on the time series of the froth size distribution. The core features of the trend are extracted, the inter-frame change factor and the inter-frame stability factor are given and two calculation methods of the feature factors are proposed. Meanwhile, the STCF feature algorithm was established based on the core features by adding the inter-frame change factor and the inter-frame stability factor. Finally, a flotation condition recognition model based on BP neural network was established. The experiments show that the recognition model has achieved excellent results, proving that the method proposed effectively overcomes the limitation of the lack of dynamic information in the existing traditional size distribution features and the introduction of the two factors can improve the classification accuracy to varying degrees.
Key words:
froth flotation process; froth size distribution; working condition identification��
Cite this article as:
FAN Ying, GUO Yu-qian, TANG Zhao-hui, LUO Jin, ZHANG Guo-yong. A dynamic size-based time series feature and application in identification of zinc flotation working conditions [J]. Journal of Central South University, 2020, 27(9): 2696-2710.
DOI:https://dx.doi.org/https://doi.org/10.1007/s11771-020-4492-x1 Introduction
Froth flotation is a mineral separation method widely used in mineral production and processing. The flotation process is an industrial process with complex, nonlinear and multivariable characteristics. The quality of the flotation conditions directly affects the level of concentrate grade. Proper identification of working conditions is the basis and key for operators to achieve optimal operation. Accurate working condition identification is of great significance to promote intelligent manufacturing in the metallurgical industry and can reduce labor intensity. The froth is a comprehensive reflection of the flotation working conditions [1]. The state of the bubble layer provides centralized information on the state of production. The size distribution of the bubbles in the bubble layer and the strength or fragility of the bubble can be visualized as a reflection of the current working state [2-4].
In the past, industrial production has relied heavily on the subjective experience of workers to judge flotation with subjective uncertainty and randomness, through the visual characteristics of the surface of the flotation layer detected by the naked eye [5, 6]. In recent years, with the development of machine vision and image processing techniques, as well as the study and analysis of flotation froth images, a number of studies have indicated that automatic identification of working conditions is possible [7-9]. However, the various visual features of the froth image, and the size distribution feature of froth layer surface are important features in machine vision processing. To characterize the size distribution of the froth, histogram estimation methods are commonly used, but froth images with characters of a single peak and left skew are less considered [10].
Traditionally, machine vision-based industrial recognition models are mostly based on single judgment of static images [11]. However, flotation is a dynamic process actually. Information on dynamic changes in the bubble layer should be considered [12]. In the field of facial expression recognition, texture dynamic features have been applied to the recognition of expressions [13]. In the field of froth flotation, the motion information of the bubble is closely related to the stability of the froth surface [14], but accurately capturing the bubble variation in each frame is very difficult because different bubbles move in different ways. It is not easy to align each bubble through the froth image, for the variation of the convex shape of the bubble can affect the accuracy of the identification.
To our knowledge, dynamic as well as temporal information has not been well integrated into characterization currently in zinc flotation industry background. To address these issues, we propose a time series feature in this paper, based on size nonparametric estimation with temporal and dynamic information. The froth flotation process of zinc flow in lead-zinc flotation is taken as the research object. After pre-processing the froth image, log-norm distribution function is used to fit the froth size distribution. To describe the dynamics changes of froth, inter-frame change factor (ICF) and inter-frame stability factor(ISF) are introduced into this issue, and the size trend core feature (STCF) of the bubble image is extracted to form a sequential image feature of the bubble. STCF is a time series feature with dynamic and time series information, so STCF is extracted from the time series image. Then the sequence image features under different working conditions are extracted as collection of samples. And the collection of samples is divided into a test set and a training set, and a multi-layer feedforward neural network based on the principle of reverse error propagation is established, through a sample weighting strategy between classes. Finally, an effective working condition identification model was established.
The paper is organized as follows. In Section 2, the related process and industrial background are provided and our method is proposed. In Section 3, recognition model of zinc flotation conditions is established. In Section 4, the experiments are performed in lead-zinc flotation datasets and also discussions are presented.
2 Froth feature extraction
2.1 Lead-zinc flotation process description
In the mineral separation process of lead-zinc ore, froth flotation is an important process for separating mineral particles. The main products produced during the whole flotation process are lead, zinc and mixed metals. Figure 1 shows a schematic of a lead-zinc flotation process plant located in Southeast China. As shown in Figure 1, the first row is the lead circuit, the second row is the mixed metals circuit and the bottom two rows are the zinc circuits studied in this paper. Zinc fast roughing is an important part of the zinc circuit. The upper froth layer of zinc fast roughing bank flows to zinc fast cleaning bank, which is closely related to the quality of the final concentrate product. The button flow of zinc fast roughing enters roughing bank and scavenger bank, and generates tailings at the same time, which affects the index of recovery rate.
In the actual froth flotation industry, the mineral is separated by the movement of the scraper, which drives the flow of the froth layer. The performance of the flotation has long-term relied on workers. Workers take turns to identify the working conditions and adjust the operation by observing the condition of the froth layer. In order to analyze the content of each metal in the froth layer while the technician is on duty. The approximate range of grades is occasionally analyzed by manual sampling, although this method is not as accurate as grade value output from the fluorescence analyzer, but it has long been used in the plant.
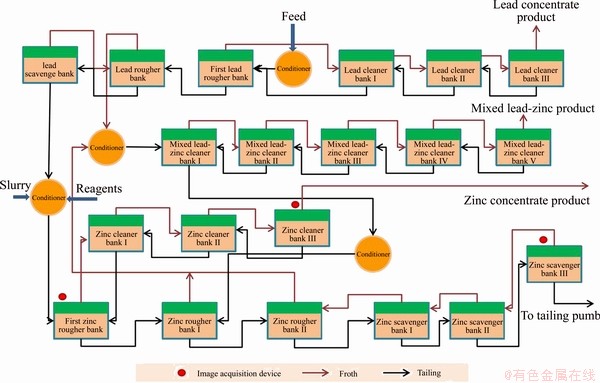
Figure 1 Lead-zinc flotation process
2.2 Froth image segmentation
The bubble video is captured from the image acquisition system of the flotation including several industry video capturing devices. A series of image data is obtained from the video. At the same time, the image data are preprocessed and all empty data and error data that exceed the range of change are removed [15]. The bubble size feature is a characterization of the bubble size distribution on the froth layer and the froth image is segmented to obtain the bubble size distribution.
The commonly used image segmentation methods are mainly as follows: valley edge detection, watershed transformation and so on [16]. Many studies show that the watershed algorithm can effectively extract the edge features in the froth flotation image processing [17]. The watershed algorithm is chosen to segment the image. Firstly, the selected image is converted from the RGB color space to the gray color space. Afterwards the image is filtered in horizontally and vertically.
Then, optimal labeling algorithm is used in the extraction of highlight spot of the froth. The three marked regions are superimposed by data fusion method to obtain the optimal marker. The optimal marker method was detailed in Ref. [18]. As shown in Figure 2, there are three marked regions; the first marked region is shown in red; green and blue represent the second and third marked regions, respectively; and the final optimal marked region is obtained by superimposing the three regions.
Finally, the segmentation ridges are obtained by watershed transformation. The marked highlights of image pixels are selected as seed points for segmentation and the segmentation ridges are obtained by watershed transformation. Figure 3 shows the segmentation result.
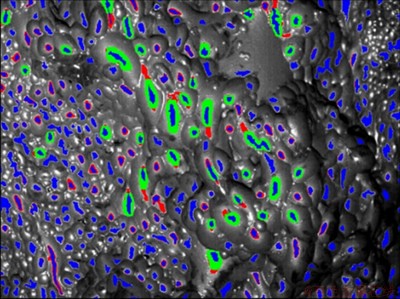
Figure 2 Froth image with three marker regions
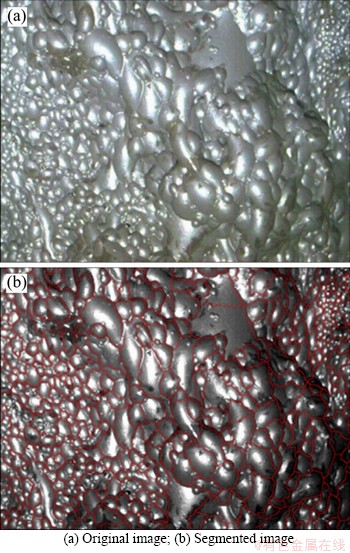
Figure 3 Comparison of classification results:
2.3 Log-norm estimation of bubble size
If lnx~(��, ��2), then x is subjected to the log-norm distribution and the probability density function of the lognormal distribution as shown in Figure 4 and Eq. (1):
 (1)
(1)
where �� and �� are the mean and standard deviation of the logarithm of the variable, respectively, and the expected value can be written as:
Var(x)=(e��2-1)e2��+��2 (2)
 (3)
(3)
The values of �� and �� can be obtained:
 (4)
(4)
 (5)
(5)
The selected image is segmented by a watershed transform; a histogram of the bubble size distribution is statistically obtained and the bubble size distribution is fitted by a log-norm function.
A histogram of the bubble size distribution (y) fitted by a lognormal distribution can be seen in Figure 4.
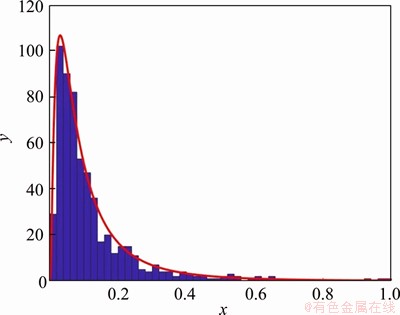
Figure 4 Lognormal distribution fitting histogram
The log-norm function can be characterized by the parameters �� and ��2 [19], and then we characterize the bubble size distribution by parameters �� and ��2 at a certain time.
2.4 Extracting dynamic size features in time series of image
Workers can judge the working conditions based on the visual characteristics of the froth by briefly observing the froth layer on the surface of the flotation bank. In the field of flotation, computer vision state recognizes the visual characteristics of a single image when the froth layer itself is flowing and the amount of image information in a single frame is insufficient to support accurate recognition of subsequent conditions. For instance, occasional and local errors can lead to incorrect judgments.
The time series information generated by the data due to time changes can be characterized by time series. The introduction of time series features can effectively make up for the loss of time series data in the feature extraction process. There are many traditional methods for processing time series features, of which the two representative methods are partition-based approximate aggregation (PAA) [20] and piecewise linear representation PLR [21].
The general traditional partition-based approximate aggregation is described as follows: the time series is segmented first and the average value of the time series in each section is calculated. This value is used to approximately replace the value in the original time series section and the original time series is approximated by the time series composed of the average values in each sub-segment.
The general piecewise linear representation (PLR) is described like this: originally, the PLR representation algorithm was introduced into the field of time series data mining by KEOGH et al [21]. The main idea of the PLR method is: the original time series is directly replaced by straight line segments that are connected end to end, and the connection method with the smallest fitting error is directly used to extract the linear structure characteristics of the sequence in order to find the change pattern of the time series.
Both PAA and PLR algorithms assume that there is only one value in the data at a certain moment. In the characteristic analysis of the time series trend change at different moments, only the change of a single value at different moments is taken into account and the joint changes between the data with interconnectedness have hardly been noticed. However, the actual situation is that the image contains a wealth of information such as pixels, colors, and textures. Even if we only focus on the information about the size distribution of the bubble, the time series characteristics of a single dimension seem to be a bit weak. Therefore, how to reduce the feature dimension of the image while retaining key information so that the image features between the same working conditions have the greatest similarity and the image features extracted between different working conditions have the greatest possible difference is an urgent problem. Most of the traditional time series processing methods analyze the time series in a single dimension, but our graphic features are rich in information and there are problems of correlation between the two variables. Therefore, the traditional method is not applicable to the problem that we are dealing with. In this paper, we propose an innovative method for extracting dynamic size features based on time series data.
We propose a time series bubble size feature extraction method based on the size trend core feature (STCF), which is a feature extraction method. The main ideas are as follows.
2.4.1 Extraction of core sequences (CF)
The purposed core feature is to provide a complete record of the dynamic changes in a region from the time when it appears in the data collection field to the time when it slides out of the field.
Specifically, the core features can be seen as a complete record of tracking the target block. Thus, the time series that make up the core feature has sequences with the same block data in all images in the time series.
Definition of time series:  is a finite set of n data records, where D(ti) is the record value at time ti and i is the time of data recording, and t1<>2<>3<��<>n.
Each data record contains the recording time and M different kinds of attribute values.
 (6)
(6)
It can be seen that the attribute value changes dynamically with time, and the label ti is expressed with a suitable granularity (such as second). The time series studied in this article is a time series with only two attributes, M=2, and the time series can be expressed as:
 (7)
(7)
Definition of time subsequence: time subsequence is a collection of subsets of time series. According to different selection rules, time subsequences have different lengths and data components.
The sliding window method in this paper will be selected to reasonably select a subsequence of the time series. Given a window length h,  first place the window at the beginning of the time series, intercept and store the time subsequence in a vector format, next slide the window to the left to capture the next time subsequence and store the subsequence and repeat the sliding operation, and so on. As shown in Figure 5, each frame of the image in the time series is represented as a two-dimensional image feature using a non-parametric estimation method based on log-norm estimation.
The time subsequence can be expressed as d:
 j=1, 2, 3, ��, n-h (8)
where j is the start of the subsequence, and l is the end. These time sub-sequences will be used as the core feature vector.
For window length, this method is used to determine the window length.
In the actual industrial site, the camera is fixed on top of the flotation tank, while the froth layer is flowing, as seen in Figure 6, where the target block appears briefly in the camera��s field of view and disappears into view after a few frames.
In order to fully document the course of the froth region over time, the 192 pixel��144 pixel region selected in the top left corner of the starting image was tracked until the region disappeared from view.
The tracked region is set to A={aij}, and is divided into 8��4 sub-regions, each containing 24��36 pixel points. If the time series starting image pixel set is ��1, the core feature sequence is composed of n frames that satisfy the following equation:
 (9)
(9)
With the addition of new time frames, when
 (10)
(10)
 (11)
(11)
the window length is set to n. Eventually, correspondingly transforming the time series into the core feature vector, our core vector is thus available.
2.4.2 Building STCF by adding inter-frame features
The froth distribution on the surface of the froth layer is uniform and the bubble size is fine when the grade is high; meanwhile, the bubble concentration is dense. And in the time zone observed by the naked eye, the froth image changes and the size distribution of the froth are almost consistent in a short time. The probability of individual bubble mergers and fragmentation is relatively small. In consideration of this situation, the core sequence is a general overview of the changes in the froth layer within a region in order to better distinguish the characteristics of the bubble image between the same working conditions.
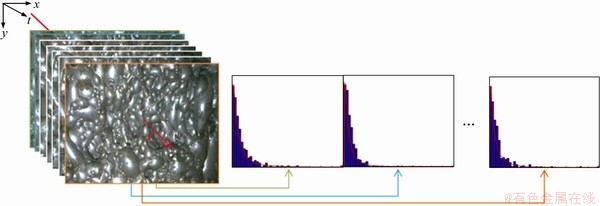
Figure 5 Schematic diagram of dynamic size feature extraction in a time series
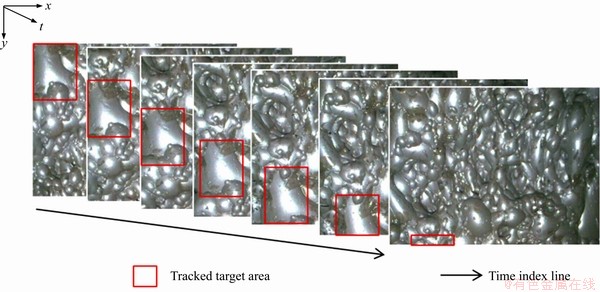
Figure 6 Tracking target movement diagram
Furthermore, we specially propose the concept of the rate of change between frames and the stability of the change between frames, and construct an STCF method based on the two characteristics.
2.4.2.1 Inter-frame change factor (ICF)
The inter-frame change rate measures the magnitude of the feature change between different frames. There is a change in the size of the froth between different frames. The froth layer flows faster and the froth size is unevenly distributed when there are few minerals attached to the froth and the grade is low; the frequency of breaking and merging is relatively high at the same time. All of these conditions will be reflected in the large changes in the froth frame.
In summary, inter-frame change rate is very significant and the inter-frame change factor is proposed as follows.
Definition of distance: the distance of feature attribute values between two frames is measured by Euclidean distance.
 (12)
(12)
 (13)
(13)
where  is the inter-frame change rate; s and j are the corresponding sample times; N is the number of samples.
2.4.2.2 Inter-frame stability factor (ISF)
The lower the grade is, the more likely the froth layer is to be unstable. The internal froth may collapse violently in some low-concentrate grade cases. The froth around the collapsed gap rapidly expands and joins, and finally reunites. During this process, the measurement of froth stability is available due to the fact that the size distribution of the surface froth is reconstructed in a short time. The values of the size characteristics of the froth image between frames may change abruptly. We define the inter-frame froth image change as a magnitude based on the above facts, which is the inter-frame stability factor.
Definition of inter-frame maximum:
 (14)
(14)
The inter-frame stability factor can be written as:
 (15)
(15)
where p is the maximum of function dis(s, j); is the inter-frame change rate; G is the inter-frame stability factor. On one hand, the inter-frame stability can reflect the situation of the froth grade. The greater the inter-frame stability value, the greater the probability that the froth layer has a lower grade; and the smaller the inter-frame froth stability value, the greater the probability that the froth layer has a higher grade. On the other hand, it is considered that the interference caused by noise in actual situations may be attributed to the drastic changes in the characteristic values, but practical experience tells us that this interference noise is not conducive to the credibility of the data. In this case, the inter-frame stability can detect the occurrence of such interference. For instance, the inter-frame stability indicates that the froth state is reliable and the recognition result is credible.
The characterization steps for STCF are expressed as: extraction of the STCF features at a certain point in the image sequence is first based on the above-mentioned core feature extraction method, which extracts the core sequence set to form the core features:
 (16)
(16)
where n is the length of the time window, and the image ��i of each frame is represented by the corresponding �� and �� values obtained by the non-parametric estimation method described above.
Connect the elements of the set one by one into line vectors to get the core sequence features.
Then, the inter-frame change factorand the inter-frame stability factor G are calculated.
Finally, the core sequence features were combined with the inter-frame change factor to obtain the STCF features: 

So, a kind of size distribution algorithm for time series is proposed based on the core features of size distribution. The whole process is shown in Figure 7. First, the video capture device collects video data and extracts a continuous time series image set from the video, then, obtains a logarithmic norm estimate by processing the images of each frame in the image set, and the froth size distribution is well characterized by the parameters of the lognormal function. Then, STCF features are extracted by the method proposed. Finally, features and their corresponding label values are paired and recorded as a data set.
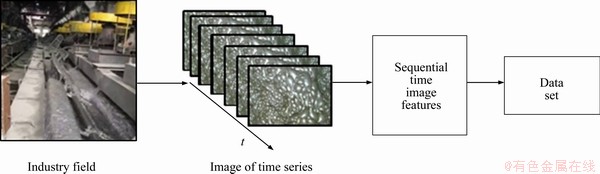
Figure 7 Schematic diagram of feature set data extraction
3 Flotation condition recognition
The zinc flotation process in the froth flotation process is considered the research object. According to the range of the concentrate grade, as for those parts of the data state transformation where the boundaries are difficult to delineate, technical experts were invited to delineate them with manual experience. The working conditions will be classified into four cases: excellent, medium, qualified, and abnormal, as shown in Figure 8.
The froth images under different working conditions are shown as follows:
1) Class 1 (Optimal froth working condition): the reagent is properly added, the froth size is evenly distributed, and small individual size and dense overall distribution of froth and the froth layer are in a stable state.
2) Class 2 (Moderate condition): there is uniform froth size distribution, with slightly inadequate flotation agent additions.
3) Class 3 (Qualified condition): bubbles are relatively large but the size of froth is not uniformly distributed, the froth layer is in a state of poor stability, frequent froth crushing.
4) Class 4 (Overload condition): the mineral loading rate of the froth is too high, or the froth is insufficient due to the insufficient addition of the agent. As a result, the froth cannot carry too much minerals and eventually collapses. At this time, the image characteristic is that there are few highlights on the froth surface, and the image is darker compared to other working conditions.
Neural networks have a good effect in terms of nonlinear representation capabilities. Studies have shown that a knowledgeable three-layer neural network can arbitrarily approximate non-linear functions. Therefore, it is appropriate to use neural network models for this multi-classification problem. Multiple output nodes are used to represent different operating conditions with different output vectors. In order to compare the effectiveness of neural networks, the LS-SVM algorithm was used in the experiment section.
3.1 BP neural network model
A neural network is an interconnected network of adaptive simple unit that simulates the interaction of biological nervous systems with real-world objects [22]. BP neural network is a multi-layer forward feedback neural network using a back-propagation algorithm.
Figure 9 shows the structure of back propagation neural network, in which the forward propagation of information means the forward propagation of the signal from the input layer through the hidden layer to the output layer, and the error is the backward propagation. The error goes from the output layer to the hidden layer and then to the input layer. Meanwhile the weights and offsets between the layers are adjusted in order to learn the input samples, and BP-NN is often used to solve classification problems [23].
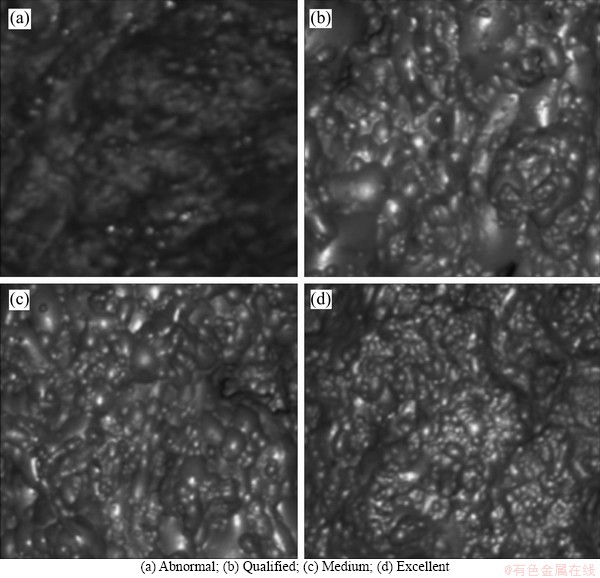
Figure 8 Froth images under four different working conditions:
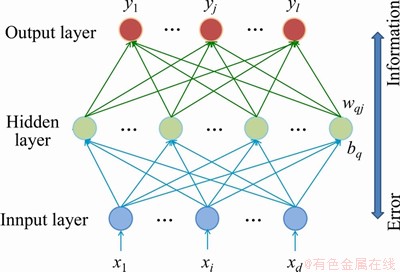
Figure 9 Structure of back propagation neural network
3.2 Modeling by neural networks
In practical modeling, a multilayer feed forward neural network with a three-layer structure is selected for model training.
Step 1: Initialization. Determine the numbers of network input layer nodes, hidden layer nodes, and output layer nodes according to the system input and output dimensions.
The number of input nodes corresponds to the dimension of the STCF feature and the number of output nodes corresponds to the type of working conditions. As mentioned above, we divide the working conditions into 4 categories, so there are four output nodes here. For the core feature extraction, the length of the sliding window is selected as 7 and each sliding distance is 2; the numbers of hidden layer and the output layer are 17 and 25, respectively.
Then, initialize the connection weights between the input layer, hidden layer and output layer neurons; initialize the hidden layer threshold, and the output layer threshold, giving learning rate and the neuron excitation function. The function selected is:
 (17)
(17)
Step 2: Calculate the output of the output layer and hidden layer. The hidden layer output value is calculated based on the input variables, the connection weights between the input and hidden layers, and the hidden layer threshold value. The output value predicted by the BP neural network should be calculated based on the hidden layer output, connection weight and threshold.
Step 3: Error calculation. Calculate the network forecast error based on the network forecast output and the expected output:
 (18)
(18)
The network predicted output here is O and the expected output is Y.
Step 4: Update network node thresholds and weights based on network prediction errors.
Step 5: Determine if the algorithm iteration is over, and if it is not, return to Step 2.
For the data processing part, according to the level of the concentrate grade the working conditions are divided into four cases: excellent, medium, qualified, and abnormal. Then, sample images of different working conditions are extracted and loaded corresponding to the working conditions. Then, sample images of different working conditions are extracted and corresponding working conditions are loaded. The samples and working conditions are considered that category labels are paired together to form a dataset. In addition, we will also normalize the input samples.
Furthermore, a sample weighting strategy is used to resolve the imbalance between the numbers of samples in different types of working conditions when the number of samples in different working conditions is unbalanced.
The schematic diagram of the method for identifying zinc flotation conditions based on STCF features is shown in the Figure 10, the feature extraction method and classification algorithm are combined to realize accurate working condition recognition.
4 Experiments and discussion
4.1 Time series compared with image features
The core feature proposed is an image feature with timing information which expresses not only the image information at the current moment, but also timing information. Core feature is conducive to comprehensively describe the dynamic flotation process. The core feature is compared with the conventional static froth distribution size feature and the accuracy of the recognition under different conditions is calculated under the same conditions. Many flotation images collected under different flotation conditions were used to validate the proposed algorithm in order to verify the superiority of the time series feature algorithm of the core feature.
The zinc flotation plant in our experiment is in Guangdong province, China, as seen in Figure 11. There is a video data capturing system and the resolution of captured image is 692 pixel��518 pixel. An XRF analyzer [24] records a grade value every 20 min. Data were collected from 25 August to 4 September, 2019, from 08:00 to 16:00. Continuous and realistic data sets were collected.
The main data collected are froth image data and concentrate grade data at the corresponding time and the data are labeled combining froth image characteristics with technical experience and concentrate grade values. 396 pairs of data were collected. Each pair of data can fully characterize the timing characteristics of the froth image and the corresponding grade value information.
In this experiment, 299 pairs of samples as a training set were randomly selected to develop the model, and 99 pairs of samples were used as a test set to validate and evaluate the effectiveness of the neural network model. Testing under the same conditions, two models BP-neural network and LS-SVM were used to compare. LS-SVM is also often used to solve pattern recognition problems [25].
The experimental results are as follows. Figures 12 and 13 show the comparison between the predicted output of the model and the actual output of the model with different classification algorithm.
In this experiment, by using STCF feature the neural network accuracy is 87.5% and the LS-SVM accuracy is 80.21%. The experiment shows that the classification effect for BP-neural network is better than LS-SVM. Therefore, in the identification of the model and the subsequent model testing, we will use the BP-neural network model.
To verify the effectiveness of the core features based on time-series image extraction, the traditional static image features in the two- dimensional plane are compared with the three- dimensional core features, and the classification effect under different features was tested using the BP-neural network.
The traditional class features used for comparison are images of a single moment. First, after completing the image segmentation, the individual bubble size is counted and the individual bubble size value domain is divided into 40 equal intervals; a statistical histogram is created with the number of bubbles in the value domain as the height; and finally, the static size information of the image is recorded by a vector of 40 values in a row.
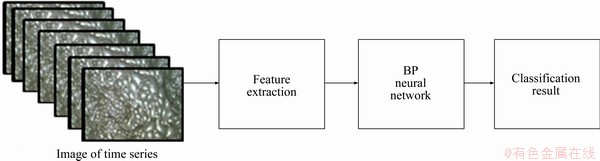
Figure 10 Schematic diagram of identification of zinc flotation conditions based on STCF features
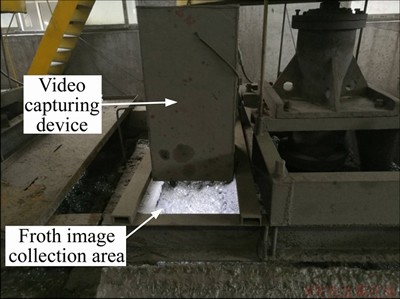
Figure 11 Video capturing device in fast-zinc rough flotation

Figure 12 Predicted working condition by LS-SVM
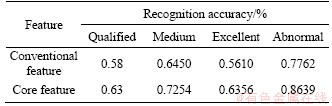
In order to ensure objectivity and reduce randomness, the accuracy value of working condition recognition is to take 10 consecutive classification results, and calculate their average value as the last classification accuracy value, as listed in Table1.
Compared with the traditional size features, the core features with time series information show a better effect on the accuracy of feature classification. Although the dimensionality of the core features used here is much lower at only 14. The classification accuracy of each working condition category has been improved to varying degrees. Four categories increased by 8.60%, 12.47%, 13.30% and 11.30%, respectively.
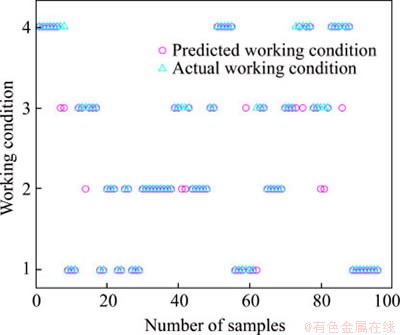
Figure 13 Predicted working condition by neural network
Table1 Recognition accuracy of different method
4.2 Comparison improvement of algorithm based on two proposed factors
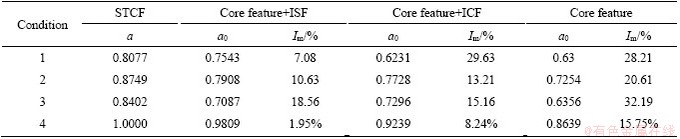
In order to objectively demonstrate the performance improvement of size trend core feature STCF algorithm by ICF and ISF, compare the accuracy of STCF algorithm with single core feature, core feature with ICF, core feature with ISF feature classification under the same classifier.
Training and test sets including 396 samples of all four working conditions are prepared for comparative experiment of working condition identification. The proposed time series features are compared with other features to analyze the sensitivity to feature enhancement. Experiments are conducted by random selection of samples as test sets and training sets in each condition category.
The specific experimental results are shown in Table 2. To quantitatively evaluate the working condition recognized results, the recognition accuracy improvement is calculated as:
 (19)
(19)
where a is the recognition results of STCF; a0 is the recognition results of the compared methods; Im is the recognition accuracy improvement, as shown in Table 2.
In the case of the second working condition, the core feature with ISF is slightly better than the core feature with ICF. The performance is reversed in the third working condition. It may be that in the second working condition, the addition of the stability factor between frames makes the feature more distinguishable.
The magnitude of the increase in different working conditions is different, which may be caused by the inconsistent sensitivity of ISF and ICF under different working conditions.
Although the sensitivity of the two factors is different under different working conditions, in general, the addition of ICF and ISF has a certain accuracy for core feature.
In STCF, the recognition of various types of working conditions has achieved a considerable improvement in accuracy, especially in the identification of the second and fourth types of working conditions, showing almost perfect performance. There are two possible potential explanations for why STCF features perform so well. One is that compared with the traditional static bubble size distribution image features,the proposed features complete the dynamic information generated by time series changes. The second is that the speed of change between froth images is closely related to the grade value. The introduction of ICF factors can properly describe this type of change, so it can accurately characterize the visual characteristics of the froth layer. Then there is the drastic change of the characteristic value of the ISF factor response, which plays an effective role in the detection of numerical mutations; at the same time, it can exclude abnormal effects and weaken the noise. This may also be the reason why the introduction of the ISF factor improves the accuracy of STCF feature description.
Very few studies have systematically explained the temporal changes in the appearance of the froth, beyond the static appearance of the froth. Most of available studies have been carried out on static froth image.
However, the finding of FU et al [12] partly consists with our study. It showed that both dynamic feature extraction algorithm and its static equivalent performed well in classification accuracy, and dynamic feature performed slightly better than its static equivalent. It was also reported in our study that three-dimensional time series features containing dynamic and time series information did not behave much better than two-dimensional static equivalent features (a froth-size feature was also applied to the same image). Why it differs from them is that we use dynamic features based on size distribution, which uses dynamic features based on texture, all of which contain dynamic change information, reflecting the flow and change information of the froth layer. In addition, their textural features are high dimensional and therefore must use a reduced dimensional approach, whereas a parsimonious image feature is used in all the experiments of this work. The last difference is that we further propose two factors based on a measure of froth stability and rate of change of froths in the zinc flotation process, which are added to the core feature and applied to subjects that we studied, resulting in a significant improvement in the identification effect.
Table 2 Several comparative experiments
We verified through repeated experiments that the addition of ISF and ICF has a positive effect on the improvement of classification performance. The STCF feature can accurately describe the working condition information, and in the neural network model, the STCF feature has been fully expressed and has achieved excellent classification results in classification accuracy.
It may also be due to the excellent nonlinear fitting ability and good learning ability of the neural network. In the view of the evaluation of the classification model by the experimental results, some categories have achieved near-perfect accuracy, which shows that we can safely conclude that neural networks can effectively establish the correspondence between STCF features and different types of working condition.
5 Conclusions
1) In this study, one kind of feature extraction method for time-series images is investigated. In addition to considering the surface appearance the surface appearance of the froth, the changes in the size distribution of the froth image due to temporal changes are further investigated.
2) Time series changes in the bubble layer image and dynamic information should be taken into account, as flotation is a dynamic process. Based on the characterization of dynamic changes in the variables of the zinc flotation process, an image-based time-series feature was proposed, encapsulating both dynamic and time-series information, using a dimensional simplicity approach.
3) There are two major contributions from this study. Firstly, based on the study of the characteristics of zinc flotation process, the feature of the time series adapted to the zinc flotation process is proposed as the core characteristics extracted from time series image. Secondly, the inter-frame change rate factor is proposed and used to measure the dynamic behavior of froth changes between adjacent frames in a time series. An inter-frame stability factor is proposed to evaluate the reliability of the froth state in a short time.
4) The main findings are that both the inter- frame change factor and the inter-frame stability factor have improved the discriminative of core characteristics. With the addition of the two factors, classification accuracy has been improved in different working conditions to varying degrees.
5) Finally, a neural network model is used to effectively establish a working condition recognition model for froth zinc flotation, and experimental verification shows that good results have been achieved. Accurate identification of working conditions is conducive to assisting workers in operation and regent adjustment, and of great importance for stable and optimized production.
Contributors
The overarching research goals were developed by FAN Ying, TANG Zhao-hui and Guo Yu-qian. FAN Ying provided the concept and edited the initial draft of the manuscript. LUO Jin and ZHANG Guo-yong provided the measured froth image data and analyzed the data. FAN Ying and TANG Zhao-hui established relevant experimental models and performed working condition identification. Guo Yu-qian and LUO Jin analyzed the calculation results. All authors replied to reviewers�� comments and revised the final version.
Conflict of interest
FAN Ying, GUO Yu-qian, TANG Zhao-hui, LUO Jin and ZHANG Guo-yong declare that they have no conflict of interest.
References
[1] ALDRICH C, MARAIS C, SHEAN B J, CILLIERS J J. Online monitoring and control of froth flotation systems with machine vision: A review [J]. International Journal of Mineral Processing, 2010, 96(1-4): 1-13. DOI: 10.1016/ j.minpro.2010.04.005.
[2] ZHANG J, TANG Z, AI M, GUI W. Nonlinear modeling of the relationship between reagent dosage and flotation froth surface image by Hammerstein-Wiener model [J]. Minerals Engineering, 2018, 120: 19-28. DOI: 10.1016/j.mineng.2018. 01.018.
[3] ZHANG W, NESSET J E, FINCH J A. A novel approach to prevent bubble coalescence during measurement of bubble size in flotation [J]. Journal of Central South University, 2014, 21(1): 338-343. DOI: 10.1007/s11771-014-1945-0.
[4] LIU J, GUI W, TANG Z, YANG C, ZHU J, LI J. Recognition of the operational statuses of reagent addition using dynamic bubble size distribution in copper flotation process [J]. Minerals Engineering, 2013, 45: 128-141. DOI: 10.1016/ j.mineng.2013.02.003.
[5] WANG J, ZHANG J, TIAN J, ZHANG D, LIU X. The method for froth floatation condition recognition based on adaptive feature weighted [C]// Pattern Recognition & Computer Vision. 2018. DOI: 10.1080/18756891.2013. 809938.
[6] LIU J, GUI W, TANG Z, HU H, ZHU J. Machine vision based production condition classification and recognition for mineral flotation process monitoring [J]. International Journal of Computational Intelligence Systems, 2013, 6(5): 969-986. DOI: 10.1080/18756891.2013.809938.
[7] FU Y, ALDRICH C. Froth image analysis by use of transfer learning and convolutional neural networks [J]. Minerals Engineering, 2018, 115: 68-78. DOI: 10.1016/j.mineng. 2017.10.005.
[8] KAARTINEN J, HATONEN J, HYOTYNIEMI H, MIETTUNEN J. Machine-vision-based control of zinc flotation��A case study [J]. Control Engineering Practice, 2006, 14(12): 1455-1466. DOI: 10.1016/j.conengprac.2005. 12.004.
[9] WAN Xiao-xue, CHEN Xiao-fang, GUI Wei-hua, YUE Wei-chao, XIE Yong-fang. A novel shapelet transformation method for classification of multivariate time series with dynamic discriminative subsequence and application in anode current signals [J]. Journal of Central South University, 2020, 27(1): 114-131. DOI: 10.1007/s11771-020-4282-5.
[10] O'CONNOR C T, RANDALL E W, GOODALL C M. Measurement of the effects of physical and chemical variables on bubble size [J]. International Journal of Mineral Processing, 1990, 28(1, 2): 139-149. DOI: 10.1016/0301- 7516(90)90032-T.
[11] LI Jian-qi, YANG Chun-hua, ZHU Hong-qiu. Improved image enhancement method for flotation froth image based on parameter extraction [J]. Journal of Central South University of Technology, 2013, 20(6): 1602-1609. DOI: 10.1007/s11771-013-1652-2.
[12] FU Y, ALDRICH C. Flotation froth image analysis by use of a dynamic feature extraction algorithm [C]// Proceedings of the 17th IFAC Symposium on Control, Optimization and Automation in Mining, Mineral and Metal Processing (MMM 2016). Vienna, Austria, 2016, 49(20): 84-89. DOI: 10.1016/j.ifacol. 2016.10.101.
[13] ZHAO G, PIETIKAINEN M. Dynamic texture recognition using local binary patterns with an application to facial expressions [J]. IEEE Transactions on Pattern Analysis and Machine Intelligence, 2007, 29: 915-928. DOI: 10.1109/ TPAMI.2007.1110.
[14] ZHANG H, TANG Z, XIE Y, GAO X, GUI W. A similarity- based burst bubble recognition using weighted normalized cross correlation and chamfer distance [J]. IEEE Transactions on Industrial Informatics, 2019, 16(6): 4077- 4089. DOI: 10.1109/TII.2019. 2960051.
[15] YANG C, XU C, GUI W, DU J. Nonparametric density estimation of bubble size distribution for monitoring mineral flotation process [C]// IEEE Conference on Decision & Control. IEEE, 2009. DOI: 10.1109/CDC.2009.5399975.
[16] ZHOU K J, YANG C H, GUI W H, XU C H. Clustering- driven watershed adaptive segmentation of bubble image [J]. Journal of Central South University of Technology, 2010, 17(5): 1049-1057. DOI: 10.1007/s11771-010-0597-y.
[17] JIANQI L, CHUNHUA Y, BINFANG C, LI Jian-qi, YANG Chun-hua, CAO Bin-fang, ZHU Qiu-hong, LIU Jin-ping. Improved watershed segmentation method for flotation froth image based on parameter measurement [J]. Chinese Journal of Scientific Instrument, 2013, 34(6): 1233-1240. DOI: 10.19650/j.cnki.cjsi.2013. 06.005.
[18] ZHANG H, TANG Z, XIE Y, GAO X, CHEN Q. A watershed segmentation algorithm based on an optimal marker for bubble size measurement [J]. Measurement, 2019, 138: 182-193. DOI: 10.1016/j.measurement.2019.02.005.
[19] RIQUELME A, DESBIENS A, VILLAR R D, et al. Predictive control of the bubble size distribution in a two-phase pilot flotation column [J]. Minerals Engineering, 2016, 89: 71-76. DOI: 10.1016/j.mineng.2016.01.014.
[20] FALOUTSOS C. Fast time sequence indexing for arbitrary Lp norms [C]// Proc International Conference on VLDB. Cairo, Egypt. 2000: 385-394.
[21] KEOGH E, CHAKRABARTI K, PAZZANI M, MEHROTRA S. Dimensionality reduction for fast similarity search in large time series databases [J]. Knowledge and Information Systems, 2002, 3(3): 263-286. DOI: 10.1007/PL00011669.
[22] KOHONEN T. An introduction to neural computing [J]. Neural Networks, 1988, 1(1): 3-16. DOI: 10.1016/0893- 6080(88)90020-2.
[23] ZHAO G, HUANG H, LU X. Discriminating earthquakes and explosion events by seismic signals basing on BP-Adaboost classifier [C]// 2016 2nd IEEE International Conference on Computer and Communications (ICCC). IEEE, 2016. DOI: 10.1109/CompComm.2016.7925045.
[24] ZHANG J, TANG Z, XIE Y, AI M, GUI W. Convolutional memory network-based flotation performance monitoring [J]. Minerals Engineering, 2020, 151: 106332. DOI: 10.1016/ j.mineng.2020.106332.
[25] WANG Zhi-qiang. LS-SVM Recognition of fruit using in harvesting robot based on RIO-HOG feature [J]. Applied Mathematics & Information Sciences, 2017, 11(2): 489-495. DOI: 10.18576/amis/110218.
(Edited by FANG Jing-hua)
���ĵ���
һ�ֻ��ڶ�̬�ߴ��ʱ��������������п��ѡ����ʶ���е�Ӧ��
ժҪ����п��ѡ���������ڸ�ѡ�����е�ͼ���Ƕ�̬�仯�ģ����еĴ�ͳ������������ͼ�����п���ͼ���ʱ��������Ϣ�������ڴ�ͳ����ĭ�ߴ�ֲ������Ļ����ϣ�����˻�����ĭ�ߴ�ֲ�������ʱ��ά����Ϣ�ijߴ����ƺ�������(STCF)��������ĭ�ߴ�ֲ���ʱ������Ϊ����������������ȡ�����Ƶĺ�����������֡��仯ϵ����֡���ȶ�ϵ��������ĭ�㶯̬�仯��Ϊ������������������ϵ���ļ��㷽����ͬʱ���ں��������Ļ����Ͻ��֡��仯ϵ����֡���ȶ�ϵ����������STCF�����㷨���������һ�ֻ���BP������ĸ�ѡ����ʶ��ģ�͡�ʵ������������ʶ��ģ��ȡ���˺ܺõ�Ч����֤���˱�������ķ�����Ч�ؿ˷������д�ͳ�ijߴ�ֲ������ж�̬��Ϣȱ���ľ����ԡ�ͬʱ��Ҳ֤������������������ܹ���ͬ�̶ȵ���߷���ȷ�ʡ�
�ؼ��ʣ���ĭ��ѡ���̣���ĭ�ߴ�ֲ�������ʶ��
Foundation item: Project(U1701261) supported by the National Science Foundation of China, Guangdong Joint Fund of Key Projects; Project(61771492) supported by the National Natural Science Foundation of China; Project(2018GK4016) supported by Hunan Province Strategic Emerging Industry Science and Technology Research and Major Science and Technology Achievement Transformation Project, China
Received date: 2020-01-03; Accepted date: 2020-06-24
Corresponding author: TANG Zhao-hui, PhD, Professor; Tel: +86-13975894848; E-mail: zhtang@csu.edu.cn; ORCID: https://orcid.org/ 0000-0003-4132-4987
Abstract: Conventional feature description methods have large errors in froth features due to the fact that the image during the zinc flotation process of froth flotation is dynamic, and the existing image features rarely have time series information. Based on the conventional froth size distribution characteristics, this paper proposes a size trend core feature (STCF) considering the froth size distribution, i.e., a feature centered on the time series of the froth size distribution. The core features of the trend are extracted, the inter-frame change factor and the inter-frame stability factor are given and two calculation methods of the feature factors are proposed. Meanwhile, the STCF feature algorithm was established based on the core features by adding the inter-frame change factor and the inter-frame stability factor. Finally, a flotation condition recognition model based on BP neural network was established. The experiments show that the recognition model has achieved excellent results, proving that the method proposed effectively overcomes the limitation of the lack of dynamic information in the existing traditional size distribution features and the introduction of the two factors can improve the classification accuracy to varying degrees.
