
Trans. Nonferrous Met. Soc. China 31(2021) 438-455
Correspondence between low-energy twin boundary density and thermal-plastic deformation parameters in nickel-based superalloy
Guo-zheng QUAN1,2, Yu-qing ZHANG1, Pu ZHANG1, Yao-yao MA1, Wei-yong WANG3
1. College of Materials Science and Engineering, Chongqing University, Chongqing 400044, China;
2. State Key Laboratory of Materials Processing and Die & Mould Technology, Huazhong University of Science and Technology, Wuhan 430074, China;
3. School of Civil Engineering, Chongqing University, Chongqing 400045, China
Received 12 March 2020; accepted 25 September 2020
Abstract:
To deeply understand and even describe the evolutions of the low-energy twin boundary density (BLD��3n) in a thermal-plastic deformation process, an improved twin density model as a function of average grain size and stored energy is developed. For Nimonic 80A superalloy, the model is solved based on the EBSD statistical results of grain size and BLD��3n in the specimens compressed at temperatures of 1273-1423 K and strain rates of 0.001-10 s-1. The corresponding relationships of BLD��3n with stored energy and grain size varying with temperature and strain rate are clarified by the superimposed contour plot maps. It is summarized that BLD��3n increases with increasing stored energy and decreasing grain size, and higher BLD��3n with finer grains corresponds with lower temperatures and higher strain rates. Such relationships are described by the improved twin density model, and the prediction tolerance of the solved model is limited in 2.8%.
Key words:
Nimonic 80A superalloy; twin boundary; microstructure evolution; dynamic recrystallization; grain size; stored energy;
1 Introduction
Nimonic 80A, a nickel-based superalloy with low stacking fault energy (SFE), has been widely used for aircraft jet engines, gas turbines, marine diesel engines, etc., owing to its excellent combination of properties such as strong corrosion- resistance, high strength and superior creep- resistance [1-3]. A common point of view is that the Nimonic 80A products with salient comprehensive properties usually achieved by thermal-plastic deformation, are attributed to the grain refinement induced by dynamic recrystallization (DRX) to a great extent [3,4]. Generally, DRX grains nearly nucleate at the bulge of original grain boundaries, which profits from sub-grain rotation and annealing twin formation [5]. The annealing twins, separated from parent grains by long straight grain boundaries, can not only increase the amount of grain boundaries in favor of DRX grain nucleation, but also change the orientation and motivate further the slip of crystals [6]. Some ��special boundaries��, low-energy twin boundaries, ��3n (n=1, 2, 3), have relatively coherent interfaces that contain comparatively fewer vacancies and defects. The occurrence of mass transport and diffusion along the coherent interfaces also become sluggish, which can enhance the anti-fatigue and creep-resistance of alloys [7]. Thus, such high proportions of low-energy twin boundaries are desirable for alloys applied in elevated temperature environments. In the thermal- plastic deformation process of a Nimonic 80A superalloy, DRX behaviors and twin mechanism commonly coexist and synergistically interact. Both of them are associated with the gradient of the stored energy that is strongly determined by the processing parameters including strain, temperature and strain rate. Under the comprehensive action of these two mechanisms, the generated low-energy twin boundaries can sufficiently interrupt the susceptible random grain boundary networks [8]. Moreover, the interaction of ��3n twin boundaries will result in multiple-twinned structures [9,10]. It has been proven that such grain boundary structures are mainly responsible for the improved crack- resistance of alloys. As pursued by grain boundary engineering (GBE), the specific properties of FCC alloys can be improved by promoting the proportion of ��3n twin boundaries and modifying the grain boundary character distribution (GBCD) [11]. Therefore, it is significant to develop the models that precisely describe the variation of low-energy twin boundaries with thermal deformation parameters to obtain desirable grain boundary structures.
Over the past decades, several types of model, such as growth accident model [12,13], grain encounter model [14], grain boundary dissociation model [15], and stacking fault model [16], were developed to describe the formation of annealing twins. The growth accident model, explained by the formation of annealing twins caused by grain boundary migration, is widely supported by many recent reports. Based on this, GLEITER [12] proposed a complicated model with many material parameters by considering the atomistic mechanism for annealing twin formation. Following that, PANDE et al [13] reviewed the model, and derived a phenomenological equation to predict twin density evolution during grain growth, which has been widely applied in the annealing process of FCC alloys. CAHOON et al [17] modified these equations to incorporate the effect of prior plastic strain in a cold working followed by annealing in commercially pure Ni. In their work, twin density is related to stacking fault energy, grain size, grain boundary energy and the amount of prior strain. Further, DETROIS et al [7] accounted for the effect of deformation temperature, strain and strain rate on prior strain and established the relations of twin density with grain size and stored energy in Ni-base superalloy RR1000. These works paid attention to the evolution of twin density in the static processes like recrystallization and grain growth. However, very limited works have been carried out on twin density evolution in a dynamic thermal deformation, especially describing its relationships by a quantitative function of various processing and microstructural parameters such as strain, strain rate, temperature, grain size and DRX fraction. In the recent work of SHI et al [18], the terms of twin fraction (BLF) and twin density (BLD) were introduced to quantify the twin amount for Nimonic 80A, and an inversely proportional relationship between BLD and DRX grain size was constructed using hot compression tests. In their work, the stored strain energy gradient was considered as the main driving force for grain boundary migration, but the effect of grain boundary energy was ignored. In the physical fact of a dynamic thermal-plastic deformation process, a heat-treatment process and a deformation process coexist. That is to say, both stored strain energy and grain boundary energy have indelible contribution to the driving force for grain boundary migration, and directly affect grain size evolution and grain boundary characteristics. However, it is a significant and difficult issue how to characterize and quantify stored energy and twin density, especially in a complicated dynamic thermal-plastic deformation process. Thus, in this work, the relationship between stored energy and processing or microstructural parameters is uncovered, and further is used to establish a precise twin density evolution model in dynamic thermal- plastic deformation of Nimonic 80A superalloy.
In the present work, the evolutions of the low-energy twin boundary density for Nimonic 80A superalloy were studied using isothermal compression experiments to deeply understand the inherent relationships between processing parameters and microstructure characteristics. A superimposed map of grain size over stored energy was constructed to reveal the relationship between grain size and stored energy, and such relationship was further described as a quantitative function. Additionally, the corresponding relationships of BLD��3n with average stored energy and grain size varying with temperature and strain rate were clarified by two superimposed contour plot maps of stored energy over BLD��3n, and grain size over BLD��3n. Further, an improved twin density model as a composite function of stored energy and grain size was developed and solved based on EBSD statistical results. Finally, solved twin density model was characterized as a three-dimensional (3D) response surface. Moreover, the predictability of the solved model was assessed by experiments.
2 Basis of improved twin density model
In the classical theory of grain accident model, the formation of annealing twin is caused by grain boundary migration during grain growth [11,19]. The work of PANDE et al [13] was focused on the description of static evolution of twin density during a heat-treatment process. The twin density is defined as a function of grain size and grain boundary energy as
 (1)
(1)
where p is the number of twin boundary inter- sections per unit length; D0 is the critical grain size; D is average grain size; ��g is grain boundary energy; k is a constant.
During grain growth, the driving force for grain boundary migration has decisive effect on the annealing twin formation. In PANDE��s model, the driving force F is strongly determined by grain boundary energy ��g and average grain size D:
 (2)
(2)
where k1 is a constant.
By considering the difference in Gibbs energy (��G0) between growing and shrinking grains, ��G0=4��g/D [12], and substituting this into Eq. (2), the driving force F is derived as
F=k2��G0 (3)
where k2 is a constant.
Then, the form of ��G0 was modified by LI et al [20] when accounting for the residual strain in a cold deformation process:
 (4)
(4)
where A�� is a material constant; S is the amount of residual plastic strain.
The existing form for the difference in Gibbs energy only accounts for the strain resulting from cold deformation. However, in a thermal-plastic deformation process of alloys, the deformation temperature, strain and strain rate have influence on the amount of residual plastic strain. In the work of DETROIS et al [7], the form of ��G0 was further modified by accounting for the stored strain energy in thermal deformation:
 (5)
(5)
where Es is the stored energy; k3 is a constant.
There is a proportional relationship between grain boundary energy ��g and twin boundary energy ��tb as k4=��g/��tb, where k4 is a constant [7,13]. So, the formulation of driving force F can be derived when considering the effect of twin boundary energy:
 (6)
(6)
where k5 is a constant.
In the classic theory [13], twin content variation per grain (��N) is considered as a function of the variation of grain size (��D) and the driving force (F) for grain boundary migration:
��N��F��D (7)
Then, substituting Eq. (6) into Eq. (7) yields Eq. (8):
 (8)
(8)
where k6 is a proportional coefficient.
Integrating and using the boundary condition N=0 as D=D0, the content of twin boundary can be derived as
 (9)
(9)
where k7 is a constant.
Since N=pD, the twin density can be expressed as Eq. (10), a function of stored energy and grain size:
 (10)
(10)
During a deformation, the stored energy of deformed samples can be estimated from dislocation density [21]:
 (11)
(11)
where G is the shear modulus, b is the absolute value of the Burger vector, �� is the dislocation density, K denotes the arithmetic average of 1 and (1-��), with �� as the Poisson ratio.
Then, the dislocation density is related to the steady-state flow stress �� [22]:
 (12)
(12)
where c1 is a constant.
Under a steady-state thermal deformation process of alloys, the nucleation rate of DRX grains and average grain size remain constant. The average grain size shows a power-law relationship with the steady-state flow stress [23]:
 (13)
(13)
where n is the relevant exponent of grain size, ranging from 0.4 to 0.8; c2 is a constant.
Consequently, combining Eq. (11), Eq. (12) with Eq. (13), the formulation of stored energy Es can be expressed as
 (14)
(14)
where c3 and c4 are constants.
In the present work, the boundary length density (BLD) that stands for the length of ��3n twin boundaries per unit area (BLD��3n, ��m-1) was used to quantify twin boundary content. Based on the stereology concepts, the density of ��3n twin boundary (BLD��3n) and p are related to each other by a proportionality factor as BLD��3n=p��/2. Therefore, the improved twin density model can be summarized as
 (15)
(15)
3 Experimental
3.1 Materials and isothermal compression tests
The studied material in this work is an as-forged Nimonic 80A superalloy, whose chemical compositions are presented in Table 1. Twenty-three specimens of 10 mm in diameter and 12 mm in height were machined by wire-electrode cutting from the same as-forged billet, and these specimens were prepared for a series of isothermal compression tests carried out on a Gleeble-3500 thermal mechanical simulator. Twenty of them were conducted at four different temperatures of 1273, 1323, 1373 and 1423 K and five different strain rates of 0.001, 0.01, 0.1, 1 and 10 s-1 to obtain the basic computation data for solving the improved twin density model. The remaining three specimens were prepared for the verification experiments of the improved model at the temperature of 1473 K and the strain rates of 0.001, 0.01 and 0.1 s-1. Before compression, the specimens were heated to a proposed temperature with a heating rate of 5 K/s and held at that temperature for 180 s. Subsequently, the specimens were isothermally compressed to a fixed true strain of 0.916 with a proposed strain rate, followed by water quenching to ambient temperature rapidly to decrease material anisotropy and retain the elevated temperature microstructures. The experimental procedure of isothermal compression tests is schematically illustrated in Fig. 1.
Table 1 Chemical compositions of studied Nimonic 80A superalloy (wt.%)

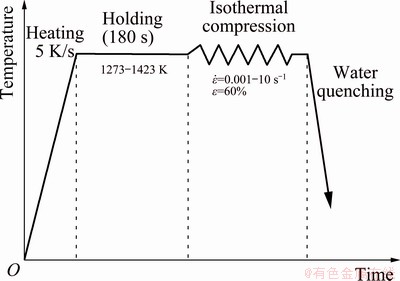
Fig. 1 Experimental procedure of isothermal compression tests
3.2 Microstructure measurement
The deformed specimens were sectioned into semi-cylinders along their longitudinal axis, and 5 mm �� 5 mm �� 3 mm samples were separated from the center of the semi-cylinders for microstructure observation, as shown in Fig. 2. Subsequently, the section surfaces were electro-polished at 20 V for 22 s in an electrolyte consisting of 10% HClO4, 10% CH3COOH and H2O. The microstructures were characterized using an electron backscattered diffraction (EBSD) detector attached to a JEOL JSM-7800F scanning electron microscope (SEM) at an accelerating voltage of 20 kV. In order to minimize the errors originated from grain boundary thickness and accounting for the limit resolution of EBSD, the scanning step size was limited in 0.2-2.5 ��m depending on the grain size. As for microstructural characterization, Channel 5 software was applied to analyzing the collected EBSD data. For Nimonic 80A superalloy, the critical angles judging sub-grain boundary and grain boundary are generally set to be 3�� and 15��, respectively [24]. The identification of ��3n twin boundaries is based on the Brandon criterion, and the maximum allowed deviation is 8.7�� [25]. The grain is defined as a region being completely bounded by HAGBs, excluding ��3n twin boundaries. The local intragranular misorientation of microstructures is characterized on the basis of the fifth nearest neighbor with a maximum misorientation angle of 5��. In order to quantify the content of ��3n twin boundaries obtained from EBSD maps, the density of ��3n twin boundary is calculated using (Np����)/A [26], where Np is the number of map-pixels that compose the ��3n twin boundaries in the EBSD maps, �� is the step size in ��m, and A is the surface area in ��m2.
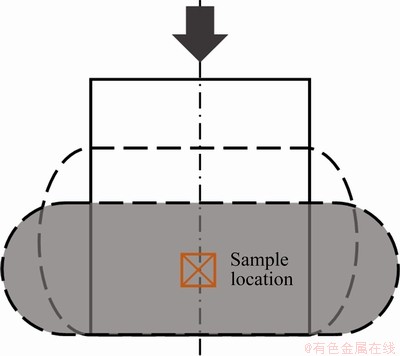
Fig. 2 Schematic representation of sample location in compressed specimen (Arrow shows applied load direction)
The initial microstructure of specimen is shown in Fig. 3. The microstructure in Fig. 3(a) is characterized as uniform equiaxed grains with an average grain size of 34.8 ��m. From the Band contrast (BC) map in Fig. 3(b), it is obvious that high angel grain boundaries (HAGBs) are severely interrupted by ��3n clusters containing inter-connected ��3, ��9 and ��27 twin boundaries in grains, and the content of ��3 twin boundaries is the largest.

Fig. 3 Initial microstructures of Nimonic 80A super- alloy without deformation
4 Characterization of twin density evolution by improved model
4.1 Evolution of grain size and its characterization
In the thermo-plastic deformation of Nimonic 80A superalloy, occurrence of DRX can result in significant grain refinement. More importantly, the DRX process is usually accompanied by the formation of ��3n twin boundaries. As thus, the influence of deformation parameters on DRX behaviors is analyzed, which significantly assists in understanding the synergistic effects between DRX behaviors and the ��3n twin boundaries density. Figure 4 shows the EBSD maps with DRX fraction and ��3n twin boundaries of the specimens deformed to a fixed true strain of 0.916 at temperatures of 1273-1423 K and strain rates of 0.001-10 s-1. A common feature of these EBSD maps is that most of them are characterized as homogeneous and almost equiaxed DRX grains, especially at high temperatures. However, in the low temperature range of 1273-1323 K and the intermediate strain rate range of 0.1-1 s-1, it is obvious that many grain boundaries still remain the original morphologies because of the low mobility of grain boundaries at lower temperatures. Meanwhile, the original elongated grains surrounded by fine DRX grains present as the ��necklace�� microstructures. It is worth noticing that the new DRX grains almost nucleate at grain boundaries firstly, especially at the bulge of original grain boundaries. This is mainly due to the fact that the dislocation slipping and pile-up at grain boundaries would induce orientation evolution, which contributes to the preferential nucleation at these boundaries [6].

Fig. 4 EBSD maps with DRX fraction and ��3n twin boundaries of Nimonic 80A superalloy deformed at temperatures of 1273-1423 K and strain rates of 0.001-10 s-1 with fixed true strain of 0.916 (DRX grains in navy, sub-grains in yellow, deformed grains in red, HAGBs in black, and LAGBs in gray)
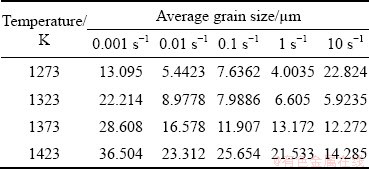
In order to further uncover the effects of deformation parameters on DRX behaviors, the volume fraction of DRX grain and average grain size for Nimonic 80A superalloy are collected from the EBSD maps in Fig. 4, and their variations along with temperature and strain rate are exhibited in Fig. 5. As shown in Fig. 5(a), a multilayered contour map is constructed to characterize the responses of the volume fraction of DRX grain (Layer 1), sub-grain (Layer 2) and deformed grain (Layer 3) to temperature and strain rate. By combining Fig. 5(a) with Fig. 4, it is apparently found that DRX becomes sluggish in the low temperature range of 1273-1323 K and the intermediate strain rate of 0.1-1 s-1. The micro- structures are mainly composed of deformed grains and sub-grains, and the volume fraction of sub-grain is the highest, which indicates an incomplete DRX process. It is noteworthy that the microstructures with more than 65 vol.% of DRX can be obtained in all deformation conditions except for the regions in low temperatures and mediate strain rates. With increasing temperature, DRX occurs more completely and the DRX grains grow. As well known, the average grain size after deformation is determined by the comprehensive effect of the grain refinement induced by DRX and the grain coarsening resulted from grain growth. The values of average grain size in the observed region corresponding to different deformation conditions are listed in Table 2. Correspondingly, the evolution of average grain size varying with temperature and strain rate is clarified by a contour map, as shown in Fig. 5(b). It is obviously indicated that the average grain size increases with decreasing strain rate at a fixed temperature. This is explained by the fact that while the time of DRX process is longer, the recrystallized grains have sufficient time to grow. Thus, the microstructures with finer grain size can be achieved under higher strain rates. Moreover, as for a fixed strain rate, it can also be seen from Fig. 5(b) that the average grain size increases more prominently with increasing the temperature. On one hand, slipping is a thermal activation process, and more potential slipping systems are activated at higher temperature, which will enhance DRX progress. On the other hand, the growth of DRX grains significantly increases in virtue of the higher grain boundary mobility induced by elevated temperature. As thus, more and more sub-grains transform to DRX grains, and then grow up and homogenize under the coordinate promotion of DRX and grain growth at high temperature. Based on the above analysis, it can be concluded that the average grain size increases with decreasing the strain rate and increasing the temperature.

Fig. 5 Multilayered contour map containing volume fraction of DRX grain (Layer 1), sub-grain (Layer 2) and deformed grain (Layer 3) (a), and evolution of average grain size varying with temperature and strain rate (b)
Table 2 Values of average grain size for Nimonic 80A superalloy at various temperatures and strain rates
4.2 Evolution of stored energy and its characterization
Features highlighting the local intragranular misorientation of microstructures in specimens deformed at various temperatures and strain rates were characterized to understand the development of sub-grain networks and calculate stored energy. The Kernel average misorientation (KAM) maps of the deformed specimens are shown in Fig. 6. Combining Fig. 6 with Fig. 4, it is obviously found that these KAM maps corresponding to low temperature and moderate strain rate conditions are characterized by the abundant accumulation of sub-grain networks consisting of LAGB clusters.

Fig. 6 KAM maps of Nimonic 80A superalloy at temperatures of 1273-1423 K and strain rates of 0.001-10 s-1 with fixed true strain of 0.916
However, it is noted that the microstructures with fully recrystallized grain are characterized as deficient sub-grain networks with low local intra- granular misorientation. It is believed that DRX can be regarded as a counteracting mechanism of forming new dislocation-free DRX grains, and the formation of DRX grains contributes to decreasing the local intragranular misorientation. Thus, the characteristics on the lack of local intragranular misorientation in DRX regions are more noticeable at high temperature. Meanwhile, the higher mobility of grain boundaries induced by the elevated temperature during grain boundary migration facilitates more sub-grain networks to transform to DRX grains and then grow up.
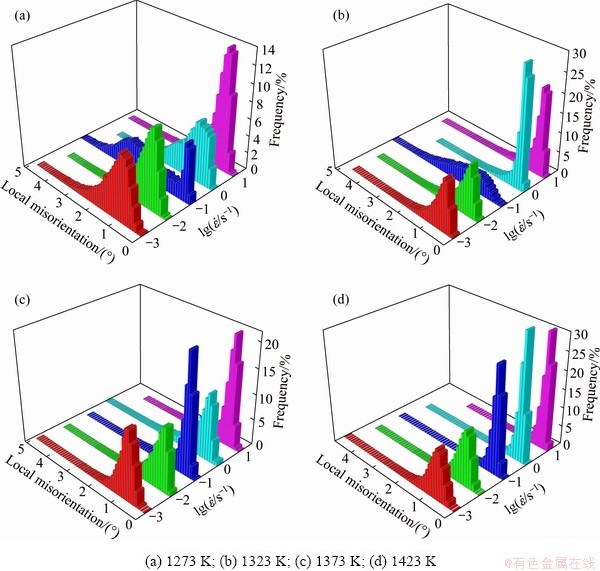
Fig. 7 3D histogram highlighting local intragranular misorientation distributions of deformed specimens for Nimonic 80A superalloy at various deformation parameters
Theoretically, the existence of local intra- granular misorientation networks can be attributed to the formation of geometrically necessary dislocations (GNDs). The GNDs can rearrange themselves into LAGBs and ensure the coordination of plastic deformation between neighboring grains [8]. That is to say, the local intragranular misorientation is an indicator of the sub-grain network evolution. In order to intuitively analyze the characteristics of local intragranular misorientation distribution, the boundary length fractions of local intragranular misorientation angles are summarized from the KAM maps and exhibited in three-dimensional (3D) histograms as Fig. 7. It can be seen that the majority of local intragranular misorientation angles are less than 2�� over all deformation temperatures and strain rates. It is worth emphasizing that most of the local intragranular misorientation angles exceed 2�� at the temperature of 1273 K and the strain rate of 0.1 s-1, which implies a larger transformation trend of sub-structures to DRX grains. In addition, in order to clarify the evident difference between average misorientation angle and average KAM values at various deformation parameters, two contour maps are constructed, as shown in Fig. 8. Apparently, the variations of average misorientation angle and average KAM value follow an opposite trend along with temperature and strain rate. Combining Fig. 6 with Fig. 8, it can be conclusively inferred that the average misorientation angle decreases with the generation of LAGBs, while increases as HAGBs form.

Fig. 8 Evolutions of average misorientation angle (a) and average KAM value (b) varying with temperature and strain rate
It is well known that both nucleation and growth of DRX grains require dislocation multi- plication and grain boundary migration. The velocity of grain boundary migration is strongly related to stored energy [27]. Besides, the average stored energy Es is an key indicator reflecting the evolution behaviors of ��3n twin boundaries density in a thermal-plastic deformation. According to Ref. [28], when the details of the structure are unknown, the stored energy Es in Eq. (15), can be calculated from EBSD data by using the experimentally observed distribution of misorientation angles and considering the contribution to stored energy of boundaries with different misorientation angles. Accordingly, the stored energy equation can be expressed as
Es=Sv<��(P(��))>=Sv(P(0��-1��))��(0��-1��)+(P(1��-2��))��(1��-2��)+��) (16)
where Sv is the boundary area per unit volume of low-angle grain boundary, which can be replaced by the boundary length per unit area, LA, using Eq. (17):
 (17)
(17)
In the calculation of boundary length per unit area (LA), there exists a correction due to the stepped natures of EBSD maps:
 (18)
(18)
where  =��/A; �� and A are the step size and area, respectively [28,29].
The term <��(P(��))> represents the boundary energy per unit area, which can be obtained from the observed misorientation angle distribution P(��) in EBSD maps, and P(X-Y) is the fraction of boundary length with misorientation in the range from X to Y. The value of <��(P(��))> corresponding to different misorientation angles can be expressed by Read�CShockley function as
 (19)
(19)
where ��m is the energy per unit area of a high-angle boundary, to be 0.87 J/m2 for nickel [30]; ��m is the critical grain boundary misorientation, generally taken as 15��.
Based on the Eqs. (16)-(19), the values of stored energy Es at various deformation parameters are calculated, as listed in Table 3. The response of stored energy to temperature and strain rate is characterized in Fig. 9. In addition, the contour plot of grain size is constructed based on the data listed in Table 2, and its distribution at different temperatures and strain rates is also exhibited in Fig. 9. Therefore, a superimposed map of contour plot of grain size over stored energy map is obtained to study the relationship between grain size and stored energy. In Fig. 9, different colors represent diverse stored energy values.
Table 3 Values of average stored energy Es for Nimonic 80A superalloy at various temperatures and strain rates


Fig. 9 Superimposed map of contour plot of grain size over stored energy map, as function of deformation temperature and strain rate
In Fig. 9, it is apparent that the value of stored energy decreases with increasing temperature in the low strain rates of 0.01-0.001 s-1 and the high strain rates of 1-10 s-1. The high stored energy and finer grains with size less than 7 ��m concentrate in the low temperature range of 1273-1323 K and the high strain rate range of 1-10 s-1. It is well known that the stored energy in the grain boundaries originates from the difference in dislocation density within sub-grains or grains, and it grows rapidly to DRX activation energy with the deformation proceeding. So, the elevated stored energy is attributed to high nucleation rate of DRX grains. However, with increasing temperature, the stored energy is consumed because of the high rate of grain boundary migration during grain growth. With that, it can be seen obviously in Fig. 9 that stored energy declines with increasing grain size. Abnormally, at the intermediate strain rate of 0.1 s-1, it is found that the value of stored energy increases with increasing temperature, which presents an opposite tendency in comparison to low and high strain rates. This is mainly due to the fact that the nucleation of DRX grains is prominently increased with increasing temperature. It must be pointed out that the stored energy can decrease again attributing to the growth of DRX grain at higher temperature.
By combining the contour plot of grain size and stored energy map in Fig. 9, it is apparently found that the variation of stored energy is strongly associated with grain size. And there is a significant difference in the relationship under various strain rates. It can be summarized that stored energy decreases with increasing grain size in the low strain rate range of 0.01-0.001 s-1 and the high strain rate range of 1-10 s-1; while it increases firstly and then decreases with grain size increasing at the intermediate strain rate of 0.1 s-1.
Based on the data listed in Table 2 and Table 3, the quantitative relationship between average stored energy and grain size is figured out by using Eq. (14) with the grain size exponent for Nimonic 80A superalloy of n=0.74 [18], and the coefficient values of c3 and c4 at diverse strain rates are obtained. Such relationship is plotted in Fig. 10, and the fitting results are recorded in Table 4.

Fig. 10 Relationships between stored energy and grain size for Nimonic 80A superalloy at various strain rates
In the following, the relationship between coefficient values and strain rate is further described by a polynomial function as Eq. (20), in which  is defined as the independent variable x:
f(x)=a+bx+cx2+dx3+ex4 (20)
The polynomial function is fitted with a high correlation coefficient R, and the results are given in Table 5. Hence, the relationship between stored energy and grain size can be expressed as follows:
 (21)
(21)
4.3 Evolution of twin boundary density and its characterization
In order to intuitively analyze the characteristics of ��3n twin boundaries and the evolution of twin boundary density, the BC maps with ��3n twin boundaries in the specimens deformed at temperatures of 1273-1423 K and strain rates of 0.001-10 s-1 are obtained and shown in Fig. 11. It is worth mentioning that when the proportion of ��3n twin boundaries is above a threshold level, the twin boundaries will interact and lead to ��multiple twinning�� [9,10]. The interactions are governed by the following rules concerning the joining or dissociation of ��3n twin boundaries [11]:
 (22)
(22)
It can be seen from Fig. 11 that these BC maps are characterized as numerous ��3n twin boundaries, which mainly appear in high angle grains with straight interfaces. What is more, the proportion of ��3 twin boundaries is much larger than that of ��9 and ��27 twin boundaries. By comparing Fig. 11 with Fig. 4, it is worth noting that the ��3n twin boundaries are profuse within DRX grains but rarely exist in deformed grains or sub-grains. Meanwhile, the sub-grains formed around the ��3n twin clusters and stopped at HAGBs. The generated ��3n twin boundaries are not only the products of the recrystallization structures, but also play an important role in the DRX process. On one hand, the formation of ��3n twin boundaries would change the crystal orientation, i.e. transform slipping system from hard orientation to soft orientation, which motivates further slipping of crystals [6]. On the other hand, the formation of ��3n twin boundaries can increase the amount of grain boundaries in favor of the nucleation of DRX grains.
Based on the BC maps in Fig. 11, the values of BLD��3n under various deformation conditions are calculated, as listed in Table 6. The responses of BLD��3n to temperature and strain rate are characterized in Fig. 12. The contour plots of stored energy and grain size are constructed based on the data listed in Table 2 and Table 3, and their distributions are also exhibited in Fig. 12(a) and Fig. 12(b), respectively. Additionally, two super-imposed contour plot maps of stored energy over BLD��3n, and grain size over BLD��3n are constructed to clarify the corresponding relationships of BLD��3n with stored energy and grain size. In these superimposed maps, different colors represent diverse values of BLD��3n, and the contour represents average stored energy in Fig. 12(a) and grain size in Fig. 12(b).
Table 4 Fitting results of relationships between average stored energy and grain size for Nimonic 80A superalloy at different strain rates by using Eq. (14)

Table 5 Fitting results of coefficient values in Eq. (20)


Fig. 11 BC maps with ��3n twin boundaries of Nimonic 80A superalloy at temperatures of 1273-1473 K and strain rates of 0.001-10 s-1 with fixed true strain of 0.916 (HAGBs in black, LAGBs in gray, ��3 in red, ��9 in fuchsia and ��27 in aqua)
Table 6 Values of BLD��3n for Nimonic 80A superalloy at various temperatures and strain rates


Fig. 12 Superimposed maps as function of deformation temperature and strain rate
In Fig. 12, it is evident that the evolution of twins is sluggish at the intermediate strain rate of 0.1 s-1. This implies that the probability of forming twins decreases in contrast to high and low strain rate. Meanwhile, the interaction among the formed ��3n twin boundaries within DRX grains is subtle and does not make up grain boundary networks thus reducing BLD��3n. Similar results have been obtained in the study of GH690 superalloy [31]. Additionally, it is also obviously found that the value of BLD��3n increases with increasing temperature at the intermediate strain rate of 0.1 s-1. The most obvious reason for this phenomenon is that DRX occurs more completely with temperature increasing, which can increase the probability of accidental growth during DRX process. Moreover, higher stored energy induced by the elevated temperature can improve twin density by facilitating the nucleation of annealing twins. In contrast, at the low strain rate of 0.01-0.001 s-1 and the high strain rate of 1-10 s-1, it is found that the value of BLD��3n decreases with increasing temperature, which exhibits an opposite variation tendency. This is mainly because the available time for twin nucleation is considerably less due to the higher grain boundary mobility at elevated temperature, which may not be favorable for the nucleation or generation of new annealing twins [27]. More importantly, grain boundary migration would prominently consume energy at elevated temperature, resulting in lower stored energy for forming twins. By combining Fig. 12(a) and Fig. 12(b), the most obvious phenomenon is that the higher stored energy and finer grains with size less than 7 ��m concentrate in the low temperature range of 1273-1323 K and the high strain rate range of 1-10 s-1. When deformed under these conditions, the probability of the interaction among ��3n twin boundaries increases, which leads to the formation of new grain boundaries and accelerates the progress of DRX. Correspondingly, the higher BLD��3n with finer microstructures are achieved as well.
By combing the contour plot of stored energy and BLD��3n map (as shown in Fig. 12(a)), it is apparently found that the variations of BLD��3n and stored energy follow an similar tendency at all strain rates and temperatures. It can be summarized that the value of BLD��3n increases with increasing stored energy. Such results also confirm that the stored energy plays a predominant role in annealing twin formation. By comparing Fig. 12(b) with Fig. 12(a), it is worth emphasizing that the variation of grain size with temperature and strain rate is inconsistent with BLD��3n, which indicates that there is a nonlinear relationship between grain size and BLD��3n.
4.4 Solution of improved model based on stored energy and grain size
To quantitatively evaluate the twin density evolution in the thermal-plastic deformation of Nimonic 80A superalloy, the improved twin density model is solved by using Eq. (15) and Eq. (21) based on the EBSD results of average grain size, stored energy Es and BLD��3n in Table 2, Table 3 and Table 6. The constants of the improved twin density model are determined by the least square method. Correspondingly, the solved results are as follows: the relative coefficient of the model is 0.938. The coefficient values of k7 and k3 in Eq. (15) are 0.0412 and 0.5777, respectively, and the critical grain size D0 is 3.1796 ��m. It should be noted that the value of D0 is close to other investigations where D0 was 1.5 ��m [17] and 2.5 ��m [19] for pure Ni, while it differs from the result where D0 was 0.19 ��m in Ref. [18] for Nimonic 80A. This is mainly due to the fact that the improved twin density model is established in a wide range of deformation condition where DRX may not occur completely in all conditions. And the lower driving force in the sluggish DRX process will significantly increase the threshold grain size for forming twins. Ultimately, the improved twin density model based on stored energy and grain size is summarized as follows:
 (23)
(23)
Further, the 3D response surface of BLD��3n as a function of average grain size and stored energy is plotted in Fig. 13. It is evident that BLD��3n is governed by the synergistic effect of grain size and stored energy. It can be summarized that the BLD��3n increases sharply with increasing stored energy and grain size, and then decreases gradually with increasing grain size and decreasing stored energy. The summit of BLD��3n corresponds to the relatively higher stored energy and finer grain size. As thus, in order to obtain higher twin density and better comprehensive properties, the thermal deformation parameters corresponding to higher stored energy and finer grain size are pursued, while the excessive grain growth on consumption of BLD��3n should be controlled in thermal deformation.

Fig. 13 3D response surface of BLD��3n as function of grain size and stored energy
5 Predictability assessment of improved model
For the sake of predictability assessment of the improved twin boundary density model, three verification experiments were performed at the temperature of 1473 K and the strain rates of 0.001, 0.01 and 0.1 s-1 with a fixed true strain of 0.916. The EBSD maps with DRX fraction and ��3n twin boundaries of the deformed specimens are shown in Fig. 14. Additionally, the values of average grain size, stored energy and BLD��3n are also calculated from the EBSD maps, and then the comparisons of stored energy and BLD��3n between experimental and predicted results under these deformation conditions are exhibited in Fig. 15. It is quite clear that the predicted values are in great agreement with the experimental ones. The mean relative error for BLD��3n between the experimental results and predicted ones are limited in 2.8%. It is indicated that the improved twin density model can predict the twin density evolution well in the thermal- plastic deformation of Nimonic 80A superalloy.
6 Conclusions
(1) DRX occurs completely in all deformation conditions except for the regions in low temperature and mediate strain rate. Moreover, the grain size increases with decreasing strain rate and increasing temperature.
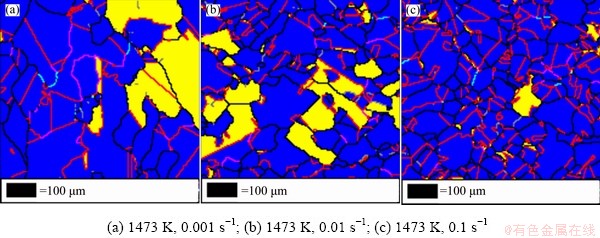
Fig. 14 BC maps with DRX fraction and ��3n twin boundaries of Nimonic 80A superalloy under various deformation conditions

Fig. 15 Comparisons of BLD��3n and Es between experimental and predicted results under various deformation conditions
(2) The relationship between stored energy and grain size is characterized as a superimposed map and further described as a quantitative function. It is shown that stored energy decreases with increasing grain size at low and high strain rates, while it increases firstly and then decreases with grain size increasing at intermediate strain rate.
(3) Two superimposed contour plot maps are constructed to clarify the corresponding relationships of BLD��3n with stored energy and grain size varying with temperature and strain rate. BLD��3n increases with increasing stored energy and decreasing grain size, and higher BLD��3n with finer grains is achieved at lower temperatures and higher strain rates.
(4) An improved twin density model, as a function of average grain size and stored energy, is developed. Based on the EBSD statistical results of grain size and BLD��3n, the model of Nimonic 80A superalloy is solved with a relative coefficient of 0.938, and its expression is as follows:
(5) The prediction tolerance of the solved model is evaluated as limited in 2.8% by three verification experiments, which indicates that the improved twin density model can describe the twin density evolution well in the thermal-plastic deformation of Nimonic 80A superalloy.
Acknowledgments
The authors are grateful for the financial supports from Chongqing Basic Research and Frontier Exploration Program, China (cstc2018jcyjAX0459), the Fundamental Research Funds for the Central Universities, China (2019CDQYTM027, 2019CDJGFCL003, 2018- CDPTCG0001-6), and Open Fund of State Key Laboratory of Materials Processing and Die & Mould Technology, China (P2020-001).
References
[1] LIN Y C, NONG Fu-qi, CHEN Xiao-min, CHEN Dong-dong, CHEN Ming-song. Microstructural evolution and constitutive models to predict hot deformation behaviors of a nickel-based superalloy [J]. Vacuum, 2017, 137: 104-114.
[2] ZHU Yuan-zhi, YIN Zhi-min, XU Jiang-pin. Microstructural mapping in closed die forging process of superalloy Nimonic 80A valve head [J]. Journal of Alloys and Compounds, 2011, 509: 6106-6112.
[3] QUAN Guo-zheng, LIU Qiao, ZHAO Jiang, XIONG Wei, SHI Rui-ju. Determination of dynamic recrystallization parameter domains of Ni80A superalloy by enhanced processing maps [J]. Transactions of Nonferrous Metals Society of China, 2019, 29: 1449-1464.
[4] QUAN Guo-zheng, LI Yong-le, ZHANG Le, WANG Xuan. Evolution of grain refinement degree induced by dynamic recrystallization for Nimonic 80A during hot compression process and its FEM analysis [J]. Vacuum, 2017, 139: 51-63.
[5] WANG Y, SHAO W Z, ZHEN L, ZHANG X M. Microstructure evolution during dynamic recrystallization of hot deformed superalloy 718 [J]. Materials Science and Engineering A, 2008, 486: 321-332.
[6] QIN Feng-ming, ZHU Hua, WANG Zhen-xing, ZHAO Xiao-dong, HE Wen-wu, CHEN Hui-qin. Dislocation and twinning mechanisms for dynamic recrystallization of as-cast Mn18Cr18N steel [J]. Materials Science and Engineering A, 2017, 684: 634-644.
[7] DETROIS M, GOETZ R L, HELMINK R C, TIN S. Modeling the effect of thermal�Cmechanical processing parameters on the density and length fraction of twin boundaries in Ni-base superalloy RR1000 [J]. Materials Science and Engineering A, 2015, 647: 157-162.
[8] JIANG He, DONG Jian-xin, ZHANG Mai-cang, YAO Zhi-hao. Evolution of twins and substructures during low strain rate hot deformation and contribution to dynamic recrystallization in alloy 617B [J]. Materials Science and Engineering A, 2016, 649: 369-381.
[9] CHEN Xiao-min, LIN Y C, WU Fan. EBSD study of grain growth behavior and annealing twin evolution after full recrystallization in a nickel-based superalloy [J]. Journal of Alloys and Compounds, 2017, 724: 198-207.
[10] PRITHIV T S, BHUYAN P, PRADHAN S K, SARMA V S, MANDAL S. A critical evaluation on efficacy of recrystallization vs strain induced boundary migration in achieving grain boundary engineered microstructure in a Ni-base superalloy [J]. Acta Materialia, 2018, 146: 187-201.
[11] RANDEL V. Twinning-related grain boundary engineering [J]. Acta Materialia, 2004, 52: 4067-4081.
[12] GLEITER H. The formation of annealing twins [J]. Acta Metallurgica, 1969, 17: 1421-1428.
[13] PANDE C S, IMAM M A, RATH B B. Study of annealing twins in fcc metals and alloys [J]. Metallurgical Transactions A, 1990, 21: 2891-2896.
[14] NIELSEN J P. The origin of annealing twins [J]. Acta Metallurgica, 1967, 15: 1083-1085.
[15] KUMAR M, SCHWARTZ A J, KING W E. Microstructural evolution during grain boundary engineering of low to medium stacking fault energy fcc materials [J]. Acta Materialia, 2002, 50: 2599-2612.
[16] DASH S, BROWN N. An investigation of the origin and growth of annealing twins [J]. Acta Metallurgica, 1963, 11: 1067-1075.
[17] CAHOON J R, LI Qiang-yong, RICHARDS N L. Microstructural and processing factors influencing the formation of annealing twins [J]. Materials Science and Engineering A, 2009, 526: 56-61.
[18] SHI Hui, CHEN Ke, SHEN Zhi, WU Jie-qiong, DONG Xian-ping, ZHAGN Lan-ting, SHAN Ai-dang. Twin boundary characters established during dynamic recrystallization in a nickel alloy [J]. Materials Characterization, 2015, 110: 52-59.
[19] JIN Y, LIN B, BERNACKI M, ROHRER G S, ROLLETT A D, BOZZOLO N. Annealing twin development during recrystallization and grain growth in pure nickel [J]. Materials Science and Engineering A, 2014, 597: 295-303.
[20] LI Qiang-yong, CAHOON J R, RICHARDS N L. Effects of thermo-mechanical processing parameters on the special boundary configurations of commercially pure nickel [J]. Materials Science and Engineering A, 2009, 527: 263-271.
[21] DASHARATH S M, MULA S. Microstructural evolution and mechanical properties of low SFE Cu-Al alloys processed by cryorolling followed by short-annealing [J]. Materials & Design, 2016, 99: 552-564.
[22] HALLBERG H, WALLIN M, RISTINMAA M. Simulation of discontinuous dynamic recrystallization in pure Cu using a probabilistic cellular automaton [J]. Computational Materials Science, 2010, 49: 25-34.
[23] LIANG Hou-quan, GUO Hong-zhen, TAN Kai, NING Y Q, LUO Xin, CAO Gang, WANG Jia-jun, ZHEN Peng-liang. Correlation between grain size and flow stress during steady-state dynamic recrystallization [J]. Materials Science and Engineering A, 2015, 638: 357-362.
[24] JORGE-BADIOLA D, IZA-MENDIA A, GUTIERREZ I. Evaluation of intragranular misorientation parameters measured by EBSD in a hot worked austenitic stainless steel [J]. Microsc, 2007, 228: 373-383.
[25] BRANDON D G. The structure of high-angle grain boundaries [J]. Acta Metallurgica, 1966, 14: 1479-1484.
[26] MCCARLEY J, TIN S. Understanding the effects of recrystallization and strain induced boundary migration on ��3 twin boundary formation in Ni-base superalloys during iterative sub-solvus annealing [J]. Materials Science and Engineering A, 2019, 740-741: 427-438.
[27] PRAHAN S K, MANDAL S, ATHREYA C N, BABU K A, BOER B D, SARMA V S. Influence of processing parameters on dynamic recrystallization and the associated annealing twin boundary evolution in a nickel base superalloy [J]. Materials Science and Engineering A, 2017, 700: 49-58.
[28] GODFREY A, CAO W Q, HANSEN N, LIU Q. Stored energy, microstructure, and flow stress of deformed metals [J]. Metallurgical and Materials Transactions A, 2005, 36: 2371-2378.
[29] CAO W Q, GODFREY A, LIU Q. EBSP investigation of microstructure and texture evolution during equal channel angular pressing of aluminium [J]. Materials Science and Engineering A, 2003, 361: 9-14.
[30] KNUDSEN T, CAO W Q, GODFREY A, LIU Q, HANSAN N. Stored energy in nickel cold rolled to large strains, measured by calorimetry and evaluated from the microstructure [J]. Metallurgical and Materials Transactions A, 2008, 39: 430-440.
[31] SHI Zhao-xia, Yan Xiao-feng, DUAN Chun-hua, ZHAO Ming-han. Effect of strain rate on hot deformation characteristics of GH690 superalloy [J]. Transactions of Nonferrous Metals Society of China, 2017, 27: 538-550.
�������ºϽ�����Ͼ����ܶ��������Ա��β�������Ӧ��ϵ
Ȩ����1,2��������1���� ��1����ңң1��������3
1. �����ѧ ���Ͽ�ѧ�빤��ѧԺ������ 400044��
2. ���пƼ���ѧ ���ϳ�����ģ���������ص�ʵ���ң��人 430074��
3. �����ѧ ��ľ����ѧԺ������ 400045
ժ Ҫ��Ϊ���������������������Ա��ι����е����Ͼ����ܶ�(BLD��3n)���ݻ���������ƽ�������ߴ�ʹ���Ϊ�����ĸĽ��Ͼ��ܶ�ģ�͡�����Nimonic 80A���ºϽ����¶ȷ�Χ1273~1423 K��Ӧ�����ʷ�Χ0.001~10 s-1�½��е���ѹ����EBSDʵ�飬����EBSD����ͳ�Ƶľ����ߴ��BLD��3n��������Ͼ��ܶ�ģ�ͽ�����⡣ͨ�������ȸ��ߵ���ͼ����ʾBLD��3n�뾧���ߴ�ʹ������¶Ⱥ�Ӧ�����ʱ仯�Ķ�Ӧ��ϵ�����������BLD��3n�洢�ܵ����Ӻ;����ߴ�ļ�С�����ߵ�BLD��3n��ϸ����֯��Ӧ�ϵ͵��¶Ⱥͽϸߵ�Ӧ�����ʡ����ֶ�Ӧ��ϵ���տ�����Nimonic 80A�Ͻ�Ľ��Ͼ��ܶ�ģ�ͱ�ʾ����ģ�͵�Ԥ���ݲ�Ϊ2.8%��
�ؼ��ʣ�Nimonic 80A���ºϽ��Ͼ��磻����֯�ݻ�����̬�ٽᾧ�������ߴ磻����
(Edited by Bing YANG)
Corresponding author: Guo-zheng QUAN; Tel: +86-15922900904; E-mail: quangz3000@sina.com
DOI: 10.1016/S1003-6326(21)65508-5
1003-6326/ 2021 The Nonferrous Metals Society of China. Published by Elsevier Ltd & Science Press
Abstract: To deeply understand and even describe the evolutions of the low-energy twin boundary density (BLD��3n) in a thermal-plastic deformation process, an improved twin density model as a function of average grain size and stored energy is developed. For Nimonic 80A superalloy, the model is solved based on the EBSD statistical results of grain size and BLD��3n in the specimens compressed at temperatures of 1273-1423 K and strain rates of 0.001-10 s-1. The corresponding relationships of BLD��3n with stored energy and grain size varying with temperature and strain rate are clarified by the superimposed contour plot maps. It is summarized that BLD��3n increases with increasing stored energy and decreasing grain size, and higher BLD��3n with finer grains corresponds with lower temperatures and higher strain rates. Such relationships are described by the improved twin density model, and the prediction tolerance of the solved model is limited in 2.8%.
[12] GLEITER H. The formation of annealing twins [J]. Acta Metallurgica, 1969, 17: 1421-1428.
[14] NIELSEN J P. The origin of annealing twins [J]. Acta Metallurgica, 1967, 15: 1083-1085.
" target="blank">[31] SHI Zhao-xia, Yan Xiao-feng, DUAN Chun-hua, ZHAO Ming-han. Effect of strain rate on hot deformation characteristics of GH690 superalloy [J]. Transactions of Nonferrous Metals Society of China, 2017, 27: 538-550.
