
Trans. Nonferrous Met. Soc. China 22(2012) 2952-2959
Friction coefficient in rubber forming process of Ti-15-3 alloy
SUN Yong-na, WAN Min, WU Xiang-dong
School of Mechanical Engineering and Automation, Beihang University, Beijing 100191, China
Received 26 June 2012; accepted 15 October 2012
Abstract:
The forming limit diagram of Ti-15-3 alloy sheet was constituted at room temperature. The effects of different punch and rubber hardness on the limit principal strain distributions were investigated experimentally. Finite element analysis models of the samples with dimensions of 180 mm��180 mm were established to analyze the friction coefficients of different interfaces. Effects of various friction coefficients on the strain distributions were studied in detail. Finally, the friction coefficients in the cold forming were determined by contrasting the strain results between the experimental data and the simulated ones.
Key words:
Ti-15-3 alloy; rubber forming; friction; bulging; principal strain; finite element analysis;
1 Introduction
Ti-15-3 alloy (Ti-15V-3Al-3Cr-3Sn), as one type of the metastable ��-phase titanium alloys, is one of the best candidates for aerospace application, not only owing to its mutual advantages, but also special advantages such as excellent cold deformability and ability to age to high strength [1,2]. Furthermore, the reduction reaches up to 90% when Ti-15-3 alloy is deformed at room temperature [2]. Unfortunately, the cold sheet metal forming process and application of Ti-15-3 alloy are still at the research stage, mainly owing to its inherent low plasticity and high deformation force [3].
The traditional sheet metal forming process is performed through a punch always together with a blank-holder, in which the sheet metal is forced to comply with the shape of the punch. Adopting a rubber pad contained in the rigid chamber acting as a punch, the process, also known as rubber pad forming or Guerin process, requires the use of a single metallic die/punch, in which the sheet is placed between the rubber pad and the die. With the press advancing, the rubber deforms at constant volume. Owing to its incompressibility, the rubber acts somewhat like hydraulic fluid under nearly equal pressure on the blank sheet surface when it is pressed around the block or punch. The main attraction of rubber forming is its simplicity, so it can be used for prototype development or for low-volume production. Furthermore, the rubber forming can diminish the forming procedure, shorten the production preparation cycle, lessen the springback and improve the surface quality [4-6].
Nevertheless, the behavior of Ti-15-3 alloy in the forming deformation is complex and sheets are subjected to various types of strain and different types of failures such as necking, fracture or wrinkling will occur when the strain reaches or exceeds a critical value [7]. It is difficult to assess the resistance of Ti-15-3 alloy to fracture owing to its cold deformation behavior in the sheet metal forming process at room temperature. The study on the failure is rarely found. The phenomenon of fracture is generally analyzed according to the forming limit diagram (FLD), which provides a very useful tool for characterizing the formability of sheet metals. The FLD is plots of the limiting principal strains, in which a sheet metal can sustain prior to the onset of localized necking when being formed [7,8]. And the FLD is regarded as an important means of the optimization and die design due to the fact that it can predict the strain path through which the strains lead to material failure [8].
Recently, the finite element method (FEM) has been widely used to simulate sheet metal forming and plays an important role in quality control and problem analysis, but the application is limited by the accuracy of the description of the friction phenomena in the sheet/tool contact area. However, FEM concerning the rubber forming process is relatively backward and unbalanced compared with the developing of FEM in the traditional sheet forming process with rigid die, owing to complicated friction condition and deformation of rubber. Moreover, the friction between the sheet and the tool has a significant influence on the material formability and quality of the formed part [9]. Nevertheless, the friction condition cannot change the forming limit strain of the sheet metal but can change the distribution of stress and strain, which can affect the defects in the metal forming [10,11].
Based on the circle grid analysis technology, the major and minor strains in the deformed circle can be measured directly by the grid measurement and analysis system (GMAS) [12].
Several studies have been carried out to analyze the friction behavior in the rubber forming. DIRIKOLU and AKDEMIR [11] and PRETE et al [13] carried out finite element simulation studies concerning the flexible forming process to investigate the influence of rubber hardness and blank material type on stress distribution in the formed blank. All of them took into the frictional behavior by using a constant coefficient of friction but neglected the effects of various friction coefficient on the stress distribution. PENG et al [9] carried out finite element simulation using the Coulomb friction model and MAZIAR et al [4,10] presented the theoretical friction model to investigate the effects of various friction coefficients on the blank thinning and stress distribution in the rubber forming. But all of these can not find reference of strain and lack comparison of stress with the experiment. The Coulomb friction model is probably the most well-known and the easiest friction model, which is widely used in the finite element simulation to describe the friction in mechanical contacts [4]. Therefore, it is necessary to investigate the coefficient of friction in the rubber forming of Ti-15-3 alloy at room temperature, which is an essential input parameter for the use of FEM for rubber forming.
Physically, the friction changes in the forming process owing to the tangential reaction force between surfaces in contact, which is the result of many different mechanisms depending on contact geometry and topology, properties of the bulk and surface materials of the bodies, displacement and relative velocity of the bodies and the presence of lubrication. Therefore, the friction test can provide an approximate value of friction coefficient. In the present work, the FLD of Ti-15-3 alloy at room temperature is plotted from the forming limit test to characterize the formability of Ti-15-3 alloy and study the effect of friction coefficient on the strain path leading to failure. Friction test for Ti-15-3 alloy sheet is carried out in friction machine tool in order to investigate the friction coefficient between the sheet and steel punch under neither lubricant nor deformation condition. Furthermore, to determine the friction coefficient effect on the limit strain, bulging test and corresponding FEM simulation using ABAQUS/Explicit are carried out for the samples with dimensions of 180 mm �� 180 mm. The friction coefficients of Ti-15-3 alloy in contact with steel punch, under lubrication and deformation conditions, and with the rubber are finally determined by contrasting the strain results between the experimental data and the simulated ones.
2 Bulging experiments
2.1 FLD tests
In this study, Ti-15-3 sheet titanium alloy with 1.0 mm in thickness was used. Hecker��s simplified technique was used to evaluate empirical FLD [14], which mainly involves three stages: grid marking the sheet specimens, punch stretching the grid-marked samples to failure or onset of localized necking, and measurement of strains.
A set of specimens with a fixed length of 180 mm and a width between 180 mm and 20 mm in the step of 20 mm were prepared in the rolling direction of the sheet metal. Figure 1 shows the geometry and dimensions of the specimens. The sheets were subjected to different states of strain, such as the tension-tension zone, the plane strain zone and the tension-compression zone by decreasing the width of the samples [15].
Then the surfaces of specimens were etched on the grid circle pattern electrochemically to measure the strain and the initial diameter of circles was 2.5 mm. Before tests, the interfaces between the sheet and the punch were cleaned and lubricated. Subsequently, punch- stretching experiments were carried out on the BCS 50 press machine using a hemispherical steel punch with 100 mm in diameter. Tests were run up to fracture or local neck. In addition, at least three specimens were tested for each width to get the maximum number of data points.
After the forming process, the grid circles were deformed to elliptic shapes. And the major and minor limited strains for each specimen were measured directly from ellipses at the onset of localized necking or nearest to the fracture zone utilizing the GMAS. Finally, the FLD was constituted by plotting the principal strains with the minor strain along the abscissa and the corresponding major strain along the ordinate, as shown in Fig. 2.
Figure 2 expresses that under tension-tension condition the principal strain limit of Ti-15-3 alloy is extremely low when the maximum major and maximum minor strain are 0.28 and 0.24, respectively, which means that it has poor formability to sustain when being formed.
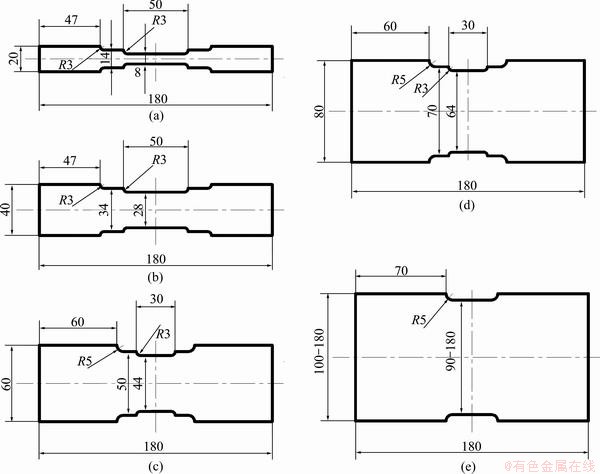
Fig. 1 Geometry and dimensions of specimens with fixed length of 180 mm and varied width between 180 mm and 20 mm in forming limit test (mm)
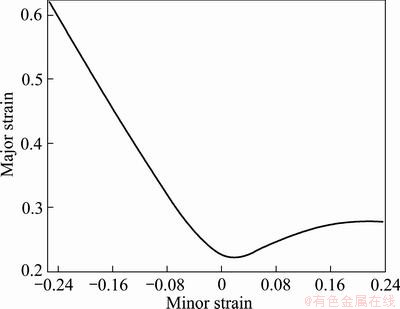
Fig. 2 Forming limit curve of Ti-15-3 alloy with 1.0 mm in thickness
2.2 Bulging with soft punch
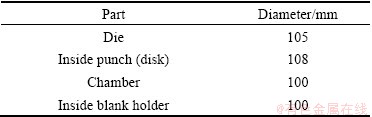
To determine the friction effect on the limit strain, the samples with dimensions of 180 mm��180 mm were bulged by soft punch including rubber forming and hydroforming. Figure 3 shows the schematic view of the equipment used in this work, including die, blank holder, pressure chamber, disk. Table 1 gives the dimensions of the tools used for the soft bulging. The disk at the bottom can move up due to the advance of the punch and transfer the loading force through the viscous medium in the chamber. The sheet metal, on which circles with 2.5 mm in diameter were etched as shown in the forming limit diagram, is placed between the blank holder and the chamber; in the forming process, the sheet was pressed tightly under the blank holder force. As the punch moves up, the soft bulging process starts, in which the medium in the chamber is in contact with one side of the blank. All of the experiments were performed on the BCS 50 press machine. Two kinds of hardness Shore 70 A and 90 A of rubber were adopted in the rubber bulging to investigate the influence of rubber hardness on the friction.
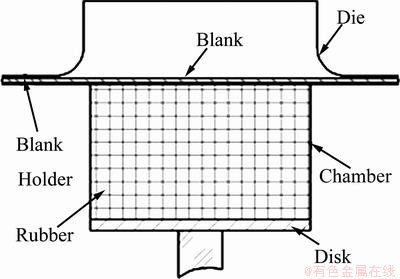
Fig. 3 Schematic view of equipment used in soft bulging
Table 1 Tool dimensions
2.3 Results and discussion
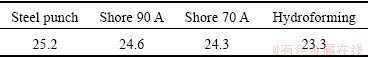
Table 2 presents the measurements of the maximum bulge heights of the parts and illustrates that the height of the hydraulic bulging result is the smallest. Figure 4 gives the results of the different bulging tests on the Ti-15-3 alloy with dimensions of 180 mm��180 mm. The bulged component in this work no matter from the experiment or the finite element simulation is placed as the rolling direction marked by the arrow line in Fig. 4(a).
Table 2 Bulging height (mm)
It can be seen from Fig. 4 that the fracture zone differed with the bulging condition. The distance from the proximity of the crack to the pole of the dome is near 20 mm in the steel punch bulging, as shown in Fig. 4 (a); while under other conditions the onset of cracking is at the pole of the dome, as shown in Figs. 4(b)-(d), indicating negligible friction in the soft bulging tests.
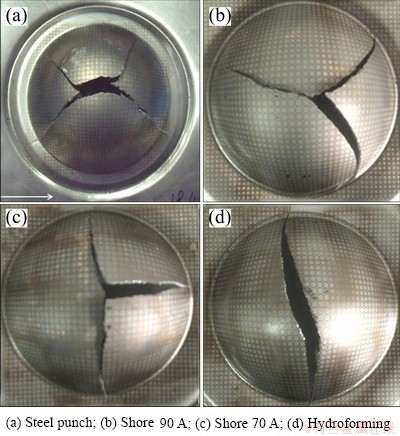
Fig. 4 Components of bulge forming
The measurements of the major and minor strains nearest to the fracture zone were carried out by utilizing the GMAS and fed into the FLD, as shown in Fig. 5. It indicates that the major and minor limit strains of component formed by the rubber bulging near to the equi-biaxial tension condition and the effects of rubber hardness on the principal strains are less than 2%, which are negligible. This means that the hardness of rubber is not a decisive factor in the rubber bulging process owing to the fact that the capability to transfer the loading force is equal in a close container, though the hardness of rubber is different.
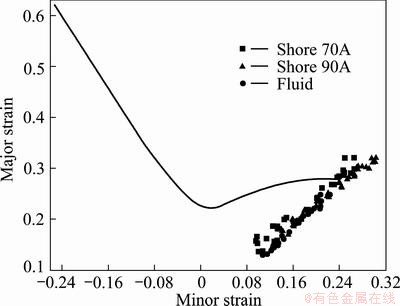
Fig. 5 Distribution of principal limit strains resulting from different bulgings
3 Friction in rubber forming of Ti-15-3 alloy
3.1 Friction between Ti-15-3 alloy and steel
3.1.1 Friction test
Friction test on the cleaned Ti-15-3 alloy specimen with thickness of 1.0 mm, length of 350 mm in the rolling direction and width of 25 mm was carried out on the IRDI DBS Triboteester 5.01 friction testing machine at 200 mm/min. Specimens after testing are presented in Fig. 6. The friction between the Ti-15-3 alloy and the steel with neither deformation nor lubrication is 0.45, derived from the average value of the experiments, which is relatively large than the friction of steel-steel.

Fig. 6 Photos of specimens after friction test
3.1.2 Friction with deformation
In the present work, the influence of the friction coefficient between Ti-15-3 alloy and the steel punch on the strain path and the distribution of strain was studied by simulating steel punch bulging tests using ABAQUS/Explicit.
By taking advantage of the symmetric geometry and boundary conditions, only one quarter of the tooling and the part was modeled. In the finite element simulation, the forming tool consisting of punch, blankholder and die was modeled as rigid body, correspondingly the S4R rigid shell elements were used only to define the tooling geometry and were not for the stress analysis. The metal sheet was defined as deformable and meshed by the 4-node shell elements with reduced integration (S4R). The material plasticity was directly imported to form tension test results of Ti-15-3 alloy sheet specimens with 1.0 mm in thickness prepared according to GB/T228��2002 standard and the elastic-plastic material model was computed with the classical isotropic hardening in FEM. The anisotropy was described by Hill's 1948 yield condition [15,16], in which the material constants F, G, H, L, M, N (stress ratios in ABAQUS/Explicit) were calculated based on Lankford's. Coefficients of r0, r45 and r90 were given in Ref. [17].
The corresponding model with appropriate boundary conditions was established and high stroke of punch was used in the simulation to reflect the influence of friction coefficient on the onset of fracture zone in the bulging process. The pure master-slave contact algorithm was used to simulate the contact between the rigid tools and the penalty function algorithm was utilized to model the friction behavior. The friction coefficient between the sheet and the blankholder/die under neither lubricant nor deformation was ��1. The value of ��1 was 0.45, which was recommended by previous friction test. While the real coefficient of friction between the sheet and the punch with lubricant, indicated as ��2, was obtained through trial-error method in the finite element simulation. Numerical simulations were carried out with different values of ��2, defined from 0 (no friction) to 0.45.
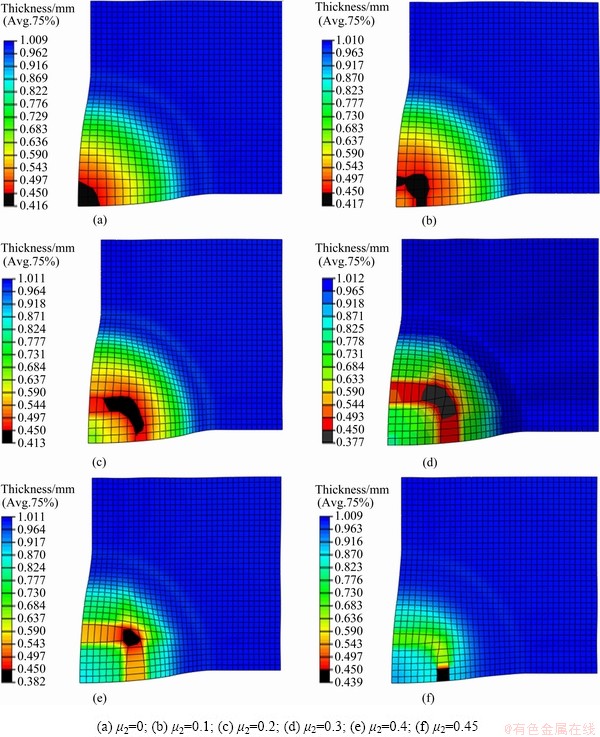
Fig. 7 Distribution of thickness of various friction coefficients between Ti-15-3 alloy and steel punch
Figure 7 provides the thickness distribution of formed workpiece with various ��2. It is clear to see that thickness thinning regions are different owing to various ��2 , indicating that the onset of crack is distinct.
Figure 7 indicates the occurrence of necking and cracking is at the pole of the punch��s dome when there is no friction in the simulation (��2=0), as shown in Fig. 7(a); and the distance of cracking zone from the pole increases when the friction coefficient ��2 increases from 0 to 0.4 along with diagonal (45��) to the rolling direction of the sheet; however, the failure happens in the rolling direction of the sheet when ��2 is 0.45, as shown in Fig. 7(f), inconsistent with the experimental result shown in Fig. 4(a). Therefore, the range of ��2 is from 0.1 to 0.3 based on the comparison of the fracture distribution between the simulation and experimental results.
The thickness thinning was used to evaluate the risk of crack. The principal strains in the region, where thickness thinned severely, were extracted every increment step and fed into the FLD, as shown in Fig. 8. Figure 8 illustrates the strain paths dependent on various ��2 and the maximum limit strain is smaller for the higher friction coefficient.
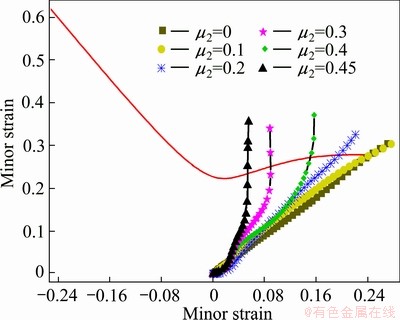
Fig. 8 Stain paths of various friction coefficient between Ti-15-3 alloy and steel punch
To determine the optimal friction coefficient between Ti-15-3 alloy sheet and the steel punch with lubricant and deformation, further investigations were carried out as follows. Equivalent strain of the simulation results in the direction perpendicular (90��) to the rolling direction of the sheet were extracted and compared with the experimental results in the same location. Figure 9 plots the equivalent strain as the ordinate and corresponding distance from the pole of the punch��s dome and when ��2 is 0.3, and the simulation has relatively excellent consistency with experimental results but with errors. Subsequently, a serial successive approximation investigations of ��2 ranging from 0.25 to 0.3 with step of 0.01 was carried out. When ��2 is 0.27, the error of comparison of equivalent strain in the direction perpendicular (90��) to the rolling direction is less than 5%. It is concluded that the friction coefficient between the Ti-15-3 alloy and the steel punch with lubrication and deformation is 0.27.
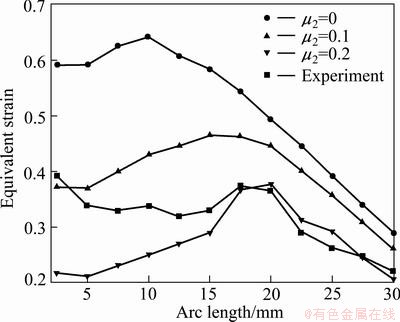
Fig. 9 Comparison of equivalent strain of various friction coefficient between Ti-15-3 alloy and steel punch
3.2 Friction between Ti-15-3 alloy and rubber
Rubber has nonlinear stress��strain characteristics for relatively large deformations in the rubber forming process, generally assumed as isotropic and nearly incompressible. Generally, the Mooney-Rivlin model is used to describe the hyper-elastic behavior. The form uses a strain energy potential U, whose derivative with respect to a strain component determines the corresponding stress component. The form of the Mooney-Rivlin strain energy potential is
 (1)
(1)
where U is the strain energy potential; Jel is the elastic volume ratio; I1 and I2 are the measures of the distortion in the material; N, Cij, and Di are material constants, which may be functions of temperature. Cij determines the material response, and Di introduces compressibility. Commonly, two Mooney-Rivlin parameters (C10 and C01) are used to describe hyper-elastic rubber deformation, which can be determined by experiments [18].
Tensile tests according to GB/T528��2009 and compressive tests were performed on the rubber of Shore 70 A, which is adopted in the later simulations and used to construct the response curves of polynomial models. The results are summarized in Fig. 10. The Mooney- Rivlin form is more accurate in fitting the experimental results. The Mooney-Rivlin parameters C10 and C01 are 0.63 and 1.20, respectively.
A quarter of the tooling and the part were modeled by taking advantage of the symmetry. The rigid tool and the blank were defined same as the simulation of the steel punch bulging process. And C3D8R elements by visco-elastic hourglass control approach were used to the discrete of the rubber pad. Boundary conditions were defined according to actual boundary conditions. There were two different interfaces in the rubber bulging. The penalty function algorithm was utilized to model the friction behavior. The interfaces between the rubber and the metal, including sheet and rigid punch, were modeled using the general contact algorithm while the interface between the rigid punch and the Ti-15-3 alloy sheet using the pure master-slave contact algorithm with a friction coefficient of 0.27.
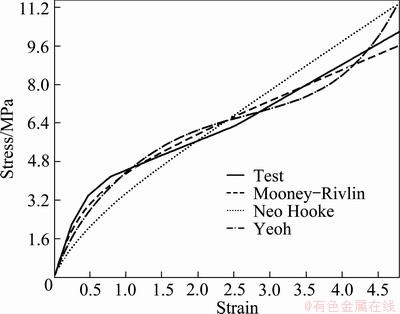
Fig. 10 Comparison of different hyper-elastic models�� stress��strain curves
The friction coefficients between the rubber punch and the metal (��3) were supposed as 0, 0.05, 0.1, 0.15, 0.25, 0.27, which are derived from analyses of bulging experiments. Simulations were performed with the punch advancing up. But simulations could not perform when ��3 was 0, 0.05 or 0.1, owing to the severe distortion of the rubber. Principal strains were extracted and imported into FLD by the same method as in the steel punch bulging analysis shown in Fig. 11, which presents that the strains increase independent on ��3. Furthermore, equivalent strains were extracted and compared between simulation and experiment in the steel punch bulging analysis, as shown in Fig. 12. It can be seen that the distribution is almost equal for ��3=0.15 or 0.25, even 0.27.
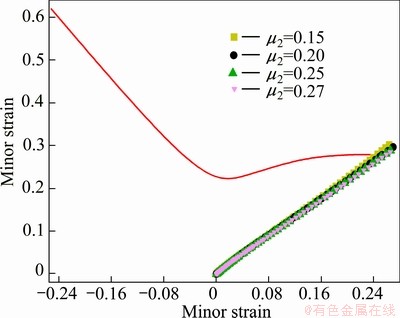
Fig. 11 Stain paths of various friction coefficients between Ti-15-3 alloy and rubber punch
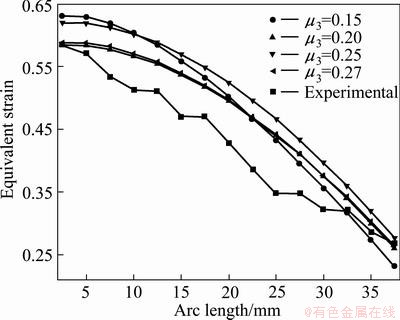
Fig. 12 Comparison of equivalent strain of various friction coefficients between Ti-15-3 alloy and rubber punch
In conclusion, the friction between the rubber punch and the metal is not an important factor, whereas the friction between the rigid punch and the sheet is a main parameter that influences the distribution of the strain. The reason may be that the rubber deforms along with the sheet during the forming process, so the relative motion and the friction influence are much smaller. However, the relative motion at the interface between rigid punch and the sheet is much larger, also the friction force, which makes the sheet flow more difficultly especially when the friction coefficient increases. This is consistent with the previous observation of PENG et al [9].
4 Conclusions
1) The results from steel punch bulging demonstrate that the Ti-15-3 alloy sheet has poor formability under tension-tension condition at room temperature. The major and minor limit strains near to the equi-biaxial tension condition in the rubber bulging of the 180 mm ��180 mm Ti-15-3 alloy sheet.
2) At room temperature, the friction coefficient between the Ti-15-3 alloy sheet and the steel punch with neither lubrication nor deformation is 0.45 and the coefficient between the sheet and the steel punch with lubrication is 0.27 in the forming. The friction coefficient between the sheet and the rubber is supposed as 0.15 in the simulation of the rubber forming process. And the hardness of rubber does not affect the distribution of strain significantly.
3) The friction between the Ti-15-3 alloy sheet and the steel punch has a significant influence on the distribution of the strain while the friction between the sheet and the rubber pad has tiny effect.
References
[1] ISMARRUBIE Z N, AIDY A, SATAKE T, SUGANO M. Influence of microstructures on fatigue damage mechanisms in Ti-15-3 alloy [J]. Material & Design, 2011, 32: 1456-1461.
[2] ZHOU Zhong-bo, FEI Yue, LAI Min-jie, KOU Hong-chao, CHANG Hui, SHANG Guo-qiang, ZHU Zhi-shou, LI Jin-shan, ZHOU Lian. Microstructure and mechanical properties of new �� type titanium alloy [J]. Transactions of Nonferrous Metals Society of China, 2012, 20(12): 2253-2258.
[3] SHAN De-bin, LU Yan, LI Ping, XU Yi. Experimental study on process of cold-power spinning of Ti-15-3 alloy [J]. Journal of Materials Processing Technology, 2001, 115(3): 380-383.
[4] MAZIAR R, MOHD R Z, ROSLAN A. Computer aided modelling of friction in rubber-pad forming process [J]. Journal of Materials Processing Technology, 2009, 209(10): 4925-4934.
[5] GIUSEPPE S. A numerical and experimental approach to optimise sheet stamping technologies: Part II��Aluminium alloys rubber- forming [J]. Materials & Design, 2001, 22: 299-315.
[6] THIRUVARUDCHELVAN S. The potential role of flexible tools in metal forming [J]. Journal of Materials Processing Technology, 2002, 122(2-3): 293-300.
[7] DJAVANROODI F, DEROGAR A. Experimental and numerical evaluation of forming limit diagram for Ti6Al4V titanium and Al6061-T6 aluminum alloys sheets [J]. Materials & Design, 2010, 31: 4866-4875.
[8] WANG Hai-bo, WAN Min, YAN Yu. Effect of flow stress��strain relation on forming limit of 5754O aluminum alloy [J]. Transactions of Nonferrous Metals Society of China, 2012, 22(10): 2370-2378.
[9] PENG Lin-fa, HU Peng, LAI Xin-min, MEI De-qing, NI Jun. Investigation of micro/meso sheet soft punch stamping process��Simulation and experiments [J]. Materials & Design, 2009, 30: 783-790.
[10] MAZIAR R, MOHD R Z, ROSLAN A. Numerical simulation of sheet stamping process using flexible punch [J]. Proceedings of the Institution of Mechanical Engineers, 2009, 223: 829-840.
[11] DIRIKOLU M H, AKDEMIR E. Computer aided modeling of flexible forming process [J]. Journal of Materials Processing Technology, 2004, 148(3): 376-381.
[12] MA Gao-shan, WAN Min, WU Xiang-dong. Forming limit diagram and calculating model for 5A90 Al-Li alloy sheet at elevated temperature [J]. The Chinese Journal of Nonferrous Metals, 2008, 18(4): 717-721. (in Chinese)
[13] PRETE A D, PAPADIA G, MANISI B. Computer aided modelling of rubber pad forming process [J]. Key Engineering Materials, 2011, 473: 637-644.
[14] HECKER S S. Simple technique for determining forming limit curves [J]. Sheet Metal Industries, 1975, 52(11): 671-675.
[15] DIETER G E. Workability testing techniques [M]. American Society for Metals, 1987.
[16] HILL R. The mathematical theory of plasticity [M]. Oxford Press, 1950.
[17] SUN Yong-na, WAN Min, WU Xiang-dong. Inverse identification of material parameters of titanium alloy TB5 based on response surface methodology and quasi-Newton method [J]. Advanced Material Research, 2012, 482-484: 2012-2016.
[18] ABAQUS InC. Abaqus analysis user��s manual [M]. ABAQUS Uersion 6.9 Documentation, 2009.
Ti-15-3�ѺϽ���Ƥ���ε�Ħ������
�����ȣ��� ��������
�������պ����ѧ ��е���̼��Զ���ѧԺ������ 100191
ժ Ҫ��������Ӧ���Զ���������ϵͳ����Ti-15-3�ѺϽ���ϸ�ģ��������ļ���Ӧ�䣬����������Ի�ȡTi-15-3�ѺϽ�ij��μ���ͼ��ͨ��������ģ���Ρ���Ƥ���Ρ�Һѹ���ε�����ġ���-����������Ӧ�䣬��֪��Ƥ���εļ���Ӧ����ӽ���˫��ʱ�ģ���ƤӲ�ȶ����μ���Ӧ���Ӱ���С����ƽ��Ħ���������ȷ��Ti-15-3�ѺϽ����ģ�������ޱ��������µ�Ħ��������������������Ԫģ���ϣ��ֱ����Ti-15-3�ѺϽ��ģ���μ���Ƥ���ε�Ӧ�䣬ȷ����������˫������ʱ��Ti-15-3����-��ģ���Ħ�������Լ�Ti-15-3����-��Ƥ���Ħ��������Ti-15-3����-��ģ���Ħ���Գ���Ӱ��ܴ�Ti-15-3����-��Ƥ���Ħ���Գ��ε�Ӱ�����С��
�ؼ��ʣ�Ti-15-3�Ͻ���Ƥ����; Ħ�������Σ���Ӧ�䣻����Ԫģ��
(Edited by YANG Hua)
Corresponding author: WAN Min; Tel/Fax: +86-10-82338788; E-mail: mwan@buaa.edu.cn
DOI: 10.1016/S1003-6326(11)61551-3
Abstract: The forming limit diagram of Ti-15-3 alloy sheet was constituted at room temperature. The effects of different punch and rubber hardness on the limit principal strain distributions were investigated experimentally. Finite element analysis models of the samples with dimensions of 180 mm��180 mm were established to analyze the friction coefficients of different interfaces. Effects of various friction coefficients on the strain distributions were studied in detail. Finally, the friction coefficients in the cold forming were determined by contrasting the strain results between the experimental data and the simulated ones.
