

J. Cent. South Univ. (2020) 27: 1893-1906
DOI: https://doi.org/10.1007/s11771-020-4418-7

Effect of cushion and cover on moisture distribution in clay embankments in southern China
ZHANG Jun-hui(�ž���)1, LI Feng(���)1, ZENG Ling(����)2,
ZHENG Jian-long(֣����)1, ZHANG An-shun(�Ű�˳)1, ZHANG Yu-qing(��ԣ��)1, 3
1. National Engineering Laboratory of Highway Maintenance Technology, Changsha University of
Science & Technology, Changsha 410114, China;
2. School of Civil Engineering, Changsha University of Science & Technology, Changsha 410114, China;
3. Aston Institute of Materials Research, Engineering Systems and Management Group, Aston University, Birmingham, B4 7ET, UK
 Central South University Press and Springer-Verlag GmbH Germany, part of Springer Nature 2020
Abstract:
To achieve durability of the embankment in southern China, a method to control the change of moisture content with the cushion and cover was proposed. A finite element model of cushion and cover considering different materials and thicknesses for a typical embankment was built, and 20 numerical analyses of transient seepage in the embankment were simulated. The results show that the sand cushion effectively blocks the effect of groundwater capillary rise and the minimum thickness of the sand cushion is 75 cm without considering the atmospheric environment. With the combination of sand cushion and clay cover, as the thickness of the clay cover increases, the duration time of the moisture content from the initial to relative equilibrium state increases, but the equilibrium moisture content is the same as that of the original embankment. Besides, with the combination of the sand cushion and sand cover, the moisture content inside the embankment remains the same, which is consistent with the optimum moisture content during construction. The combination of 75 cm sand cushion and 30 cm sand cover is a very effective method to block groundwater and atmospheric environment, and achieve the control of the humidity stability of the embankment in southern China.
Key words:
numerical simulation; cushion; cover; groundwater; atmosphere environment��
Cite this article as:
ZHANG Jun-hui, LI Feng, ZENG Ling, ZHENG Jian-long, ZHANG An-shun, ZHANG Yu-qing. Effect of cushion and cover on moisture distribution in clay embankments in southern China [J]. Journal of Central South University, 2020, 27(7): 1893-1906.
DOI:https://dx.doi.org/https://doi.org/10.1007/s11771-020-4418-71 Introduction
On site, the construction moisture content of the embankment soil is generally close to the optimum moisture content (OMC) with an error of 2%, which is usually unsaturated [1, 2]. At this time, the matric suction generated inside unsaturated embankment has a good effect on the slope stability, resilient modulus and permanent deformation of the embankment [3-5]. However, the climate in southern China is typically tropical or subtropical, with hot and humid with long rains, showers, thunderstorms and typhoons in summer [6]. Besides, groundwater is buried shallow. The embankment is exposed to the natural environment. The moisture content inside the embankment firstly changes to an equilibrium moisture content (EMC) after several years and then fluctuates around the EMC due to the environmental factors [7, 8]. This will result in performance deterioration of the embankment, such as a loss of the structural resilience, a reduction of the soil shear strength, and a continuous increase of permanent deformation [9, 10]. Therefore, it is very meaningful to study the technologies for delaying or preventing the increase of moisture content in the embankment to achieve the performances of the embankment structure stable.
Everyone should not be extravagant to design a truly impermeable barrier of the embankment, but the engineers could design and build a viable system that can minimizes percolation (each parameter is less than the environmental safety value). It is widely accepted that groundwater and climate environment are two important factors impacting the embankment performances in southern China, mainly due to the capillary rise of groundwater and the infiltration of rainfall [11, 12]. On the one hand, many researchers had conducted in-depth investigations, tests, and applications on the rise of groundwater capillary height and its barrier effect. The smaller the size of the soil above the groundwater was, the higher the upward groundwater migration according to capillary rise action, so the area affected the performances of the embankment was also larger [13]. The different types of soil had different pore distributions because of their particle sizes. And the capillary height of clay is usually lower than that of sand. The control methods of groundwater can be divided into the forms of drainage, precipitation, cut off and recharge. Among them, the cushion is a convenient and effective method. Many column experiments were conducted to study the capillary barrier effect [14, 15]. HELLWIG [16] found that the height of the capillary rise of sand (the average particle size was 0.53 mm) was 60 cm. SHAH et al [17] found the height of the capillary rise of sand and loamy sand was 50 cm, 70 cm, respectively. LIU et al [18] found that the effect of the sand cushion was related to its material properties and thickness. YANG et al [3] found that the sand cushion can effectively enhance the stability of slope because of its strength and drainage.
On the other hand, covers were widely used to control rainfall infiltration into tailings, and waste containment, embankments (e.g., tailing dams and landfills) [19]. Currently, there are two methods. One method is a covering system building a material with a low hydraulic coefficient, such as compacted clays and geo-membrane [20]. The edge covering treatment is the method in which the center of the embankment is filled with the poor quality soil (e.g., expansive soil), while both sides of the embankment are filled with good performance soil (e.g., conventional clay). LIU et al [21] found that the optimal thickness of top sealing and edge sealing soil was about 1.5 m. Another method is the cover with capillary barrier effects. The capillary barrier effects (CBE) utilize the huge difference in the hydraulic performance of the finer-grained and the coarser-grained soils when they are unsaturated to limit the moisture migration in the soil. Many researchers [22, 23] had studied the capillary barrier effect. The infiltration tests on soil columns of the fine-grained soil over the coarse-grained soil were investigated on the blocking effect of the capillary barrier [24-26]. The fine-grained soil and the coarse-grained soil had different particle sizes, forming different pore structures, resulting in the difference of the permeability coefficients and the soil water characteristic curves (SWCCs). It was difficult for water to migrate into the coarse-grained soil, when the matric suction at the interface was less than the breakthrough suction. In a field evaluation on the effectiveness of the capillary barrier in Canada, the flow at the toe of the cover with capillary barrier effects (CCBEs) was less than the maximum seepage rates required by the landfills [11]. The water was temporarily stored in the fine-grained layer and discharged by evaporation and lateral afterward. It was to confirm that the CCBEs is effective because the sum of the evaporation, the lateral discharge, and the water storage capacity was obviously greater than the infiltration [27]. Similarly, a capillary barrier could effectively reduce the infiltration of the rainfall on the slope in a field experiment in Singapore [28]. The matric suction at the interface of the fine-grained and coarse-grained soil during the rain would drop to a value that allows water to migrate into the coarse-grained soil, thus forming some continuous channels.
As mentioned above, many studies [29, 30] had revealed that the sand cushions hinder the capillary rise of the groundwater, and the covers of the low permeability clay or the capillary barrier slow or blocks the infiltration of rainwater. However, few studies reported the combination of the cushion and cover to control moisture rise of the embankment. And it is still unclear which thickness of cushion and cover can achieve the above purpose. Thus, the objective of this paper is to determine the appropriate cushion and cover materials and optimum thicknesses to minimize the increase in moisture content inside the embankment. This study was organized as follows. First, a finite element model of the typical embankment was built, and input parameters including the typical meteorological data in southern China, hydraulic and thermal properties of embankment soils were determined. Then, the effects of the thickness of the sand cushion with clay cover and the sand cushion with sand cover on the moisture content distribution of the embankment were investigated. Finally, the effect of the resilient modulus and the slope stability with the cushion and the cover was analyzed.
2 Numerical simulations
Numerical analyses were performed to investigate the moisture migration and stability of embankment with the combination of cushion and cover of different thicknesses. And the best combination method to keep the moisture stable was found.
2.1 Theoretical formulations
The VADOSE/W module of the Geo-Studio software was used to calculate the moisture content distribution of two soils with different particle sizes. VADOSE/W was a finite element code for analyzing the environmental water (e.g., rainfall, surface water) enter groundwater through the unsaturated soils on the ground and underground, which could simulate the effects of environment, evaporation, surface water, seepage and groundwater on a certain area.
The governing differential equation for water flow could be expressed as:


 (1)
(1)
where �� is the density of the water (kg/m3); Pv is the vapor pressure of the water in soils (kPa); Dv is the diffusion coefficient of the vapor in soil pores (kPa); kx is the hydraulic conductivity in the horizontal direction (m/d); ky is the hydraulic conductivity in the vertical direction (m/d); y was the elevation from the position where the elevation is assumed to be zero (m); P is the pressure (kPa); Q is the water flow of the boundary (m3/d); t is the time (d);.
The heat transfer:

 (2)
(2)
where Lv is the latent heat of water evaporation; ��v is the volumetric specific heat capacity of the soil, ��tx and ��ty are the thermal conductivities of the soil in the horizontal and vertical directions respectively; T is the thermodynamic temperature; Qt is the heat flux of the boundary; ��c is the volumetric specific heat value; Vx and Vy are the water velocity in the horizontal and vertical directions, respectively.
The key to the simulation was that the reasonable boundary conditions are assigned to the model. In this study, Eq. (3) was used to the flow boundary on the surface of slope to quantify actual evaporation (AE) and infiltration [31].
 (3)
(3)
where AE is the flux of the actual vertical evaporation (mm/d); �� is the ratio of the vapor pressure at the saturation to the temperature (kPa/��C); Rn is the sum of net radiation on the surface of the slope (mm/d); �� is the constant of hygrometer and
 (4)
(4)
 (5)
(5)
where f(u) is the function dependent on the speed of the wind, the roughness of the surface, and the eddy diffusion; Ua is the speed of the wind (km/h); Pa is the pressure of the water and the vapor in the air (kPa); B=1/ha is the reciprocal of the relative humidity (ha) in the atmosphere, and A=1/hr is the reciprocal of the relative humidity (hr) on the surface of the embankment.
The boundary condition of the temperature was assigned by the temperature on the surface of the embankment. It passed through the surface since the heat of the embankment enters the environment and the heat of the environment enters the embankment. And it could be estimated using the following equation [11]:
 (6)
(6)
where Ts is the temperature of the surface of the slope (the initial soil temperature is set with the climate at the start of the simulation); Ta is the air temperature on the surface of the slope.
2.2 Geometrical model
Half of the embankment was selected for simulation due to the symmetry of the embankment, as shown in Figure 1. It is divided into 3 layers from top to bottom at the center of the roadbed, such as pavement, embankment, and foundation. The pavement structure on the top was 0.75 m thick and 12.25 m wide asphalt concrete, which is
impervious to water. The middle embankment was 7.0 m high with a slope ratio of 1: 1.5 (vertical: horizontal) and a 0.5 m vegetation. And the bottom foundation had a depth of 4 m. The center of the top of the embankment had a central isolation belt and the outside was provided with a drainage ditch. The central strip and drainage ditch had a good performance. The cushion was arranged at the base of the embankment and the cover was placed under the vegetation layer of the slope. Two sections (cross-sections A-A and B-B) were selected to analyze the moisture distributions. The cross- section A-A and three points (A1-A3) were in the middle of the embankment to reflect the moisture migration with time in different depth and the cross-section B-B and three points (B1-B3) were perpendicular to the slope to reflect the moisture distributions in the depth by the climate effect.
The finite element size was 0.5 m with a total of 1537 nodes and 1575 elements. The evaporation or infiltration was applied as the water flux boundary, and the heat flux of the soil was used as the heat flux boundary on the top and surfaces of the embankment. The remaining boundaries were not assigned (no water and heat flux). The groundwater was located 1 m below the surface of the natural soil, the area below the groundwater level was all saturated.
The validation of the model used in this study was not reported here because it had been reported in another companion paper. The conclusion was that the calculation of the moisture distribution was a good agreement with the measured data.
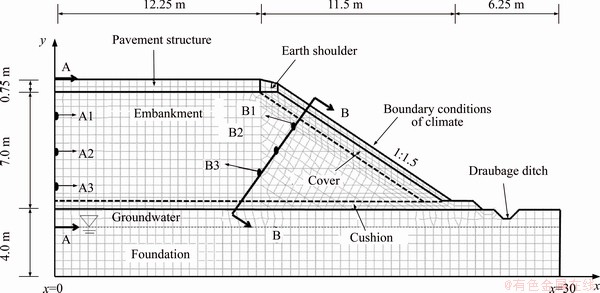
Figure 1 Numerical model dimension of embankment
2.3 Combinations of cushion and cover
To reduce or block the impact of groundwater and atmospheric environment on the moisture content of the embankment, there were three methods including the sand cushion, clay cover and sand cover. Three combinations using sand cushion only, sand cushion with clay cover, and sand cushion with sand cover were examined, as summarized in Table 1.
Table 1 Combinations of soil materials
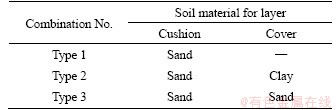
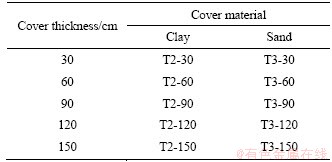
According to previous studies, in this study the maximum thickness of the cushion and the cover is 100 and 150 cm, respectively. In the first series of analyses (T1), only the thickness of the sand cushion was changed. The simulations of 4 different thicknesses (e.g., 25, 50, 75 and 100 cm) of sand cushion were to analyze the effect of the barrier capillary rise, the moisture content and matric suction with time and space distribution were analyzed, and the optimum sand cushion thickness was obtained. In the second series of analyses (T2), 5 thicknesses (e.g., 30, 60, 90, 120 and 150 cm) of clay cover were analyzed in the optimum thickness of the sand cushion. The effect of the clay cover on the moisture content of the embankment was obtained. Similarly, in the third series of analyses (T3), 5 kinds of thickness sand cover were analyzed in the optimum thickness of the sand cushion. The effect of the sand cover on the moisture content of the embankment was obtained. The numerical simulations conducted were summarized in Table 2 and Table 3.
Table 2 Numerical program of sand cushion without and with atmospheric environment
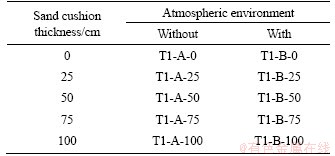
Table 3 Numerical program of optimum sand cushion thickness with various cover thickness
2.4 Materials
It is well known that the rainfall infiltration and evaporation rate of the embankments depend on several factors such as the temperature, the rainfall, the radiative humidity, the speed of the wind, the properties of soil and soil surface. The meteorological parameters were obtained from the meteorological station, and the parameters for hydraulic and thermal properties of soils could be derived through laboratory tests.
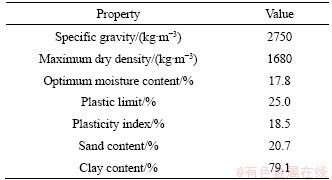
Taking a typical embankment of No. K24+600 of Chang-Zhang expressway in Jiangxi province as an example, the soil specimens were obtained from an undisturbed block sample. Through basic physical experiments, it is determined that the soil is the low liquid limit clay with sand (CLS). Table 4 summarizes some index properties of the soil.
Table 4 Index properties of embankment soil
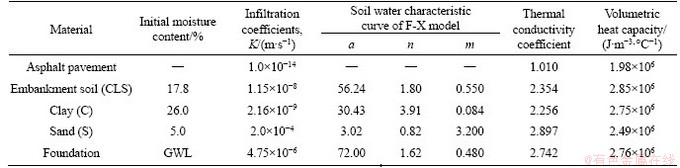
The physical parameters, hydraulic properties, and thermodynamic properties of the materials of asphalt pavement, embankment soil, foundation, clay (C) and sand (S) were gained through laboratory tests and calculations, as shown in Figure 2 and Table 5.
2.5 Boundary conditions
The daily meteorological data of 15 years from the meteorological station in southern China was collected because the design life of asphalt pavement structure is 15 years in the regulation, as shown in Figure 3.
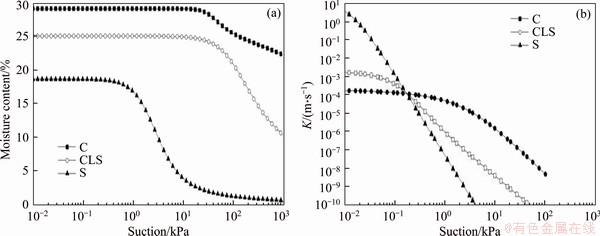
Figure 2 SWCCs (a) and permeability coefficient curve (b) of embankment soil (CLS), clay (C) and sand (S)
Table 5 Physical parameters, hydraulic properties, and thermodynamic properties of materials
3 Determination of material and thickness of cushion and cover
In order to study the effect of the cushion and the cover on the predictions of the moisture distributions in unsaturated embankments, a series of the transient seepage were carried out. And the limit equilibrium analyses were performed using the computed moisture content and matric suction distributions.
3.1 Effect of moisture distribution using sand cushion without considering atmospheric environment
The capillary rise process is illustrated using the sand cushion without considering the atmospheric environment. The moisture content along the cross-section A-A (x=0 m in Figure 1) is shown in Figure 4.
It can be observed from Figure 4(a) that the moisture contents at three points show a large change in amplitude. The moisture contents of the soil at three locations in cross-section A-A all gradually increase with time from optimum moisture content (OMC=17.8%) to an equilibrium moisture content (EMC) after 1 or 2 years. The EMC is 23% for A1, 24% for A2 and 24% for A3. Because the higher the groundwater level is, the greater the matric suction and the smaller the equilibrium moisture content due to gravity. Using 25 cm sand cushion, the moisture content of cross- section A-A changed significantly. The moisture contents of the soil in cross-section A-A remain constant or decrease slightly in the first year and then increase greatly up to reach an equilibrium state after 5 or 7 years. The equilibrium time increased by 4 to 6 years than case T1-A-0. And the EMC of points A1-A3 is the same as that without 25 cm sand cushion. Because the 25 cm sand cushion can effectively slow down but not block the effect of the capillary rise of groundwater.
Figures 4(b)-(d) present the moisture migration at points A1-A3 with the different thickness sand cushion. The moisture content of the embankment with the sand cushion has great effect because the sand cushion can effectively slow down and block the effect of the groundwater capillary rise. The moisture contents at points A1 and A2 rise slowly and that of point A3 drops slightly from the optimal moisture content 18% with sand cushion in the first two years. At the initial moment, all points in the embankment have the same moisture content and matric suction. Because of gravity, the points in different heights have different potential energy and the water in the soil migrates downward before the effects of groundwater. Then, the thickness of the sand cushion has an obvious difference in the process of moisture content rising. The increase rate of moisture content decreases significantly, and the time to reach the equilibrium state is delayed, or even greater than 15 years. Taking point A1 as an example, the EMC is 23% in cases T1-A-25 and T1-A-50, and the moisture content increases to reach an equilibrium state after 6 years (T1-A-25) and 11 years (T1-A-50). In addition, the moisture contents of cases T1-A-75 and T1-A-100 is 19% and 18% (far less than EMC, no difference compared with OMC) after 15 years, respectively. The moisture content becomes smaller as the thickness of the sand cushion increases. It shows that the effect of blocking the groundwater capillary is more obvious as the thickness of the sand cushion increases. The minimum thickness of the barrier groundwater is 75 cm because the moisture contents of the 75 cm and 100 cm sand cushions are nearly the same.
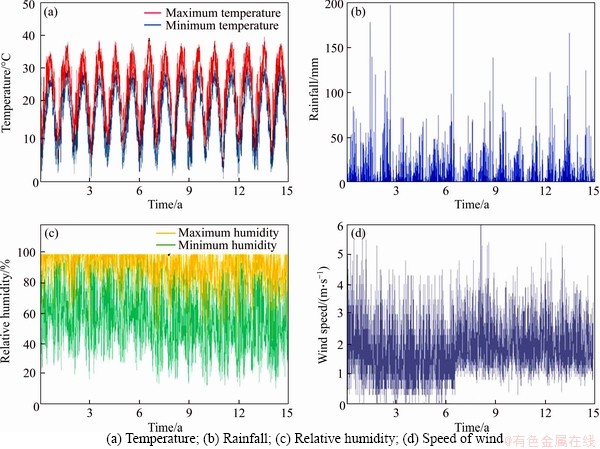
Figure 3 Field meteorological data:
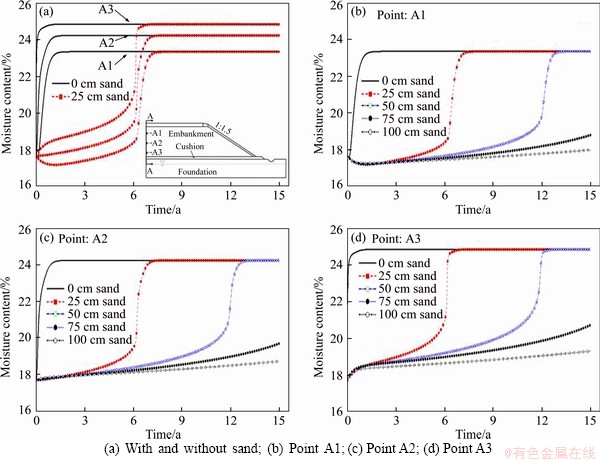
Figure 4 Moisture content over time of different thickness sand cushion:
Similarly, the cloud also shows the effect of using the sand cushion to block the rise of groundwater capillary. Figure 5 shows the cloud of the moisture content of two typical cases (T1-A-0 and T1-A-75) after 15 years. Three contours in the cloud of moisture content in the case T1-A-0 are 23%, 24% and 25% from Figure 5(a). For the the same reason, in Figure 5(b), there are two contours in the case T1-A-75 that are 18% and 19%, respectively. All contours are horizontal and parallel to groundwater, and the value near groundwater is greater than the value far away.
3.2 Effect of moisture distribution using sand cushion considering atmospheric environment
It can be clearly seen from Figure 6(a) that the moisture contents at three points show a large change in amplitude. The moisture contents of the soil at three locations in cross-section A-A all gradually increase with time in the first three years,and then they tend to an equilibrium moisture content or fluctuate around certain moisture contents (23% for A1, 24% for A2 and 25% for A3). The moisture contents of points A1 and A2 drop slightly from the initial 18% with or without sand cushion after 1.5 years, because the water in the soil under gravity acts downwards before the effects of groundwater and atmospheric environment. The moisture content has been in a long-period fluctuation change after 6 years, and the equilibrium moisture content is 23%-25%. Moreover, no matter which thickness of the sand cushion is used, its moisture content is the same as that of the 25 cm sand cushion. Compared with T1-A-50, T1-A-75, T1-A-100, there is a very significant difference in the moisture content of the atmospheric environment. Taking point A1 as an example, the moisture is 23.5% for 25 cm, 23.3% for 50 cm, and 23.2% for 75 cm and 100 cm at the last moment.
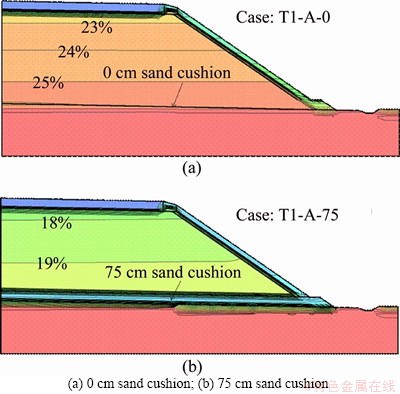
Figure 5 Cloud of moisture distribution in embankment without considering atmospheric environment after 15 years:
Similarly, as shown in Figure 6(b), the matric suctions of cross-section A-A at the initial moment (0 year), the time of the minimum moisture content (after 1.5 years), the moment in the process (after 4 years), and equilibrium moment (after 6 years) are selected, and it also shows the effect of the sand cushion on the groundwater capillary rises. The matric suctions in the soil layers at the initial condition obtained are high (180 kPa). In a short period of time, the matric suction is redistributed along with the height. After 1.5 years, the matric suctions of the cross-section A-A are 10 to 70 kPa without cushion and 140 to 190 kPa with cushion. However, the matric suctions of the cross-section A-A are 10 to 50 kPa with or without cushion after 6 years.
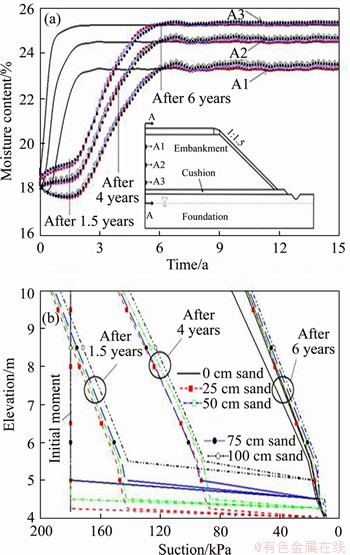
Figure 6 Moisture content over time of three points (a) and matric suction along cross section A-A for different thickness sand cushions (b)
Figure 7 shows the humidity field at the last moment of the 0 cm sand cushion (case T1-B-0) and the 75 cm sand cushion with the atmosphere (case T1-B-75). It can be seen that the difference between the two clouds is small. There are three contours and the values are the same, if the water content less than 1% can be considered the same. The only difference is that the more gradual the contour of case T1-B-0 is, the closer it is to the center of the road. Comparing cases T1-A-75 and T1-B-75, the moisture content in the embankment is substantially increased by 6% due to the atmospheric environment.
Due to the effect of the atmospheric environment, the matric suction of the soil gradually decreases during this period. The effect of using only the cushion to block groundwater capillary action is to change the process of increasing moisture content and reducing the matric suction, but the values at the final equilibrium state are not changed. Therefore, it is very necessary to cover the slope to reduce or block the atmospheric environment.
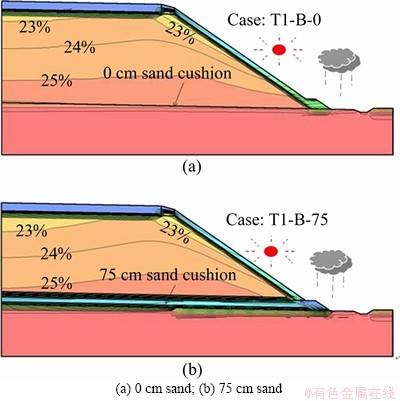
Figure 7 Cloud of moisture distribution in embankment considering atmospheric environment after 15 years:
3.3 Effect of moisture distribution using sand cushion and clay cover
In general, it was used to control the change of the embankment humidity by using the clay cover with the permeability coefficient smaller than the embankment soil. Numerical simulations of the combination of 75 cm sand cushion and 5 thicknesses (such as 30, 60, 90, 120 and 150 cm) for clay cover were performed, and the results were shown in Figure 8.
It can be observed from Figure 8 that the moisture contents at three points on cross-section B-B show a large change in amplitude. As the thickness of clay cover increases, the duration time from the initial to relative equilibrium state is increased from 6 years to 11 years (about 2 times). The rate of the moisture content increasing rises more slowly. The moisture content has been in long-period fluctuation change after 11 years, and the amplitude of variation is smaller because the clay cover reduces the infiltration and evaporation and the impact of climate. And it synthesizes the advantages of both. However, the equilibrium moisture content regardless of the thickness of the clay cover is 23%-24 %. Similarly, it can be seen that there are 5 contours with a moisture content of 20% to 24%, as shown in Figure 9, when the slope of the embankment has been interacted with the atmospheric environment for 15 years. When the slope is applied with the sand cushion and clay cover, the moisture content in the embankment is slightly reduced, and the equipotential line near the slope tends to parallel because the moisture is more difficult to infiltrate and evaporate due to the fact that the clay has a low permeability coefficient. However, the moisture content is consistent with the case T1-B-75, indicating that the 150 cm clay cover does not completely block the atmospheric environment. Therefore, the clay cover for embankment can only reduce the effect of atmospheric environment, but it can not completely block.

Figure 8 Comparison of variation regularity of different thickness clay cover:
3.4 Effect of moisture distribution using sand cushion and sand cover
Numerical simulations of 5 kinds of the thickness (such as 30, 60, 90, 120 and 150 cm) for sand cover and 75 cm sand cushion combination were performed, and the results were shown in Figure 10.
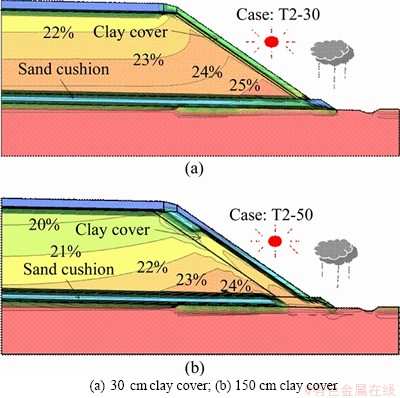
Figure 9 Cloud of moisture distribution using 75 cm sand cushion with clay cover after 15 years:
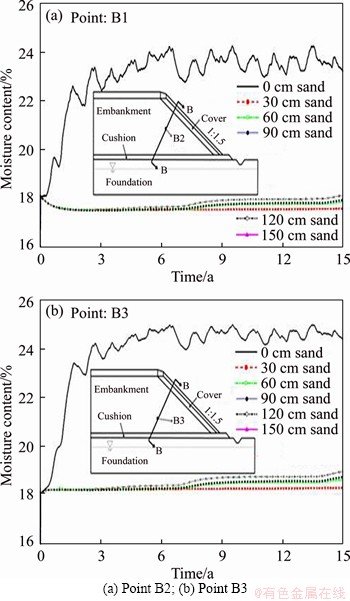
Figure 10 Comparison of variation regularity of different thickness sand cover:
The moisture contents with the sand cover at point B2 and point B3 on cross-section B-B are significantly different from that without sand cover. With sand cover, the moisture contents of point B2 and B3 in the embankment are the same with time. In addition, the two equipotential lines in case T3-30 are 18%-19%. Figure 11 shows the humidity field at the last moment of the 75 cm sand cushion with 30 cm sand cover (case T3-30) and 150 cm sand cover (case T3-150). The humidity field of Figure 11 is significantly different from that of Figure 11(b), which is substantially the same as that of Figure 11(a). This is because the sand cover blocks the atmospheric environment. It is further illustrated that the sand cushion and the sand cover act to block the groundwater and the atmospheric environment. It can be seen from Figure 8(a) that the moisture content without the atmospheric in the embankment is 18%-19%, and the equipotential lines are horizontal, parallel to the groundwater. The value of the equipotential line is equal to the optimum moisture content (OMC). As the thickness of sand cover increases, the difference of the moisture content is also very small.
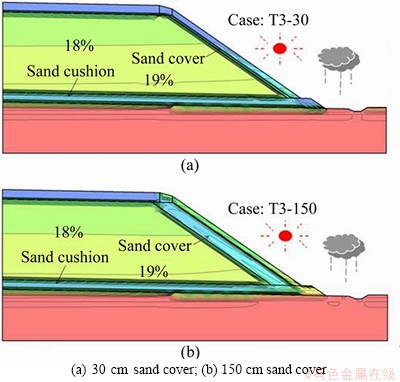
Figure 11 Cloud of moisture distribution using 75 cm sand cushion with sand cover after 15 years:
4 Discussion
Many studies of the previous researchers have shown that the resilient modulus (MR) is related to the moisture content/matric suction, etc. And various forms of the prediction equations of the resilient modulus had be established, many among which reflect the relationship in an exponential form. Taking Eq. (7) as example, it was a prediction model proposed by ZHANG et al [32], which considers the effect of the stress state and the matric suction on resilient modulus.
 ��(7)
��(7)
where pa is the standard atmospheric pressure of 101.3 kPa; �� is the matric suction of the embankment soil; ��m is the minimum bulk stress; ��oct is the shear stress of the octahedron; k0, k1, k2, and k3 are four coefficients.
When the resilient modulus was calculated, various stresses (e.g., ��1 and ��3) can be calculated by the BISAR software, and the matric suction of the corresponding point was obtained. Then, the values of ��m, ��oct, k0, k1, k2 and k3 were calculated. At last, the resilient modulus at point A1 of the embankment was calculated by Eq. (7), as shown in Figure 12(a). The resilient moduli of three cases are different due to the matric suction dependency. The resilient modulus decreases from 89 to 36 MPa for cases T1-B-15 and T2-30, when the matric suction decreases from 180 to 60 kPa. The reduction in the resilient modulus is 60%, and their resilient modulus curves are different because it corresponds to the decreases in matric suction. And the resilient modulus and matric suction of the case T3-30 are 89 MPa, 180 kPa, respectively, which are the same as the initial state. The faster the matric suction dissipates, the greater the resilient modulus decreases. Therefore, it is important to keep the matric suction stable for embankments.
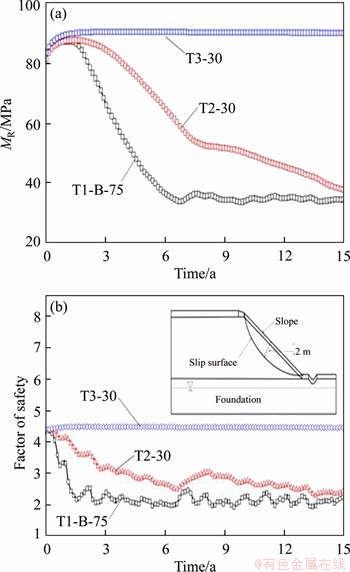
Figure 12 Variation of resilient modulus (a) and factor of safety (b) with time
The factor of safety (FOS) and the most dangerous slip surface are shown in Figure 12(b). It is noted that the FOS values to fluctuate with the variation in the moisture content and they change from 4.5 to 2.0 of cases T1-B-15 and T2-30, and the most dangerous slip surface passes through the bottom of the slope. The FOS of the case T3-30 is 4.5. Therefore, it is essential to keep the moisture content and matric suction stable for the embankments to avoid slope collapses.
The minimum thickness of the sand cover is 30 cm because the sand cover blocks the rain infiltration and evaporation of the environment. Thereby, the modulus of resilience, permanent deformation, shear strength, and expansion force associated with humidity or matric suction inside the embankment will not change greatly. In summary, the embankment with 75 cm sand cushion and 30 cm sand cover can be durable.
5 Conclusions
In order to obtain a method to control the change of moisture content of embankment in southern China, a combination of cushion and cover was proposed. A finite element model of cushion and cover considering different materials and thicknesses for a typical embankment was built, and 20 combined calculations were carried out. The main findings of this study were summarized as follows.
1) Due to the fact that the sand cushion effectively block the effect of groundwater capillary rise, the rates of rising in moisture content and the rate of decrease in matric suction become smaller as the thickness of the sand cushion increases. And the minimum thickness of the sand cushion is 75 cm. The effect of using only the sand cushion is to change the process of increasing moisture content and reducing the matric suction, but the values at the equilibrium state are the same as the original embankment.
2) The clay cover for embankment can only reduce the effect of atmospheric environment, but it can not completely block. The duration time from the initial to relative equilibrium state is increased by 11 years and the amplitude of moisture content variation is smaller as the thickness of clay cover increases. The equilibrium moisture content regardless of the thickness of the clay cover is not changed.
3) The moisture content inside the embankment remains the same, because the sand cover blocks the atmospheric environment. The effect of sand cover thickness in the moisture content is very small, and the minimum thickness of the sand cover is 30 cm.
4) The combination of the sand cushion with the sand cover is a very effective method to control the humidity stability of the embankment in southern China. The optimum thickness of the sand cushion and the sand cover is 75 and 30 cm, respectively.
References
[1] ZHANG J H, DING L, LI F, PENG J H. Recycled aggregates from construction and demolition wastes as alternative filling materials for highway subgrades in China [J]. Journal of Cleaner Production, 2020, 255: 120223. DOI: 10.1016/j.jclepro.2020. 120223.
[2] PENG J H, ZHANG J H, LI J, YAO Y S, ZHANG A S. Modeling humidity and stress-dependent subgrade soils in flexible pavements [J]. Computers and Geotechnics, 2020, 120: 103413. DOI: 10.1016/j.compgeo.2019.103413.
[3] YANG K H, THUO J N A A, HUYNH V D A, NGUYEN T S, PORTELINHA F H M. Numerical evaluation of reinforced slopes with various backfill-reinforcement- drainage systems subject to rainfall infiltration [J]. Computers and Geotechnics, 2018, 96: 25-39. DOI: 10.1016/j.compgeo.2017.10.012.
[4] VAHEDIFARD F, MORTEZAEI K, LESHCHINSKY B A, LESHCHINSKY D, LU N. Role of suction stress on service state behavior of geosynthetic-reinforced soil structures [J]. Transportation Geotechnics, 2016, 8: 45-56. DOI: 10.1016/ j.trgeo.2016.02.002.
[5] ZENG L, XIAO L Y, ZHANG J H, FU H Y. The role of nanotechnology in subgrade and pavement engineering: A review [J]. Journal of Nanoscience and Nanotechnology, 2020, 20: 4607-4618. DOI: 10.1166/jnn.2020.18491.
[6] LI J H, DU L, CHEN R, ZHANG L M. Numerical investigation of the performance of covers with capillary barrier effects in South China [J]. Computers and Geotechnics, 2013, 48: 304-315. DOI: 10.1016/j.compgeo. 2012.08.008.
[7] YAO Y S, ZHENG J L, CHEN Z S, ZHANG J H, LI Y. Field measurements and numerical simulations of temperature and moisture in highway engineering using a frequency domain reflectometry sensor [J]. Sensors, 2016, 16(6): 857. DOI: 10.3390/s16060857.
[8] HATAMI K, ESMAILI D, CHAN E C, MILLER G A. Moisture reduction factors for shear strength of unsaturated reinforced embankments [J]. International Journal of Geomechanics, 2016, 16(6): D4016001. DOI:��10.1061/ (ASCE)GM. 1943-5622.0000624.
[9] ZHANG J H, PENG J H, ZHANG A S, LI J. Prediction of permanent deformation for subgrade soils under traffic loading in southern China [J]. International Journal of Pavement Engineering, 2020. DOI: 10.1080/10298436. 2020.1765244.
[10] ZHANG J H, PENG J H, ZENG L, LI J, LI F. Rapid estimation of resilient modulus of subgrade soils using performance-related soil properties [J]. International Journal of Pavement Engineering, 2019. DOI: 10.1080/10298436. 2019.1643022.
[11] ABUHAJAR O, EL NAGGAR H, NEWSON T. Numerical modeling of soil and surface foundation pressure effects on buried box culvert behavior [J]. Journal of Geotechnical and Geoenvironmental Engineering, 2016, 142(12): 04016072. DOI: 10.1061/(ASCE)GT.1943-5606.0001567.
[12] WEI H W, WU Y Z, YU Z H. Design parameter optimization of beam foundation on soft soil layer with nonlinear finite element [J]. Journal of Central South University, 2012, 19(6): 1753-1763. DOI: 10.1007/s11771-012-1202-3.
[13] GASMO J M, RAHARDJO H, LEONG E C. Infiltration effects on stability of a residual soil slope [J]. Computers and Geotechnics, 2000, 26(2): 145-165. DOI: 10.1016/s0266- 352x(99)00035-x.
[14] LIU Z, YU X, WAN L. Capillary rise method for the measurement of the contact angle of soils [J]. Acta Geotechnica, 2016, 11(1): 21-35. DOI: 10.1007/s11440- 014-0352-x.
[15] YAN C G, WAN Q, XU Y, XIE Y L, YIN P J. Experimental study of barrier effect on moisture movement and mechanical behaviors of loess soil [J]. Engineering Geology, 2018, 240: 1-9. DOI: 10.1016/j.enggeo.2018.04.007.
[16] HELLWIG D H R. Evaporation of water from sand: 4. The influence of thedepth of the water-table and the particle size distribution of the sand [J]. Journal of Hydrology, 1973, 18(3, 4): 317-327. DOI: 10.1016/0022-1694(73)90055-3.
[17] SHAH N, NACHABE M, ROSS M. Extinction depth and evapotranspiration from ground water under selected land covers [J]. Ground Water, 2007, 45(3): 329-338. DOI: 10.1111/ j.1745-6584.2007.00302.x.
[18] LIU J, YAO H L, CHEN P, LU Z, LUO X W. Theoretical analysis and experimental study of subgrade moisture variation and underground antidrainage technique under groundwater fluctuations [J]. Journal of Applied Mathematics, 2013(5): 703251. DOI: 10.1155/2013/703251.
[19] ZHANG L M, KE Y Q. Combinations of soil materials for granular capillary barriers for minimizing rainfall infiltration and gas emission [J]. Canadian Geotechnical Journal, 2017, 54(11): 1580-1591. DOI: 10.1139/cgj-2016-0334.
[20] LEWIS T W, PIVONKA P, FITYUS S G, SMITH D W. Parametric sensitivity analysis of coupled mechanical consolidation and contaminant transport through clay barriers [J]. Computers and Geotechnics, 2009, 36(1): 31-40. DOI: 10.1016/j.compgeo.2008.04.003.
[21] LIU X, SHENG K, HUA J H, HONG B N, ZHU J J. Utilization of high liquid limit soil as subgrade materials with pack-and-cover method in road embankment construction [J]. International Journal of Civil Engineering, 2015, 13(3b): 167-174. DOI: 10.1002/9783527621866.ch5.
[22] GEE G W, WARD A L, MEYER P D. Method to estimate water storage capacity of capillary barriers [J]. Journal of Geotechnical and Geoenvironmental Engineering, 1998, 125(10): 297-302. DOI: 10.1061/(asce)1090-0241(1998) 124:4(297).
[23] NICHOLSON R V, GILLHAM R W, CHERRY J A, REARDON E J. Reduction of acid generation in mine tailings through the use of moisture-retaining cover layers as oxygen barriers [J]. Canadian Geotechnical Journal, 1989, 27(3): 402-403. DOI: 10.1139/t90-052.
[24] LAI J X, LIU H Q, QIU J L, CHEN J X. Settlement analysis of saturated tailings dam treated by CFG pile composite foundation [J]. Advances in Materials Science and Engineering, 2016: 7383762. DOI: 10.1155/2016/7383762.
[25] ZHANG W J, SUN C, QIU Q W. Characterizing of a capillary barrier evapotranspirative cover under high precipitation conditions [J]. Environmental Earth Sciences, 2016, 75(6): 513. DOI: 10.1007/s12665-015-5214-9.
[26] YANG H, RAHARDJO H, LEONG E C, FREDLUND D G. A study of infiltration on three sand capillary barriers [J]. Canadian Geotechnical Journal, 2004, 41(4): 629-643. DOI: 10.1139/t04-021.
[27] HARNAS F R, RAHARDJO H, LEONG E C, WANG J Y. Experimental study on dual capillary barrier using recycled asphalt pavement materials [J]. Canadian Geotechnical Journal, 2014, 51(10): 1165-1177. DOI: 10.1139/cgj- 2013-0432.
[28] COLEMAN J D, RUSSAM K. The effect of climatic factors on subgrade moisture conditions [J]. G��otechnique, 1961, 11(1): 22-28. DOI: 10.1680/geot.1961.11.1.22.
[29] CHANDLER N, PALSON J, BURNS T. Capillary rise experiment to assess effectiveness of an enzyme soil stabilizer [J]. Canadian Geotechnical Journal, 2017, 54(10): 1509-1517. DOI: 10.1139/cgj-2016-0511.
[30] PREDELUS D, COUTINHO A P, LASSABATERE L, BIEN L B, WINIARSKI T, ANGULO-JARAMILLO R. Combined effect of capillary barrier and layered slope on water, solute and nanoparticle transfer in an unsaturated soil at lysimeter scale [J]. Journal of Contaminant Hydrology, 2015, 181: 69-81. DOI: 10.1016/j.jconhyd.2015.06.008.
[31] BRADSHAW S L, BENSON C H, SCALIA J. Hydration and cation exchange during subgrade hydration and effect on hydraulic conductivity of geosynthetic clay liners [J]. Journal of Geotechnical and Geoenvironmental Engineering, 2013, 139(4): 526-538. DOI: 10.1061/(ASCE)GT.1943-5606. 0000793.
[32] ZHANG J H, PENG J H, LIU W Z, LU W H. Predicting resilient modulus of fine-grained subgrade soils considering relative compaction and matric suction [J]. Road Materials and Pavement Design, 2019: 1-13. DOI: 10.1080/ 14680629.2019.1651756.
(Edited by HE Yun-bin)
���ĵ���
���Ͱ��������й��Ϸ��������·��ʪ�ȷֲ���Ӱ���о�
ժҪ��Ϊ��ʵ���й��Ϸ�����·�̵��;��ԣ������һ�����õ��Ͱ��߿���·�̺�ˮ�ʱ仯�ķ�����ѡȡ����·�̽ṹ������һ�ֿ��Dz�ͬ���ϡ���ͬ��ȵĵ��Ͱ��ߵ�����Ԫ����ģ�ͣ�����չ��20��˲̬����ģ�⡣����������ڲ����Ǵ�������Ӱ���ǰ���£�ɰ�����Ч������˵���ˮëϸ������Ӱ�죬����С���Ϊ75 cm�����Ǵ�����������ɰ����������ߵ���ϣ����Ű��ߺ�ȵ����ӣ���ˮ�ʴӳ�ʼ״̬�����ƽ��״̬��ʱ���ӳ�����ƽ�⺬ˮ����ԭ·�̵���ͬ�����⣬���ɰ����ɰ���ߣ�·���ڲ��ĺ�ˮ�ʻ������䣬����Ѻ�ˮ��һ�¡�ͨ���ȽϷ�����75 cmɰ����30 cmɰ���ߵ���ϣ�������Ч����ֹ����ˮ�ʹ�������Ӱ�죬��һ�ֿ����Ϸ����·��ʪ���ȶ��Ե���Ч������
�ؼ��ʣ���ֵģ�⣻��㣻���ߣ�����ˮ����������
Foundation item: Project(2017YFC0805307) supported by the National Key Research and Development Program of China; Projects(51838001, 51878070, 51878078, 51911530215, 51927814) supported by the National Natural Science Foundation of China; Project(2018JJ1026) supported by the Excellent Youth Foundation of Natural Science Foundation of Hunan Province, China; Project(17A008) supported by the Key Project of Education Department of Hunan Province, China; Projects(kfj150103, kfj170106) supported by the Changsha University of Science & Technology via Key Project of Open Research Fund of National Engineering Laboratory of Highway Maintenance Technology, China; Project(kfj170404) supported by the Open Fund of Engineering Research Center of Catastrophic Prophylaxis and Treatment of Road and Traffic Safety of Ministry of Education (Changsha University of Science & Technology), China; Project(CX2018B527) supported by the Hunan Provincial Innovation Foundation for Postgraduate, China; Project(2018-025) supported by the Training Program for High-level Technical Personnel in Transportation Industry, China
Received date: 2020-04-23; Accepted date: 2020-06-15
Corresponding author: ZENG Ling, PhD, Associate Professor; Tel: +86-15386457467; E-mail: zl001@csust.edu.cn; ORCID: 0000- 0001-8167-1049
Abstract: To achieve durability of the embankment in southern China, a method to control the change of moisture content with the cushion and cover was proposed. A finite element model of cushion and cover considering different materials and thicknesses for a typical embankment was built, and 20 numerical analyses of transient seepage in the embankment were simulated. The results show that the sand cushion effectively blocks the effect of groundwater capillary rise and the minimum thickness of the sand cushion is 75 cm without considering the atmospheric environment. With the combination of sand cushion and clay cover, as the thickness of the clay cover increases, the duration time of the moisture content from the initial to relative equilibrium state increases, but the equilibrium moisture content is the same as that of the original embankment. Besides, with the combination of the sand cushion and sand cover, the moisture content inside the embankment remains the same, which is consistent with the optimum moisture content during construction. The combination of 75 cm sand cushion and 30 cm sand cover is a very effective method to block groundwater and atmospheric environment, and achieve the control of the humidity stability of the embankment in southern China.
