

Identification of nucleation parameter for cellular automaton model of dynamic recrystallization
JIN Zhao-yang(����)1, 2, LIU Juan(�� ��)1, CUI Zhen-shan(����ɽ)1, WEI Dong-lai(Τ����)1
1. National Die and Mold CAD Engineering Research Center,Shanghai Jiao Tong University, Shanghai 200030, China;
2. School of Mechanical Engineering, Yangzhou University, Yangzhou 225001, China
Received 19 December 2008; accepted 26 May 2009
Abstract:
The accuracy of nucleation parameter is a critical factor in the simulation of microstructural evolution during dynamic recrystallization (DRX). Based on the flow stress curve under hot deformation conditions, a new approach is proposed to identify the nucleation parameter during DRX. In this approach, a cellular automaton (CA) model is applied to quantitatively simulate the microstructural evolution and flow stress during hot deformation; and adaptive response surface method (ARSM) is applied as optimization model to provide input parameters to CA model and evaluate the outputs of the latter. By taking an oxygen-free high-conductivity (OFHC) copper as an example, the good agreement between the simulation results and the experimental observations demonstrates the availability of the proposed method.
Key words:
dynamic recrystallization; cellular automaton method; response surface method; nucleation rate; parameter identification;
Dynamic recrystallization (DRX) is an important metallurgical phenomenon during high temperature plastic deformation, which is able to change the microstructure of metallic materials, and influence their mechanical properties. Although the traditional model of DRX, i.e. the phenomenological or semi-empirical model based on the experimentation, can build the relationship between grain sizes and deformation parameters, it is not able to reveal the complex physical mechanism during hot working[1]. In recent years, a Monte Carlo (MC) method has been used to dynamically simulate the nucleation and the grain growth during DRX[2-5]. However, its application is limited due to the deficiency that the time step used in MC simulation is difficult to map to real time. Since the Cellular Automaton (CA) method was introduced to DRX by GOETZ and SEETHARAMAN[6], it has been successfully applied to simulate the microstructural evolution of various metals such as pure copper[7-8], titanium alloys[9] and steel[10-11]. In contrast with the MC method, the CA method is able to quantitatively consider the effect of deformation stored energy on growth kinetics of each recrystallized grain (R-grain) and build the relation with the actual deformation parameters. Therefore, it allows accurate predictions of the microstructural evolution and flow stress behavior under various hot working conditions.
The nucleation rate is a key factor affecting the microstructural evolution during DRX. However, it is difficult to accurately determine the nucleation rate through theoretical or experimental means, due to the complexity of DRX process and the limitation of experimental measures[12-13]. At present, the backcalculated method is mainly used to evaluate the value of nucleation rate from the measurements of the percentage of DRX and the mean size of R-grain[7]. However, in real sample, the recrystallization softening takes place concurrently with the work-hardening during DRX so that the R-grain is hardly to be accurately discriminated from deformed matrix, which leads to inaccuracy of so-determined nucleation rate. To improve the simulation performance, RANE et al[13] proposed a genetic algorithm coupled with CA method to evaluate the nucleation rate during static recrystallization (SRX).
Considering that the intrinsic information of DRX like grain nucleation and growth is embedded in the material flow stress during hot deformation, a new method is proposed to identify the nucleation rate. In the method, the CA model, as a main part, is applied to quantitatively simulate the material microstructural evolution and the flow stress under hot working condition, and an optimization model based on adaptive response surface method (ARSM) is applied as an additional part to provide input parameters to CA model and evaluate the output of the latter. The reason to adopt an ARSM model is to reduce the computational time in optimization since CA modeling of DRX is usually a computation-intensive problem. According to the physical metallurgical principles, when the difference between the simulated stress��strain curve and the experimental data is minimized, the identified value of nucleation parameter and the microstructural evolution can reasonably reproduce the evolution in the real sample. By using the proposed method, the hot deformation behavior of an oxygen-free high- conductivity (OFHC) copper is simulated.
2 CA model of DRX
Similar to the model proposed by DING and GUO[7], three assumptions are employed:
1) The dislocation density increases with strain in both primary grains and R-grains, and DRX will occur when the dislocation density exceeds the critical value.
2 During DRX, nucleation only takes place on grain boundaries (including primary grain boundaries and R-grain boundaries).
3) The heterogeneity of grain boundary mobility is neglected.
2.1 Theoretical model of DRX
2.1.1 Modeling of dislocation evolution
The dislocation evolution model describes the effect of work hardening and dynamic recovery on dislocation density. For both primary grains and R-grains, the variation of dislocation density is calculated by the model proposed by MECKING and KOCKS[14]:
![]() (1)
(1)
where k1 and k2 are the parameters representing work hardening and dynamic recovery, respectively.
The flow stress �� is typically calculated from the mean value of dislocation density ![]() [15]:
[15]:
![]() (2)
(2)
where �� is a dislocation interaction term which equals 0.5-1.0 for most metals; �� is the shear modulus; and b is the magnitude of the Burgers vector.
Substituting Eq.(1) into Eq.(2) yields:
![]() (4)
(4)
![]() (5)
(5)
where �� is the parameter associated with the work hardening, ��s is the saturated stress representing the balance between work hardening and dynamic recovery. According to Eqs.(3)-(5), k1 and k2 can be determined from experimental stress��strain data.
As deformation continues, new strain-free nuclei will form on grain boundaries when the dislocation density in material exceeds a critical value. Driven by the difference of stored energy between the deformed matrix and R-grains, the newly formed R-grains will grow by expanding into their surrounding deformed matrix. The grain boundary migration rate vi of the ith R-grain can be calculated from the grain boundary mobility m and the driving force per unit area fi[16]:
![]() (6)
(6)
![]() (7)
(7)
![]() (8)
(8)
![]() (9)
(9)
where �� is the characteristic thickness of grain boundary; D0,b is the boundary self-diffusion coefficient; k is the Boltzmann��s constant; Qb is the boundary diffusion activation energy; ��=0.5��b2, represents the dislocation line energy; ��rex,i and ��m,i represent the dislocation density of the ith R-grain and that of its surrounding unrecrystallized matrix, respectively; di is the size of R-grain; ��i is the boundary energy; ��i is the grain boundary misorientation; and ��m and ��m are the boundary energy and the misorientation for a high angle boundary, respectively.
2.2 Cellular automaton method
The CA method deals with an array of cell, the evolution of which is characterized by the state of cell that can be determined by the neighborhood and transformation rule. In order to simulate the DRX behavior of metallic material, the simulation space is discretized into an array of equally shaped quadratic cells of 200��200 sites under the periodic boundary conditions. The size of each lattice site is 2 ��m��2 ��m, and the simulation lattice represents 400 ��m��400 ��m in the real sample. Each lattice site has four state variables: 1) a dislocation density variable that describes the deformation stored energy, 2) an orientation variable, which is a random integer in the range of 1-180 and is used to evaluate the grain boundary energy, 3) a recrystallization number variable that denotes the cycles of recrystallization occurring in the area of cell and is represented by an integer in the range of 0-N, where 0 represents the unrecrystallized matrix, and 4) a grain label variable that represents different grains and is given by a positive integer in the range of 0-M.
The initial microstructure is produced by the site-saturated nucleation, i.e., a predefined number of nuclei are randomly generated at the beginning and no more nuclei are generated in the following time step. The dislocation density of each initial grain is set to the 1010 m-2 which is close to the value in annealed materials. The label of grain is initially set to 0, and added by 1 each time when new different grain emerges. With progressing deformation, the variation of dislocation density can be calculated by using Eq.(1). When the dislocation density exceeds the critical value ��c for nucleation of DRX, new nuclei form on grain boundaries. For two-dimensional cellular automaton, a nucleation rate I is defined, on the unit length of grain boundary where �ѣ���c, as the number of new nuclei generated per unit time. For each cell along boundary where dislocation density exceeds a critical value, its nucleation probability PN in the time step ��t is given by
![]() (10)
(10)
where NCA=1/LCA, is the number of cells along per unit length of boundary; and LCA is the cell length. For each newly formed R-grain, its initial dislocation density is again set to be 1010 m-2. For the cell that is occupied by the R-grain, the number of recrystallization is added by 1 from its original value; at the same time, the labeling of grain is also added by 1 from its maximum value. The driving force of grain growth is provided by the difference of stored energy that exists in R-grains and their surrounding deformation matrix. For the ith R-grain, the growth velocity can be calculated from Eqs.(6)-(9) through each cell on its boundary where the boundary energy is evaluated through the maximum misorientation when the cell is surrounded by two or more differently-oriented cells. In order to simulate equiaxial grain growth, von Neumann neighborhood and a probabilistic transformation rule are utilized. Based on the studies on the scale of CA time step in the probabilistic cellular automaton model[17-18], the transformation probability PG can be expressed as
![]() (11)
(11)
To ensure that both PN and PG are less than 1, an upper limit of ��t has to be set. The simulation tests show that there always exists I/NCA���� 1 in Eq.(10). Therefore, the upper limit of ��t can be defined as the ratio of the cell size LCA to the maximum growth velocity vmax[19]:
![]() (12)
(12)
As the deformation continues, the nucleation and grain growth can take place on grain boundaries as long as its dislocation density exceeds the critical value no matter it belongs to unrecrystallized grain or R-grain.
In the CA model, the strain increment and instantaneous strain can be obtained for a given time step ��t and strain rate. Therefore, the evolution of grain size and percentages of DRX, as well as the flow stress with strain can be obtained by simulating the nucleation and grain growth behavior at each time increment.
3 Identification of nucleation parameter
As previously mentioned, it is difficult to accurately estimate the nucleation rate due to the complexity of DRX and limitation of experiments. However, the nucleation rate is critical to the DRX behavior and the latter is a dominant factor to the material macroscopic flow stress curve. Hence, it can be expected to identify the nucleation rate by comparison of the simulated strain��stress curve and the measured one. Hereby, the identification of nucleation rate is to determine the appropriate value so that the difference between the simulated and measured flow stress curves can be minimized. In fact, it is a problem of optimization and the optimization objective can be defined as
 (13)
(13)
where ��iexp and ��ical(x) are, respectively, measured and calculated flow stresses at the strains ��i (i=1, ��, q); q is the number of sample points on the stress��strain curve; and x is the supposed nucleation parameter I which is to be identified.
To reduce the computational cost and obtain the global optimum of nucleation rate, an adaptive response surface method (ARSM)[20-21] is applied. This idea comes from the fact that the ARSM as an approximate model can re-construct response surface model automatically on the gradually reduced design space, so as to iteratively improve the model precision and approach to the global optimum. By taking Latin Hypercube Design (LHD) as the sampling method of nucleation rate, the flow stress is simulated by CA model at the sample points and the response surface model is constructed through least square method. The flow chart of the identification procedure which combines the CA model and ARSM-based optimization is shown in Fig.1, and the procedure is implemented as follows:
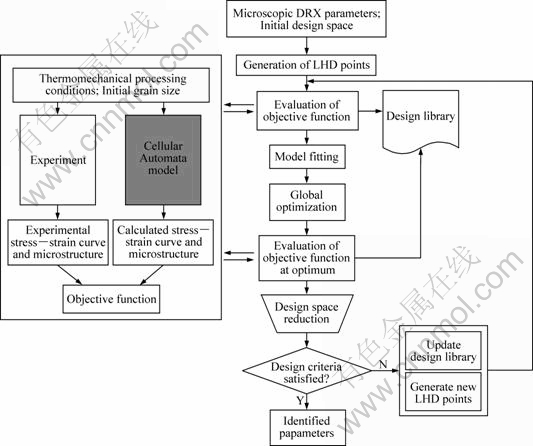
Fig.1 Flow chart of new method by coupling CA and ARSM
1) Predefining an initial searching range of the nucleation rate and generating the LHD sample points in this range.
2) Calculating the flow stress curve by running CA model at each sampling point, and then evaluating the simulation accuracy through Eq.(13) and storing it in the design library.
3) Constructing the response surface model by least square regression:
![]() (14)
(14)
where y is the response; x is the boundary nucleation rate I; and ��0, ��1 and ��2 are regression coefficients.
4) Searching for the optimum on the response surface model and evaluating the actual response at the optimum and then storing it in the design library.
5) Reducing the searching range by defining the threshold value. Here, the threshold value, y0, is taken as the average value of maximum and minimum responses written in the design library, and the reduced searching range is obtained by solving the following equation:
![]() (15)
(15)
The roots, x1 and x2, determine the reduced range as [min{x1, x2}, max{x1, x2}] for subsequential searching.
6) Stopping iteration and outputting the identified nucleation rate when one of the following criterions is satisfied:
(1) The mean error of the simulated flow stress is less than 0.001, i.e., ![]() .
.
(2) The span of the range of boundary nucleation rate I is less than 50, which means the accuracy of PN is of the order of 10-5.
7) Otherwise, updating the design library by inheriting those LHD points falling in the new reduced space for re-construction of RSM in the next iteration. Then, generating new LHD points and returning to step 2).
4 Validation and discussion
By taking an oxygen-free high-conductivity (OFHC) copper as an example, the microstructural evolution and the flow stress behavior during DRX at the temperature of 775 K and the strain rate of 0.002 s-1 is simulated, and the experimental data under the same deformation condition are obtained from Ref.[22]. The values of material constants for the simulation are listed in Table 1. The values of k1 and k2 are determined through least square method by using the experimental stress��strain data prior to the initiation of DRX. From the plot of d��/d�� versus �� shown in Fig.2, the approximate values of �� and ��s can be obtained by linear regression method (Eq.(3)). Then, from Eqs.(4) and (5), the values of k1 and k2 are 3.94��108 and 20.904, respectively. For the boundary nucleation rate I, the initial range is designated as [5, 5 000]. Since there are three unknown coefficients in the respond surface model (Eq.(14)), the number of LHD sampling points must be larger than or equal to 3 and it is taken as 6 in this work. After six times of re-construction of response surface model, the identified value of I is 655. The simulated results are compared with the experimental measurements.
Table 1 Values of material parameters used in simulations[7]
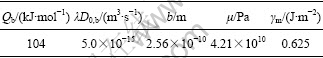
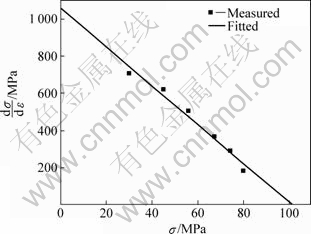
Fig.2 Curve of d��?/d�š��� of OFHC coper to determine �� and ��s
In Fig.3, the simulated stress��strain curve is compared with the measured one. The simulated flow stress is calculated from the mean value of dislocation density on the simulation lattice at each time step (Eq.(2)). The average relative error of the simulated flow stress curve is about 3.62%, which is less than that in Ref.[7]; while in the latter work, the nucleation rate is obtained from the experimentally backcalculated method. This indicates that the simulation precision is improved by the proposed method. The reason for the deviation may be attributed to such factors as the model assumptions, the grain deformation, the intragranular nucleation and the heterogeneously distributed dislocation density, which influence the DRX process in practice. Here, they are not considered in the simulation in order to compare the results simulated by the proposed method with those obtained in Ref.[7] under the similar simulation condition.
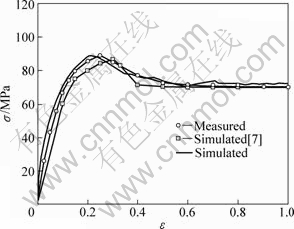
Fig.3 Comparison of simulated and measured stress��strain curves of OFHC copper
Fig.4 shows the simulated microstructure at different strains, where white areas represent the primary grains and other areas represent the R-grains. The mean grain size of simulated initial microstructure is 81 ��m, which is close to the measured one of 78 ��m. As usually observed in experiment, R-grains form randomly along primary boundaries and the microstructure is characterized by necklace morphology at the onset of DRX. With progressing deformation, the primary grains are gradually consumed and covered by R-grains.
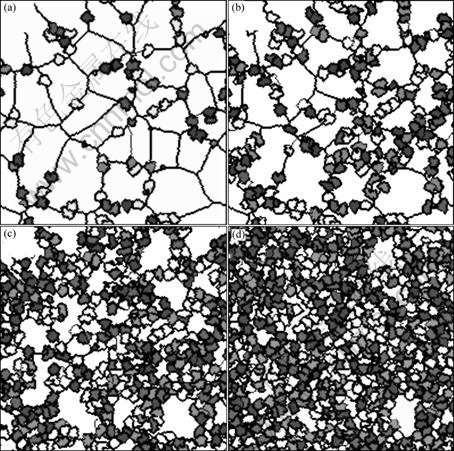
Fig.4 Simulated microstructural evolution of OFHC copper at different strains: (a) 0.25; (b) 0.35; (c) 0.45; (d) 0.55
The evolution of the average grain size with strain is shown in Fig.5. When the strain reaches the critical value, DRX occurs so that the average grain size davg reduces rapidly. As the strain increases, the dropping rate of davg reduces gradually. When strain is about 0.6, the mean grain size approaches its steady value of 11.8 ��m, which is close to the measured value of 14 ��m[22].
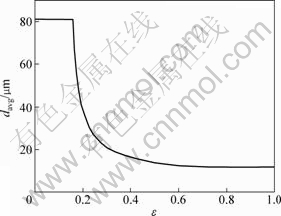
Fig.5 Dependence of average grain size on strain of OFHC copper
Fig.6 compares the simulated percentage of DRX with measured one, where the simulated percentage of DRX is calculated by the ratio of the number of recrystallized cells to the total number of cells. It can be seen that the DRX occurs when the strain exceeds its critical value and the simulated curve has a characteristic sigmoidal shape. It can also be seen that the percentage of DRX simulated by the proposed method shows better agreement with the experiments compared with the simulated one in Ref.[7].
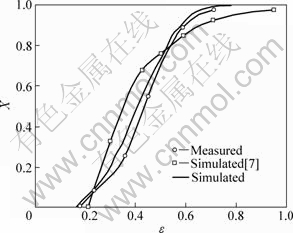
Fig.6 Comparison of simulated percentage of DRX and measured one for OFHC copper
It is noted that the boundary nucleation rate in the CA model is defined on the grain boundary where �ѣ���c. However, the length of the boundary where �ѣ���c varies with strain due to the nucleation and grain growth during DRX. Therefore, the boundary nucleation rate cannot efficiently represent the number of new grains formed per unit time on the simulation lattice. Here, a volume nucleation rate,![]() is defined to represent the number of nuclei formed per unit time and unit volume. According to the stereological principium, an 2D area nucleation rate,
is defined to represent the number of nuclei formed per unit time and unit volume. According to the stereological principium, an 2D area nucleation rate,![]() , obtained from CA model can be used to equivalently represent the 3D volume nucleation rate, and its value can reasonably reflect the softening effect of recrystallization. Fig.7 shows the strain dependence of
, obtained from CA model can be used to equivalently represent the 3D volume nucleation rate, and its value can reasonably reflect the softening effect of recrystallization. Fig.7 shows the strain dependence of ![]() , from which an irregular fluctuation is exhibited. The reason of the fluctuation is that the nucleation takes place randomly and the length of the boundary where �ѣ���c changes with strain nonlinearly. Besides that,
, from which an irregular fluctuation is exhibited. The reason of the fluctuation is that the nucleation takes place randomly and the length of the boundary where �ѣ���c changes with strain nonlinearly. Besides that, ![]() increases with strain in the initial stage and gradually reaches a steady mean value with oscillation in a certain range. This tendency is closely related to the variation of mean grain size which directly affects the evolution of boundary length with �ѣ���c. These characteristics of
increases with strain in the initial stage and gradually reaches a steady mean value with oscillation in a certain range. This tendency is closely related to the variation of mean grain size which directly affects the evolution of boundary length with �ѣ���c. These characteristics of ![]() as a function of strain are consistent with the theoretical analysis[23] and the results simulated by the Monte Carlo method[4-5]. The above analysis indicates that the flow stress-based nucleation rate identification method can improve the simulation accuracy of both microstructural evolution and flow stress behavior. And vice versa, the identified nucleation rate is also reasonable.
as a function of strain are consistent with the theoretical analysis[23] and the results simulated by the Monte Carlo method[4-5]. The above analysis indicates that the flow stress-based nucleation rate identification method can improve the simulation accuracy of both microstructural evolution and flow stress behavior. And vice versa, the identified nucleation rate is also reasonable.
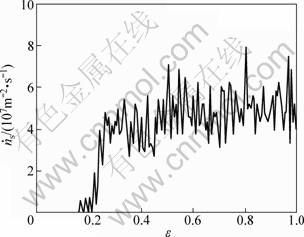
Fig.7 Dependence of area nucleation rate on strain of OFHC copper
5 Conclusions
1) To overcome the difficulties in determining the nucleation rate, a flow stress-based nucleation rate identification method is proposed, in which the CA model is incorporated with an adaptive response surface model to search for the reasonable nucleation rate. This method provides an alternative strategy for reasonable determination of nucleation rate.
2) The microstructural evolution and the flow stress behavior of oxygen-free high-conductivity copper under hot deformation conditions is simulated with the proposed method. The simulated results agree well with the experimental observations, indicating that the new method can effectively determine the nucleation rate and improves the simulation accuracy of microstructural evolution.
[1] SELLARS C M. Modelling microstructural development during hot rolling [J]. Materials Science and Technology, 1990, 6: 1072-1081.
[2] ROLLET D, LUTON M J, SROLOVITZ D J. Computer simulation of dynamic recrystallization [J]. Acta Metall Mater, 1992, 40: 43-55.
[3] PECZAK P, LUTON M J. A Monte Carlo study of the influence of dynamic recovery on dynamic recrystallization [J]. Acta Metall Mater, 1993, 41: 59-71.
[4] PECZAK P, LUTON M J. The effect of nucleation models on dynamic recrystallization I��Homogeneous stored energy distribution [J]. Phil Mag, 1993, 68B: 115-144.
[5] PECZAK P, LUTON M J. The effect of nucleation models on dynamic recrystallization II��Heterogeneous stored energy distribution [J]. Phil Mag, 1994, 70B: 817-849.
[6] GOETZ R L, SEETHARAMAN V. Modeling dynamic recrystallization using cellular automaton [J]. Scripta Mater, 1998, 38: 405-413.
[7] DING R, GUO Z X. Coupled quantitative simulation of microstructural evolution and plastic flow during dynamic recrystallization [J]. Acta Mater, 2001, 49: 3163-3175.
[8] LU Yu, ZHANG Li-wen, DENG Xiao-hu, PEI Ji-bin, WAN Sai, ZHANG Guo-liang. Modeling dynamic recrystallization of pure copper using cellular automaton method [J]. Acta Metallurgica Sinica, 2008, 44: 292-296. (in Chinese)
[9] DING R, GUO Z X. Microstructural evolution of a Ti-6Al-4V alloy during ��-phase processing: Experimental and simulative investigations [J]. Materials Science and Engineering A, 2004, 365: 172-179.
[10] XIAO Hong, YANAGIMOTO J. Simulation of dynamic recrystallization using extended cellular automaton method [J]. Chinese Journal of Mechanical Engineering, 2005, 41: 148-152. (in Chinese)
[11] QIAN M, GUO Z X. Cellular automaton simulation of microstructural evolution during dynamic recrystallization of an HY-100 steel [J]. Materials Science and Engineering A, 2004, 365: 180-185.
[12] JUUL JENSEN D. Recrystallisation kinetics: From statics to dynamics and from 2D to 3D [J]. Materials Science and Technology, 2005, 21: 1365-1372.
[13] RANE T D, DEWRI R, GHOSH S, NITRA K, CHAKRABORTI N. Modeling the recrystallization process using inverse cellular automaton and genetic algorithms: Studies using differential evolution [J]. Journal of Phase Equilibria and Diffusion, 2005, 26: 311-321.
[14] MECKING H, KOCKS U F. Kinetics of flow and strain-harding [J]. Acta Metall, 1981, 29: 1865-1875.
[15] TAKEUCHI S, ARGON A S. Review: Steady state creep of single phase crystal line matter of high temperature [J]. J Mater Sci, 1976, 11: 1542-1566.
[16] HUMPHREYS F J, HATHERLY M. Recrystallization and related annealing phenomena [M]. Oxford: Pergamon Press, 1995.
[17] DAVIES C H J. Growth of nuclei in a cellular automaton simulation of recrystallisation [J]. Scripta Mater, 1997, 36: 35-40.
[18] RAABE D. Cellular automaton in materials science with particular reference to recrystallization simulation [J]. Annu Rev Mater Res, 2002, 32: 53-76.
[19] KUGLER G, TURK R. Modeling the dynamic recrystallization under multi-stage hot deformation [J]. Acta Materialia, 2004, 52: 4659-4668.
[20] WANG G G. Adaptive response surface method using inherited Latin hypercube design points [J]. ASME Journal of Mechanical Design 2003, 125: 210-220.
[21] WEI Dong-lai, CUI Zhen-shan, CHEN Jun. Optimization and tolerance prediction of sheet metal forming process using response surface model [J]. Computational Materials Science, 2008, 42: 228-233.
[22] BLAZ L, SAKAI T, JONAS J J. Effect of initial grain size on the dynamic recrystallization of copper [J]. Metal Science, 1983, 17: 609-616.
[23] XIAO Hong, XIE Hong-biao, YAN Yan-hong, YANAGIMOTO J. Simulation of dynamic recrystallization using cellular automaton method [J]. J Iron & Steel Res Int, 2004, 2: 42-45.
Foundation item: Project(2006CB705401) supported by the National Basic Research Program of China
Corresponding author: CUI Zhen-shan; Tel: +86-21-62827605; E-mail: cuizs@sjtu.edu.cn
DOI: 10.1016/S1003-6326(09)60162-X
