
Trans. Nonferrous Met. Soc. China 24(2014) 1125-1133
A dynamic analysis of environmental losses from anthropogenic lead flow and their accumulation in China
Jing LIANG, Jian-su MAO
State Key Joint Laboratory of Environment Simulation and Pollution Control, School of Environment, Beijing Normal University, Beijing 100875, China
Received 22 May 2013; accepted 1 December 2013
Abstract:
Substance flow analysis was applied to analyzing the lead emissions in 2010. It turns out that in 2010, for every 1 kg of lead consumed, 0.48 kg lead is lost into the environment. The emissions in 2010 were estimated to be 1.89��106 t, which were mainly from use (39.20%) and waste management & recycling (33.13%). The accumulative lead in 1960-2010 from the anthropogenic flow was estimated and the results show that the total accumulative lead in this period amounted to 19.54��106 t, which was equivalent to 14.26 kg and 2.04 g/m2 at the present population and territory.
Key words:
substance flow analysis; emission; historical accumulation; dissipative uses; life cycle;
1 Introduction
In recent decades, lead pollution incidents have happened frequently in China [1]. Specially, the children lead poisoning is extremely severe and has attracted much attention [2]. Therefore, the research concerning lead is arousing more and more concerns and thus treatment of lead pollution is highly pressing at present.
Probably as the earliest metal to be used on the earth [3], the manufacturing history of lead is more than several thousand years. Lead is mined as lead ores, and enters the anthropogenic flow by coming into the human society, which is dominated by human activities [4]. And then it is released from the flow as emissions. It can even accumulate in the environment, threatening the ecological security. Many studies on lead emissions have been carried out from different perspectives. For example, with the help of monitoring techniques, environmental geosciences mainly focus on recognizing the changes in resources or environment and the impacts imposed by human activities. Undeniably, it is challenging to evaluate pollution sources and quantities in geosciences. In this work, to address this key issue, a quantitative flow model will be established based on the substance flow analysis (SFA). This can greatly help to change the ineffective management pattern, which means remedying the existing pollutions, and therefore remarkably improve the potentials for source controlling. Meanwhile, the implementation of quantitative measures, which obeys the rules of lead life-cycle, can greatly promote the efficiency and scientificity of environmental management.
Substance flow analysis (SFA) is one of the most widely used techniques in the analysis of material flow which is confined to a specific boundary. Until now, detailed frameworks for cycles such as iron, zinc and lead have already been established [5-7]. SFA is not only an important tool to identify the pollution sources [8], but can help people to get a better understanding of resources utilization, and even explore the disciplines, which reflect the impacts of natural resources or socio-economic situation on lead emissions. In a word, the application of SFA will help to guide the waste management and evaluate the sustainability of resources in a long time.
Although there have already been a great deal of studies on lead emissions, unfortunately those studies only cover some of all life-cycle stages as to production, manufacture, use or recycling [9-12], or just report on a static study at a specific time as a snapshot of the cycle [5], without a clear idea of the historical characteristics or accumulative effects of lead emissions. It encourages us to wonder how much processed lead has been released into the environment in various ways over the years; this issue can only be satisfactorily addressed from a quantitative and comprehensive flow analysis [13]. In this work, lead emissions covering all life stages and the historical accumulation will be studied on the anthropogenic lead flow in China. The situation in 2010 will be analyzed to obtain the characteristics of national emission intensity, and accumulative lead in the environment is to be estimated during the period of 1960-2010.
2 Methodology
2.1 Model of lead emissions in anthropogenic cycle
Anthropogenic lead flow consists of four stages: production, fabrication & manufacture (F&M), use and waste management & recycling (WMR). Lead is extracted from lead ore in the lithosphere, which is the source of lead in anthropogenic cycle, and ends in the environment as landfills or sediments. Therefore, environment acts as both the source and sink of lead cycle. Specifically, lead cycle starts with the mining of ore resources in production, and then lead is transformed into products or semi-products in F&M, after which lead enters use stage and offers services to human. Finally, it is obsolete after use in WMR and some is reclaimed as secondary resources while the other is left in the environment. Especially, the production of lead can be further divided into primary and secondary lead production. The virgin material supplies of primary lead are lead ores after the processes of mining, concentration and smelting while the secondary lead is refined from scrap which contains relatively high amount of lead. Compared with primary lead from ores, the cost of the secondary lead from scraps is less expensive [14], which promotes the recycling of resources and improves environmental protection as well.
The wastes discharged in production include tailings after mining, slag from refining and smelting, clinker and smoke dust containing lead. During manufacturing, dross and lead ash are emitted, together with leftovers or offcuts from fabrication [15]. At use stage, lead products such as petrol additives, soldering alloys and ammunition are regarded to be permanently lost into the ambient environment and are not recyclable. Finally, many obsolete lead products are recycled or enter the environment as landfills. Lead acid batteries dominate the raw materials of the secondary lead, accounting for over 85% of the wastes, followed by cable sheeting, lead clad and alloys [16].
This research was based on the established framework of lead anthropogenic cycle in 2008 [5,17] (Fig. 1, Table 1). In this work, we will further study the lead cycle by focusing on the quantitative estimation of lead emissions. We make the following assumptions when carrying out our study: the international market is relatively stable in a long period of time; there is a certain quantitative relationship among lead imports, exports and lead consumption; the recycled lead scraps go through the process of secondary refining.
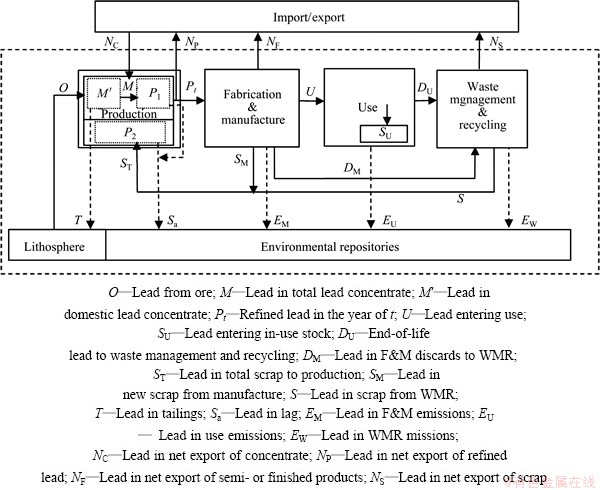
Fig. 1 Framework of lead emissions from anthropogenic cycle
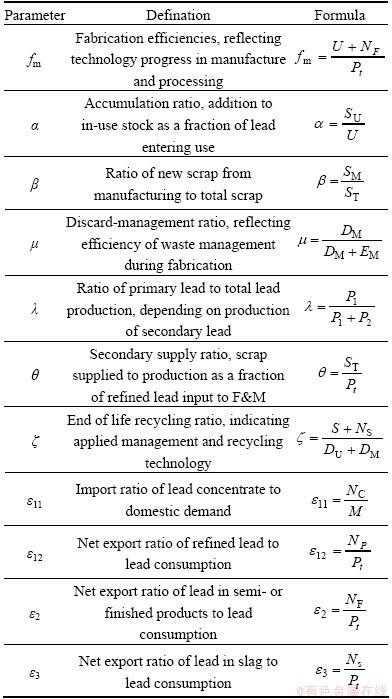
The historical data for a long period of time are not always available for us, with only some known or easy to get, such as lead consumption Pt. We set up the quantitative relationships between various components such as U, DU, M and EM, and lead consumption by quantifying the anthropogenic flow other than simply relying on the scattered data. Obviously, the loss from lead anthropogenic flow is influenced by a variety of factors or parameters. These parameters refer to technology progress or social development, such as ��, which depends on the ability of secondary lead production. We covered all those parameters from the published literatures. Overall, in order to study the loss, we treated other components of the flow as functions of lead consumption with the parameters. The related components are with the unit of t/a, and the subscript t stands for a certain year. Those parameters are shown in Table 1.
Table1 Parameters used in estimation of anthropogenic lead emissions
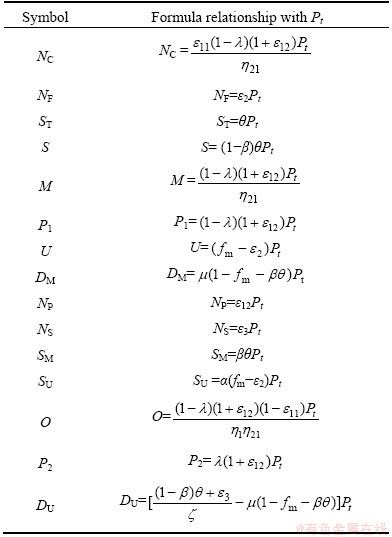
Although lead state, structure and occurrence change a great through the anthropogenic flow, lead obeys the mass conservation law, namely the balance between inflows and outflows [18]. Based on the characteristics of lead cycle and the balance of mass, the emission model could be successfully established. Using the parameters and lead consumption Pt, we can formulate the components of the lead flow. This complex but rewarding process requires more than precise math deduction, and a deep understanding of the anthropogenic lead flow is also needed. The components formulated by Pt and the parameters can be seen in Table 2.
Table 2 Symbols formulated by parameters and Pt in lead anthropogenic flow
2.2 Intensity and accumulative equations of lead emissions
2.2.1 Intensity equations of lead emissions
Human hazards and ecological risks of lead vary with the lead composition, state and chemical structure [19,20]. Because the emissions released from the same stage tend to have similar properties, we classified the different emissions according to stages and calculated the loss at each stage.
With the model built in the article, we can successfully use parameters and Pt to formulate the lead emissions. T, namely the lead emissions in tailings, and Sa, the loss in slag released in lead refining or smelting, are
 (1)
(1)
 (2)
(2)
EM, the lead emissions in F&M from anthropogenic flow, is
 (3)
(3)
EU, the lead emissions at the stage of use, is
 (4)
(4)
EW, the lead emissions during WMR, is
 (5)
(5)
Because all the emissions in the above equations refer to lead mass contained in them, we can acquire the total emissions by adding up the loss from production, F&M, use and WMR. Thus Qt, the total emissions at the year t, is


 (6)
(6)
2.2.2 Accumulative equations of lead emissions
There are altogether two kinds of lead flows: the natural flow and the anthropogenic flow. The natural flow includes all the lead transfer and transformation in soil, atmosphere or hydrosphere, under the influence of natural processes, such as weathering of rocks or the volcanic eruptions. Lead goes through human society while offering specific services or satisfying human demands. It is known that the scale of anthropogenic lead flow is 12 times that of its natural flow [21]. What��s more, due to the increasing lead use, the current lead anthropogenic flow has already exceeded the carrying capacity of the nature. We can find that the loss from the anthropogenic lead flow, which is difficult to be absorbed by natural purification, dominates the sources of lead pollutants in the environment. Additionally, those pollutants gradually accumulate in the environment, impairing the environmental quality and threatening the ecological safety. Under the increasingly strong impacts of anthropogenic lead flow, the accumulation of lead raises a lot with the pass of time. In the specific time interval of T, the accumulative quantity QT is
 (7)
(7)
where Qt is the accumulative rate, which only has a specific value at the time t. As Qt is a function of t, the accumulation quantity is usually a continuous function of time under the ideal condition. However, due to statistics limits, the data available are usually discontinuous in reality. Therefore, when the differential is set as a year, lead accumulation in the environment is the sum of emission rates or intensity of each year. Therefore, Qt can be expressed as a discrete function. In this study, we selected the last half century (1960-2010) as our study period. We chose this period on the knowledge of lead industry situation, which has a sharp increase in lead consumption. During the period of 1960-2010, the accumulative lead emissions can be formulated as
 (8)
(8)
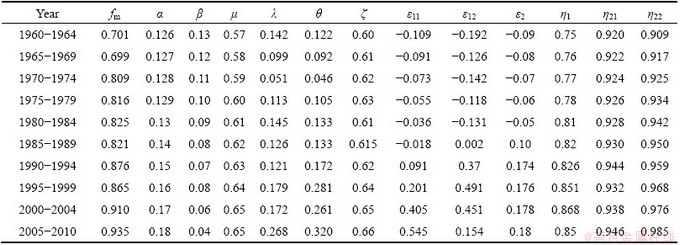
2.3 Values of parameters and data sources
2.3.1 Values of parameters
If we intend to get the quantity of lead emissions and the accumulative amount, we must manage to get the values of the parameters.
At the stage of F&M, it was reported that the ratio of F&M scrap to the total scrap is 0.0416 on a global scale [22], and in China this ratio is approximately 0.103 in 2006 [15]. Therefore, we can estimate the approximate values of �� as listed in Table 3. Moreover, DM occupies 30% of the total lead that is not embodied in final products, and EM takes up 20% [4], so it is easy to get the discard-management ratio ��, 0.6, and this ratio is 0.659 globally in 2000 [5], then the estimation values of �� can be approximately obtained. The fabrication efficiencies, fm, of various lead products have been determined during the period of 1900-2000 in a relevant research [23] and fm of China is about 90% [24]. For the reason that domestic large-scale refineries have already had a comparable smelting ability to those in the foreign countries [25], the values can be derived according to global fabrication efficiencies.
At use stage, the accumulation ratio of in-use stock is 0.112 in 2000 [5]. Additionally, it is known that this parameter is largely affected by a couple of social and economic factors, such as GDP, population size, consumer preference [26]. Based on the above knowledge, the values of �� can be estimated.
As to the stage of WMR, the scrap coming back to production takes up 0.662 of the WMR input [22] and it is believed that the domestic recycling rate is comparatively modest [27]. The late 1980s saw a rapid development in the local lead smelting industry [28], while the corresponding management measures appeared to lag behind. Moreover, in 1996, the State Council issued the document of Decision of the State Council on several issues concerning environmental protection, forbidding the development of small-sized lead enterprises and pollution-intensive industrial projects, after which a further progress in waste management has been achieved. Based on all the above, we can estimate the end of life recycling ratios ��.
Table 3 Estimated values of parameters determining environmental emissions
For production stage, we can get the data of mining, concentrating and refining efficiencies of primary lead from 1990 to 2010 in China Nonferrous Metals Industry Yearbook. Besides, it was recorded that in 1981, the flotation technology without cyanogens of high-sulphur lead-zinc ores was explored successfully and was applied by more than 40% enterprises in the 1980s [29], so we can see that the mining efficiencies changed a great since the 1980s. Reports show that the refining efficiencies of the secondary lead range from 0.86 to 0.985 [17]. Therefore, it is not difficult to estimate the mining and refining efficiencies.
The ratio of secondary lead to refined lead (��), can be acquired from the total refined lead production divided by the secondary lead production. The supply ratio of secondary lead (��), can be obtained based on the lead consumption, secondary lead production and the secondary refining efficiency.
The net import and export parameters, namely ��11, ��12, ��2, can be determined by simple calculation of total lead production, consumption and lead imports or exports from statistics data. Because the imports and exports of scrap are very little [15] and are negligible compared with the refined lead [30], we assume that the net scrap export ratio is zero. Before the 1980s, it was reported that lead raw materials were exported and lead products were imported in China, and in the latter years the situation changed completely. Since 1996, China began to import lead concentrate [31]. It has been shown that the imports of lead ore accounted for 1/3 of the total domestic demand in 2000 [30], and in the following year, the domestic lead concentrate can only satisfy 49.1% of the refined lead production [32]. The international trades are expected to become more frequent since China joined WTO in 2001. China has already become one of dominant countries in lead production and net exports all over the world. In recent years, the exports, especially exports in the manufacturing industry, are the driving force of large resource demands and imports of lead raw material [33]. Owing to the export rush before the implement of the policy of canceling export rebates, the exports of refined lead reached a high record while the export of refined lead in 2007 and 2008 decreased heavily, and in 2009 China began to import refined lead [34]. So we can see that the export ratio of refined lead during 2005-2010 reduced sharply compared with the previous years. The values of import or export ratio (��11, ��12, ��2) can be got on the knowledge with the trade situation in China.
2.3.2 Sources and values of basic data
Lead production, consumption, imports and exports are the basic data of this study. Lead consumption for period 1996-2010 in China can be collected directly from China Nonferrous Metals Industry Yearbook (1998, 2001, 2004, 2007, 2010 and 2011) and lead consumption from 1986 to 1996 can be acquired from reference [24]. The data of lead consumption for every five years from 1960 to 1985 are available in reference [28]. Due to the consistency in lead consumption in a short time, we can estimate the lead consumption of each year during 1960-1985 based on the proportion that consumption occupies in lead production.
The total production of refined lead, primary lead and secondary lead in China during 1960-2010 can be taken directly from China Nonferrous Metals Industry Yearbook (2011). The exports and imports of lead concentrate, refined lead, lead semi- or finished products and lead scrap can be obtained from the statistics of each year which are organized according to the national customs recordings.
3 Results and discussion
3.1 Intensity of lead emissions
The lead emissions released to the environment at every stage in 2010 can be calculated according to equations (1)-(6). It turns out that the emissions in 2010 from anthropogenic flow amounted to 1.89��106 t. The lead flow can be referred in Fig. 2. It was recorded that the lead consumption was 3.95��106 t in 2010. Therefore, we can see that for every 1 kg of lead consumed or put into end use, 0.48 kg lead is lost to the ambient environment. Those emissions or even pollutants will not only deplete the lead resources on the earth, but also inflict severe ecological and health damage [10].
Lead emissions from the use stage were most, which was 740.1��103 t, contributing 39.20% to the total amount, followed by 625.4��103 t from WMR (33.13%). Additionally, the emissions of production and F&M were 450.2��103 t (23.85%) and 72.2��103 t (3.82%), respectively (Table 4). It was reported that the recyclable lead products such as lead acid batteries, sheet and pipe account for merely 66% in the consumption structure of China [24] and the dissipative lead [4] is lost permanently to the environment during use. Compared with 66% in China, the recyclable lead can be more than 80% internationally [35], so the humble recyclable lead proportion is probably the most important reason for the large emissions in China during use. In addition, the recycling rate in WMR is comparatively low. This can be seen from the fact that the recycling rate of acid lead batteries is only 90% but almost 100% in developed countries across the world [36]. What��s more, the domestic refineries tend to be small in scale and usually apply the less advanced technology. They are quite energy-consuming [27] with a low recycling rate, and are responsible for the large amount of wastes and emissions.
3.2 Accumulative lead emissions
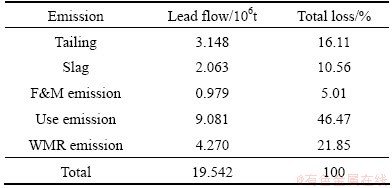
According to equation (8), the accumulative emission from lead anthropogenic flow was 19.54��106 t, respectively from the stages of production (26.67%), F&M (5.01%), use (46.47%) and WMR (21.85%). Figure 3 shows the accumulative quantity of lead emissions during 1990-2010. If the population of China is set to be 1.37 billion, on a per capita basis, the accumulative lead will be 14.26 kg. If the lead emissions were distributed evenly in the land area of China, and there would be 2.04 g/m2 lead. With the plough layer assumed to be 20 cm and the soil density 2.65 g/cm3, the pollution concentration would be about 3.84 mg/kg, which means that 3.84 mg/kg was added to the background value. Although this may not seem a sharp increase, lead concentration in some specific area can be extraordinarily high. For example, lead concentration for lightly polluted soil is close to 100 mg/kg while soil seriously polluted by lead-zinc mining can reach 104 mg/kg [37]. The potential harm of lead to human is tremendous.
While lead consumption in the society is increasing and the in-use stock [23] is enlarging over time, the corresponding management and recycling technology innovations fall behind. Even though the accumulation rates (lead emissions as a fraction of total lead consumption) reduced from 1.149 to 0.478, the lead emissions of every year intensified during this period.
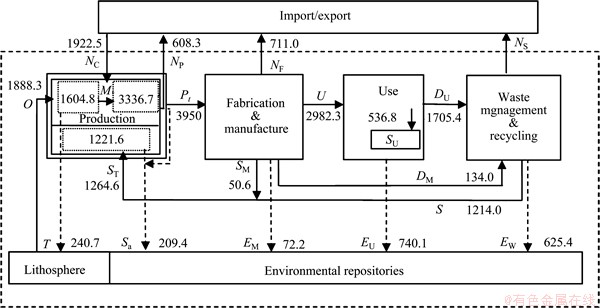
Fig. 2 Anthropogenic flow of lead in 2010(103t)
Table 4 Environmental emissions from lead anthropogenic flow in 2010
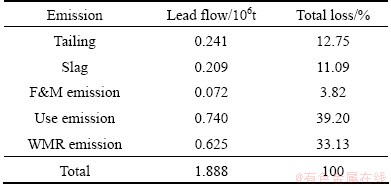
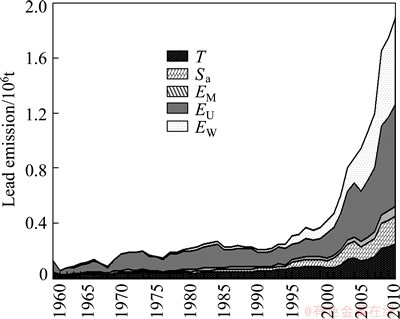
Fig. 3 Lead emissions from anthropogenic flow in China during period of 1960-2010
Besides, the emissions at the WMR stage increase most, in which the emissions increased by 81 times from 1960 to 2010 while the increase of emissions in F&M is far less (see Fig. 3). The accumulative lead emissions from different stages can be seen in Table 5.
Table 5 Accumulated environmental emissions from lead anthropogenic flow during period of 1960-2010
3.3 Data uncertainty and perspectives
The statistics can only date back to the year of 1990, and for the former years, there are only limited descriptions in literatures and only a few scattered records from lead enterprises or the whole industry. In this study, we referred to the overall development situation of lead industry during 1960-2010 and speculated the possible development level. Although the gap between true values and estimations is unavoidable, we tried our best to make it consistent with reality. Furthermore, the following shortcomings and perspectives are brought out.
1) The life spans of lead products in the flow are not taken into consideration. Various products have different life spans which greatly influence the quantity of lead wastes in use, and this is what the further study needs to address.
2) Lead flow is affected by governmental regulations and policies, and studies on relation to policies�� impacts need to improve.
3) Lead emissions on the global scale from anthropogenic flow remain to be studied further because the historical accumulation of lead estimated is the essential groundwork for waste treatment. Studies on the real lead stock in the environment and its environmental risks need to be carried out, considering the purifying capacity of nature.
4 Conclusions
In 2010, the total lead emissions from anthropogenic flow were 1.89��106 t which mainly formed at the stages of use (39.20%) and WMR (33.13%). The lead consumption was 3.95��106 t, which means that for every 1 kg of lead consumed or put into end use, 0.48 kg of lead is lost to the ambient environment. The high proportion of dissipative lead, together with the less advanced recycling technology is the most important reason for the large emissions.
During the period of 1960-2010, the accumulative lead emissions amounted to 19.54��106 t. If the lead emissions were evenly distributed on the polluted farmland, and there would be 2.04 g/m2. At the present population, it is 14.26 kg on per capital base. Moreover, the pollution concentration would be about 3.84 mg/kg, which means that 3.84 mg/kg was added to the background value. The corresponding management and recycling technology innovations fall behind the increase in lead consumption, which leads to the increasing emissions released to the environment.
Therefore, it is suggested that in order to reduce the lead emissions, China should: 1) optimize the lead consumption structure and reduce the use of dissipative lead while searching for the substitutions of lead positively; 2) make full use of the lead scrap to increase the proportion of secondary lead, establish an effective recycling system, improve the application of advanced technology and encourage the centralized processing ability of wastes; 3) make effective laws and regulations to regulate the emissions from lead enterprises and conduct necessary macro-control; and 4) reduce the exports of lead products reasonably and prolong the life spans of products in society.
References
[1] QIN Jun-fa. Status, sources of pollution and control measures of Chinese children lead poisoning [J]. Guangdong Trace Elements Science, 2010, 17(1): 1-13. (in Chinese)
[2] ZHAO Ting-ting, CHEN Bing, WANG Hai-ping, WANG Rong, ZHANG Hong. Evaluation of toxic and essential elements in whole blood from 0- to 6-year old children from Ji��nan, China [J]. Clinical Biochemistry, 2013, 46: 612-616. (in Chinese)
[3] GALE N H, STOS-GALE Z. Lead and silver in the ancient Agean [J]. Scientific American, 1981, 244(6): 176-191.
[4] MAO Jian-su, CAO Jing, GRAEDEL T E. Losses to the environment from the multilevel cycle of anthropogenic lead [J]. Environmental Pollution, 2009, 157: 2670-2677.
[5] MAO Jian-su, DONG J, GRAEDEL T E. The multilevel cycle of anthropogenic lead II. Results and discussion [J]. Resource, Conservation and Recycling, 2008, 52: 1050-1057.
[6] WANG Tao, MULLER D B, GRAEDEL T E. Forging the anthropogenic iron cycle [J]. Environmental Science and Technology, 2007, 41(14): 5120-5129.
[7] GRAEDEL T E, VANBEERS D, BERTRAM M, FUSE K, GORDON R B, GRITSININ A, HARPER E M, HAPUR A, KLEE R J, LIFSET R, MEMON L, SPATARI S. The multilevel cycle of anthropogenic zinc [J]. Industry Ecology, 2005, 9(3): 67-90.
[8] SPATARIA S, BERTRAM M, GORDON R B, HENDERSON K, GRAEDEL T E. Twentieth century copper stocks and flows in North America: A dynamic analysis [J], Ecological Economics, 2005, 54(1): 37-51.
[9] ZHANG Xiu-wu, YANG Lin-sheng, LI Yong-hua, LI Hai-rong, WANG Wu-yi, GE Quan-sheng. Estimation of lead and zinc emissions from mineral exploitation based on characteristics of lead/zinc deposits in China [J]. Transactions of Nonferrous Metals Society of China, 2011, 21(11): 2513-2519.
[10] TUKKER A, BUIST H, van OERS L, van der VOET E. Risks to health and environment of the use of lead in products in the EU [J]. Resources, Conservation and Recycling, 2006, 49: 89-109.
[11] LOHM U, ANDERBERG S, BERGBACK B. Industrial metabolism at the national level: A case-study on chromium and lead pollution in Sweden, 1880-1980 [C]//AYRES R U, SEMONIS U E. Tokyo: United Nations University Press, 1994.
[12] SORME L, BERGBACK B, LOHM U. Goods in the anthroposphere as a metal emission source: A case study of Stockholm, Sweden [J]. Water, Air, and Soil Pollution, 2001, 1(3-4): 213-227.
[13] GRAEDEL T E, VANBEERS D, BERTRAM M, FUSE K, GORDON R B, et al. Multilevel cycle of anthropogenic copper [J]. Environmental Science and Technology, 2004, 38: 1242-1252.
[14] ZHANG Sheng-yong, QIAO Feng-hua. Practice and exploration of lead recycling method [J]. Storage Battery, 2004, 41(2): 84-88. (in Chinese)
[15] GUO Xue-yi, ZHONG Ju-ya, SONG Yu, TIAN Qing-hua. Substance flow analysis of lead in China [J]. Journal of Beijing University of Technology, 2009, 35(11): 1554-1561. (in Chinese)
[16] CAO Yi-sheng. The status and perspectives of recycling nonferrous metals resources [J]. China Metal Bulletin, 2006(16): 7-12. (in Chinese)
[17] MAO Jian-su, DONG J, GRAEDEL T E. The multilevel cycle of anthropogenic lead I. Methodology [J]. Resource, Conservation and Recycling, 2008, 52: 1058-1064.
[18] KLEIJN R, HUELE R, van der VOET E. Dynamic substance flow analysis: The delaying mechanism of stocks, with the case of PVC in Sweden [J]. Ecological Economics, 2000, 32: 241-254.
[19] ECKELMAN M J, GRAEDEL T E. Silver emissions and their environmental impacts: A multilevel assessment [J]. Environmental Science and Technology,2007,41(17): 6283-6289.
[20] Indiana Clean Manufacturing Technology Institute. Indiana relative chemical hazard ranking system [EB/OD]. [2013-03-21]. http://cobweb.ecn.purdue.edu/CMTI/IRCHS/
[21] The Research Board on Sustainable Development of China Academy of Science. The strategic report on sustainable development of China in 2000 [M]. Beijing: Science Press, 2000: 207. (in Chinese)
[22] SMITH G R. Lead [EB/OD]. [2013-12-03]. http://minerals.usgs.gov/minerals/pubs/commodity/lead/380400. pdf.
[23] MAO Jian-su, GRAEDEL T E. Lead in-use stock [J]. Journal of Industrial Ecology, 2009, 13(1): 112-126.
[24] MAO Jian-su, LU Zhong-wu. A study on causes of low recovery of scrap lead [J]. World Nonferrous Metal, 2003(11): 24-28, 32. (in Chinese)
[25] JIANG Ji-mu. The status and sustainable development of lead and zinc smelting industry in China [J]. The Chinese Journal of Nonferrous Metals, 2004, 14(1): 52-62. (in Chinese)
[26] ELSHKAKI A, van der ESTER V, van HOLDERBEKE M, TIMMERMANS V. The environmental and economic consequences of the developments of lead stocks in the Dutch economic system [J]. Resources, Conservation and Recycling, 2004, 42 (2): 133-154.
[27] WANG Hong-mei, LIU Qian, WANG Fei-fei, QIAN Yan. The status of lead-acid battery recycling and study on the layout of its management [J]. Environmental Science and Management, 2012(6): 51-54. (in Chinese)
[28] CAI Xian-di, FENG Jun-cong, JIANG Da, JIANG Kai-min. The lead consumption and recycling in China [J]. World Nonferrous Metal, 1996, 6: 37-40. (in Chinese)
[29] China Nonferrous Metals Industry Association. China nonferrous metals industry 60 years [M]. Changsha: Central South University Press, 2009: 166. (in Chinese)
[30] MAO Jian-su, YANG Zhi-feng, LU Zhong-wu. Industrial flow of lead in China [J]. Transactions of Nonferrous Metals Society of China, 2007, 17(2): 400-411.
[31] FENG Jun-cong, ZHANG Fang, HUANG Guo-ping. The trends of world market and future of lead/zinc industry in China [J]. World Nonferrous Metal, 1996(12): 40-45. (in Chinese)
[32] HUANG Zhong-quan. The present lead and zinc industry development and suggestions in China [J]. World Nonferrous Metal, 2004(8): 4-6, 63. (in Chinese)
[33] ROBERTS I, RUSHU A. Understanding China��s demand for resource imports [J]. China Economic Review, 2012, 23(3): 566-579.
[34] FAN Li. Analysis of factors which influence imports and exports of lead concentrate in China [J]. Modern Mining, 2012(4): 1-6. (in Chinese)
[35] GAO Shan. The world lead consuming trends [J]. World Nonferrous Metal, 2000, 3: 14-16. (in Chinese)
[36] LI Fu-yuan. The status and countermeasures of the recovery of obsolete lead-acid batteries [J]. China Resources Comprehensive Utilization, 2000, 4: 3-7. (in Chinese)
[37] WANG Zhuo, SHAO Ze-qiang. Soil pollution of lead and treatment [J]. Agriculture Technology and Equipment, 2009(158): 6-8. (in Chinese).
�й�ǦԪ����Ϊѭ���Ļ����ŷ����ۻ��Ķ�̬����
�� �������
����ʦ����ѧ ����ѧԺ ����ģ������Ⱦ���ƹ����ص�����ʵ���ң����� 100875
ժ Ҫ��Ӧ������������������������2010��Ǧ�Ļ����ŷ���״�����������2010�����ÿ����1 kg��Ǧ����0.48 kgǦ�ŷŵ������С�2010�����Ϊѭ�����ŷŵ������е�Ǧ����1.89��106 t����Ҫ����ʹ�ýΣ�39.20%���������ս�(33.13%)��������1960-2010����Ϊѭ����Ǧ���ŷźͻ����ۻ���������������ʱ�����ŷŵ������е�Ǧ�ۻ�����Ϊ19.54��106 t���������˿ڼ���������ֱ��ۺ�Ϊ14.26 kg��2.04 g/m2.
�ؼ��ʣ����������������ŷţ���ʷ�ۻ�����ɢ��ʹ�ã���������
(Edited by Xiang-qun LI)
Foundation item: Project (41171361) supported by the National Natural Science Foundation of China
Corresponding author: Jian-su MAO; Tel: +86-10-59893089; E-mail: maojs@bnu.edu.cn
DOI: 10.1016/S1003-6326(14)63171-X
Abstract: Substance flow analysis was applied to analyzing the lead emissions in 2010. It turns out that in 2010, for every 1 kg of lead consumed, 0.48 kg lead is lost into the environment. The emissions in 2010 were estimated to be 1.89��106 t, which were mainly from use (39.20%) and waste management & recycling (33.13%). The accumulative lead in 1960-2010 from the anthropogenic flow was estimated and the results show that the total accumulative lead in this period amounted to 19.54��106 t, which was equivalent to 14.26 kg and 2.04 g/m2 at the present population and territory.
