

J. Cent. South Univ. (2020) 27: 2726-2744
DOI: https://doi.org/10.1007/s11771-020-4494-8

Physico-mechanical performance of debris-flow deposits with particular reference to characterization and recognition of debris flow-related sediments
YANG Kui(����), XU Ze-min(������), REN Zhe(�Ά�), WANG Kun(����),
TANG Yong-jun(������), TIAN Lin(����), LUO Jun-yao(��Ң), GAO Hai-yan(�ߺ���)
Faculty of Civil Engineering and Mechanics, Kunming University of Science and Technology,Kunming 650500, China
 Central South University Press and Springer-Verlag GmbH Germany, part of Springer Nature 2020
Abstract:
To characterize and recognize the debris flow-related deposits, the physico-mechanical performance of four deposits from the Dongyuege (DYG), Shawa (SW), Jiangjia Gully (JJG), and Gengdi (GD) debris flows in southwest China is investigated through laboratory analyses and tests. The four debris-flow materials can all be remolded into coherent, homogeneous cylinders with high densification and strength�Cporosity of 25%-36%, mean pore-throat radius of 0.46-5.89 ��m, median pore-throat radius of 0.43-4.28 ��m, P-wave velocity of 800-1200 m/s, modulus of elasticity of 28-103 MPa, unconfined compressive strength (UCS) of 220-760 kPa, and cohesion of 65-281 kPa. Based on the comparison in slurryability and formability among debris-flow deposits, granular flow deposits, fluvial deposits, residual lateritic clay and loess, whether a sediment can be cast into competent cylinders for physico-mechanical tests can be regarded as a diagnostic evidence of old debris-flow deposits. The discrepancy in physico-mechanical properties among the four debris-flow deposits suggests that the combination of foregoing physico-mechanical parameters can characterize assembling characteristics of debris flow-related sediments including grain size distribution, mineralogy, and accidental detritus. Four deposited sediments above can be surprisingly classified as hard soil-soft rocks according to UCS, and the hard soil-soft rock behaviors can advance the further understanding of debris flows.
Key words:
Cite this article as:
YANG Kui, XU Ze-min, REN Zhe, WANG Kun, TANG Yong-jun, TIAN Lin, LUO Jun-yao, GAO Hai-yan. Physico-mechanical performance of debris-flow deposits with particular reference to characterization and recognition of debris flow-related sediments [J]. Journal of Central South University, 2020, 27(9): 2726-2744.
DOI:https://dx.doi.org/https://doi.org/10.1007/s11771-020-4494-81 Introduction
Debris flows are admixtures of solid particles and water that move together, with the particle size ranging from clay to boulder [1], and often trigger catastrophic events resulting in casualties. It is well known that debris flows are associated with a combination of three driving factors: 1) runoff, 2) steepness of the drainage channels on the slopes, and 3) sufficient available loose sediments prone to debris flows [2]. Additionally, debris flows have distinctive flow properties and depositional characteristics [3], which are controlled largely by the characteristics of debris [4-6]. Hence, the characterization of debris is important to the in-depth understanding of debris-flow processes.
Earlier studies have proposed some characterization parameters for contemporary debris flows and the sediments prone to debris flows, and the main one is particle size distribution. In these studies, attempts were made to account for the characteristics and occurring mechanisms of debris flows based on the grain size distributions of their deposits [7-10]. Additionally, many studies have identified clay minerals in debris-flow deposits [11, 12], which are generally considered as an essential constituent in debris flows because they can influence both the yield stress and viscosity, thereby affecting the mobility of debris flows significantly [13, 14]. The knowledge of particle size distribution and clay minerals is essential for debris flow studies, but they cannot reflect the behaviors of grain aggregates. The existing studies have demonstrated that the properties of debris flows are influenced by compositions of debris, grain size distribution of mineral-rock debris, mineral compositions of fines, solid volumetric concentrations [12, 15-18], lithology-particle shape-surface fabric of coarse clasts and so on. This indicates that a good understanding of debris flows requires knowledge of all these factors rather than one or some factors. Consequently, the overall characterization of sediments is of critical importance.
Additionally, identification of debris-flow deposits is important for debris-flow susceptibility assessment and mitigation, because the profiles of debris-flow deposits record the magnitude and frequency of past debris-flow events [10, 19]. However, old debris-flow deposits are often difficult to identify, due to the impacts of other flow processes of lower recurrence period, such as fluvial flows [20]. To our knowledge, the identification of ancient debris-flow deposits reported in the literature mainly relies on geomorphic field evidence [20-23], debris-flow sedimentary features (including cohesive appearance like a poor grade of concrete, diamicton, negligible grading or internal layer structures) [23-25], and particle roundness [26]. Although those methods are useful for identifying the debris- flow deposits, not all the diagnostic evidence or sedimentary feature described in above literature may be present. For the purpose of identifying the ancient debris-flow deposits accurately, the methodology to recognize the ancient debris-flow deposits remains to be constantly improved and perfected.
In an attempt to find an overall quantitative methodology for characterizing debris flow-related sediments, the physico-mechanical properties of four debris-flow deposits in Yunnan and Sichuan provinces which are most affected by debris flows in China are investigated, and a comparative test between debris-flow deposits and sediments that do not derive from debris flows is performed. Based on the physico-mechanical properties of the tested debris-flow deposits, and the slurryability and formability of the granular flow deposits, fluvial deposits, residual lateritic clay and loess, the combination of the chosen physico-mechanical parameters (porosity n; mean pore-throat radius rm; median pore-throat radius r50; P-wave velocities Vp; elasticity modulus E; unconfined compressive strength, UCS; cohesion c) can characterize the integrated properties of debris flow-related sediments. The hard soil-soft rock behaviors of the debris-flow deposits revealed in this study advance the further understanding of debris flows.
2 Materials and methods
2.1 Sampling
This research is performed on the materials from debris-flow deposits of Dongyuege, Shawa, Jiangjia Gully and Gengdi debris-flow events. The first three events occurred in Yunnan and the fourth events took place in Sichuan in southwest China. The Dongyuege, Shawa, Jiangjia Gully and Gengdi are labeled as DYG, SW, JJG and GD, respectively.
The 2010 DYG debris flow with a travel distance of approximately 11 km transferred about 60��104 m3 of sediment to the fan region on the left bank of the Nu River (27��38��07.62��N/ 98��43��52.47��E) and claimed 96 lives [27, 28]. The SW debris flow occurring in 2014 travelled over 7.0 km and killed 17 people living in the fan apex at the left bank of the Nu River (26��34��23.98��N/ 98��54��20.40��E). These two events occurred in the same tectonic unit, and their initiation zones and flow paths are underlain by granite, schist, gneiss, quartzite and marble. Both DYG and SW debris flows were bouldery debris flows exhibiting a sandy-silt matrix, and occurred in well-vegetated alpine areas.
The JJG catchment (26��14��49.59��N/ 103��08��03.74��E) is a tributary of the Xiao River proverbial for frequent debris-flow events and the well-known site for debris-flow research in China [29, 30]. The underlying bedrock in the debris-flow gullies including JJG in the Xiao River watershed is dominated by Proterozoic slates, episodically intercalated with thin sandstones and dolostones. The GD debris flow occurred in Tongzilin Gully located in forested mountain areas (27��28��27.47��N/ 102��29��03.45��E) on 8 August, 2017 and resulted in 25 deaths. The Ordovician sandstone and shale compose the bedrock exposed by erosion in the mobilization site. The JJG and GD can be classified as muddy-matrix debris flows [31].
The debris-flow materials used in this study are collected from their depositional areas by using excavation and sieving methods. Considering their sedimentary features [20, 25], the heterogeneity and anisotropy of the debris-flow deposits are ignored. After careful field inspections, the sites with well-preserved debris-flow deposits (i.e. not markedly altered by post-depositional processes [10]) are selected for sampling. Given the possibility that some of the fines may have been lost due to the leaching action of surface water, the detritus is collected from 0.3-1.0 m below the deposit surfaces. About 20, 10, 5 and 10 t of the materials with a maximum particle size of 100 mm from the DYG, SW, JJG and GD are transported to the laboratory in Kunming for this and other studies, respectively.
On the basis of material properties, test types, test competence of apparatuses (the largest sizes or volumes of the test specimens), practicability and the comparison of this and other authors�� follow-up studies, etc. [32, 33], two groups of tested materials with the maximum grain sizes (MGSs) of 2 and 5 mm are separated by wet-sieving [15, 34] from the detritus described in the preceding paragraph.
2.2 Basic properties of tested materials
The grain size distributions (GSDs) of the materials with MGSs of 2 and 5 mm used in this study are determined specifically through a combination of wet-sieving and a laser diffraction particle size analyzer. The grading curves are presented in Figure 1.
As reported [27], the clay-sized particles in the DYG deposit contain quartz (40 wt%), mica (30 wt%), plagioclase (15 wt%), and chlorite (10 wt%), etc. Following the methods described by Ref. [27], the mineralogy of the clay-sized particles in the SW, JJG and GD deposits is determined, and the results are shown as histograms in Figure 2.
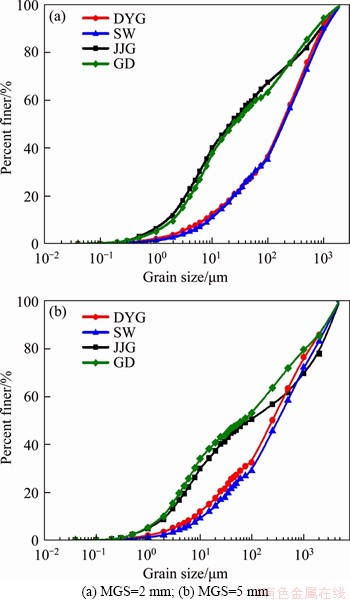
Figure 1 Grain size distributions (GSDs) of test materials:
Compared with the JJG deposit, the DYG, SW and GD debris-flow deposits contain abundant accidental detritus [15]-small wood debris (SWD) [28]. In order to quantify the SWD presented in the deposits and compare their differences, the organic matter contents (OMC) in two fractions (i.e. MGS = 0.075 and 2 mm) of the four tested materials are jointly determined by the potassium bichromate titrimetric method [33].The OMC contents quantifying SWD in the fractions <0.075 mm of the DYG, SW, JJG and GD deposits are 1.93%, 3.05%, 0.45% and 2.67% (wt), respectively. Likewise, the OMC contents, for the fractions with particle size <2 mm, are 1.11%, 1.79%, 0.38% and 2.03% (wt), respectively.
The cation exchange capacity (CEC) of the fine particles (MGS=0.075 mm) in the four debris-flow deposits is analyzed using the Barium chloride buffer method under the guidance of LY/T 1243 [35]. For each deposit, two samples are analyzed. The average CEC for the DYG, SW, JJG and GD deposits is 6.86, 9.40, 5.68 and 11.05 cmol/kg, respectively.
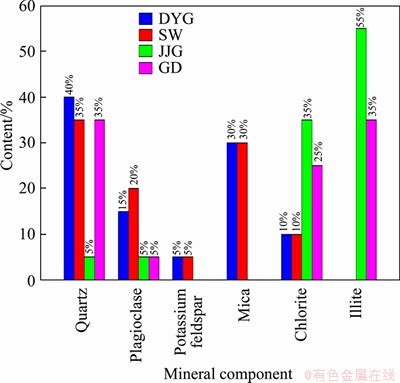
Figure 2 Mineral compositions (mass fraction) of clay- sized fractions in DYG, SW, JJG and GD debris-flow deposits
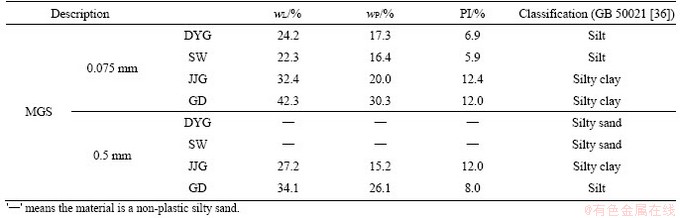
As discussed previously, the matrix of the DYG and SW debris flows is sandy, and that of the JJG and GD debris flows is clayey. The liquid limit (wL), plastic limit (wp), and subsequent plasticity index (PI) of two size classes (<0.075 mm and <0.5 mm fractions) for the four deposits are measured according to GB/T 50123 [33], so as to quantify this difference. The results are given in Table 1.
2.3 Measured parameters and sample preparation
In the process of selecting the measured physico-mechanical parameters, it must be considered first whether the debris-flow deposits are soils or rocks. The particles in the blocks of the studied deposits can be separated by agitating in water, which means the deposits are soils [37]. On the other hand, these field deposits are not the loose agglomerates of particles of various sizes, but that, instead, they show a very dense appearance and behave somewhat like rocks [24, 38-40].Therefore, the transitional property of the deposits between ��soil-like�� and ��rock-like�� behavior is an important consideration in this case.
Equally important, the choice of the parameters to characterize the debris-flow deposits is also dictated by practical considerations, i.e. the selected parameters are easily obtainable (the most common) and the satisfactory samples can be made to obtain the selected parameters according to the experimental criterion.
Finally, the porosity (n), pore-throat size distribution, P-wave velocities (Vp), elasticity modulus (E), unconfined compressive strength (UCS), cohesion (c) and internal friction angle (��) are chosen as the parameters to characterize the physico-mechanical features of the tested samples.
In the subsequent sample preparation process, the <2 mm (Group A) and <5 mm (Group B) fractions from the DYG, SW, JJG and GD deposits are reconstituted into cylinders of two sizes by using the molds of two sizes (size I and II in Table 3), respectively. The logical steps are as follows:
Step 1: After measuring the lower limit (Cvh) and upper limit (Cvd) of the solid volumetric concentration (SVC) of a sediment slurrying [27], the SVC of the slurry reconstituted with the sediment to pour tested samples (Cvt) is determined as follows:
Cvt=(Cvd-Cvh)��0.9+Cvh
In order to record and compare the mobility of the reconstituted slurries with a specific Cvt, their rheological behaviors are quantified by an Andon Paar MCR52 rheometer. The results including yield stress (��0) and viscosity (��) are summarized in Table 2.
Table 1 Plasticity index of two particle size classes (maximum grain sizes MGSs=0.075 mm and =0.5 mm) in tested deposits
Step 2: The slurry with a specific Cvt is poured into a mold that is a cylindrical barrel made of tin-coated iron (Figure 3(a)). Considering the shrinkage difference between the four types of experimental slurries and the limitation of experimental criterion on tested samples, the barrels with different sizes have been processed as the molds for DYG, SW, JJG and GD (Table 3).
To simulate the process of the escape of pore water from debris flows after stoppage, the top of the molds is open. On the bottom and vertical sides of the molds, there are staggered 0.8 mm diameter round holes at a spacing of 2-3 cm, as shown in Figure 3(a).
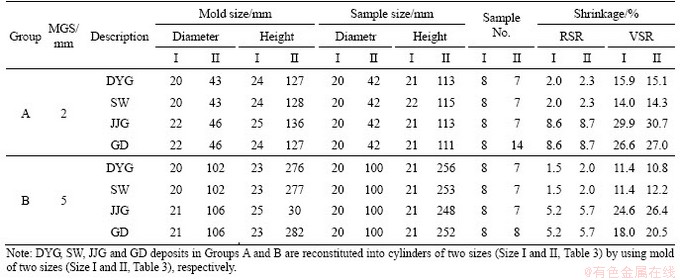
Step 3: After the water is drained through the small holes, the molds filled with debris are put into an electrical laboratory oven inside where the temperature is kept at 60 ��C until the weights of the samples do not change. Then, the dried samples taken out of the molds are measured to record the basic data including diameters, weights, heights,etc. The average dimensions of the finished samples (Figures 3(b) and (c)) and shrinkage ratios are summarized in Table 3.
Except for the cylindrical samples with diameter of 20 mm (Sample I in Table 3), the other cylindrical samples with diameter of 42 and 100 mm (Sample II in Table 3) are processed by sanding and levelling the top and the bottom surfaces using fine sandpapers, so as to meet the height to diameter ratio (2:1) requirements as specified in GB/T 50123 [33].
2.4 Test methods
The porosity and mercury intrusion porosimetry tests are performed on the samples of about d20 mm��20 mm in Groups A and B. The porosity of these samples is measured by a gas porosimeter (KX-07F). Using a mercury intrusion porosimeter (YG-97A) with measurement range of pore diameter from 600 ��m to 30 nm, the mercury intrusion porosimetry test is made to determine the pore-throat size distribution of samples.
The P-wave velocities of the samples with the diameters of 42 and 100 mm are measured using a wave propagation test device (CTCOQYCS-A6).
For the samples of 42 mm in diameter and 84 mm in height in Group A, the unconfined compression tests (UCS) and the unconsolidated- undrained triaxial (UU) tests are conducted in accordance with GB/T 50123 [33]. Using a conventional strain-controlled compressive strength apparatus (YSH-2.0) manufactured by Soil Instrument of Nanjing Co. Ltd Universal, the tests for UCS are conducted at a constant loading rate of 1 mm/min. Using a TSZ-2.0 material testing machine, the UU tests are carried out under the confining pressure of 200, 400 and 800 kPa, and the axial constant loading rate is 0.09 mm/min. It should be noted that the dimensions of tested specimens are slightly different from those recommended by GB/T 50123 [33], i.e. 39 mm in diameter and 80 mm in height. This difference in the sample geometry deriving from the slightly variable shrinkage of the tested slurries is not eliminated to avoid the excessive disturbance to the samples.
Table 2 Rheological parameters of slurries used in preparing tested samples
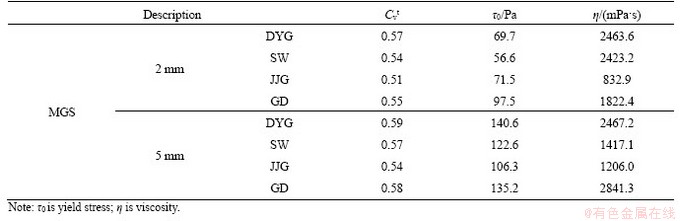
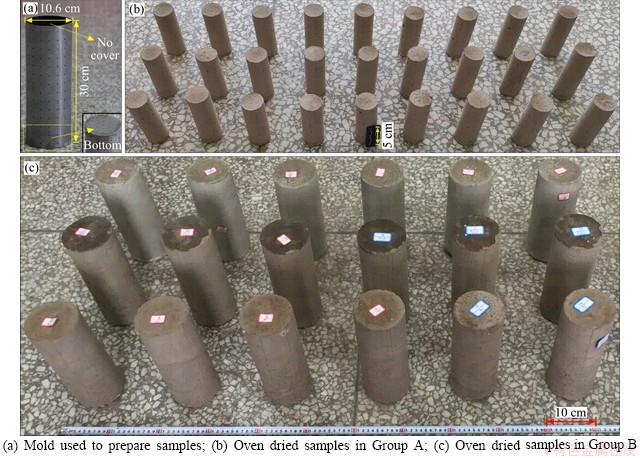
Figure 3 Close-up views:
Table 3 Summary of mold size, sample size, sample number, shrinkage ratio of prepared samples (RSA and VSA are radial shrinkage ratio and volumetric shrinkage ratio, respectively)
For the samples of 100 mm in diameter and 200 mm in height in Group B, the triaxial apparatus SJ-1A are used to conduct the UCS and UU tests. The UCS tests are conducted at a constant loading rate of 1.25 mm/min according to GB/T 50123 [33]. The UU tests are performed at the confining pressures of 100, 300 and 500 kPa, and the axial constant loading rate of 0.3 mm/min according to GB/T 50123[33].
3 Results
For the DYG, SW, JJG and GD deposits with maximum grain size (MGS)=2 mm and =5 mm, they can all be remolded into coherent, homogeneous cylinders with a maximum height of 25.6 cm (Table 3), which cannot be broken manually. All of the air dried samples appear very tight without visible fractures (Figure 4). For the JJG samples in Group A, even though the shrinkage rate is high (i.e. VSR=30.7 % as shown in Table 3), the samples remain intact without any visible fractures and shrinkage cracks.
The porosity (n) of the DYG, SW, JJG and GD samples in Groups A and B is quantified and the results of porosity are summarized in Table 4. The contrast in n values between different samples with same MGS is not significant, and the porosity of samples with MGS of 2 mm is similar to that of samples with MGS of 5 mm. For the samples in Group A, the average n values of DYG, SW, JJG and GD samples are 33%, 34%, 25% and 28%,respectively. For the samples in Group B, the average n values of DYG, SW, JJG and GD samples are 34%, 36%, 27% and 30%, respectively. The n values of the samples in Groups A and B obey the following sequence: nSW>nDYG>nGD>nJJG.
To better understand the pore network and its size distribution in the deposits, the mercury intrusion porosimetry tests are performed. The pore-throat radius distribution and penetration contribution rate curve of samples in Groups A and B are presented in Figures 4 and 5, respectively. The pore-throat radii of samples in Groups A and B are all in the range of 0.01-63 ��m, and the great majority of pores belong to ultramicropores (<5 ��m) and the micropores (5-30 ��m) [41]. However, the pore-throat size distributions between different samples are different. For the samples in Group A, the dominant size range of pore throat of DYG, SW, JJG and GD samples are about 0.16-10 ��m, 0.4- 10 ��m, 0.06-1 ��m and 0.06-2.5 ��m, respectively. For the Group B samples, the pore-throat sizes of DYG, SW, JJG and GD samples are mainly concentrated in 0.25-10 ��m, 0.4-10 ��m, 0.06-1.6 ��m, 0.1-2.5 ��m, respectively. The pore-throat size distribution is further quantified by the mean pore size (rm) [42]. For Group A samples, the rm of DYG, SW, JJG and GD samples are 2.47, 3.81, 0.46 and 1.41 ��m, respectively. For Group B samples, the rm of DYG, SW, JJG and GD samples are 3.36, 5.89, 2.20 and 1.49 ��m, respectively (Table 4).
According to the penetration contribution rate curve, these dominant pore sizes exert minor control on the permeability of samples compared to the pore throat greater than 10 ��m, especially for JJG and GD samples, which indicates that all the samples have low permeability. The median pore-throat radius (r50) positively related to permeability [43] are also calculated (Table 4) according to the pore-throat size distributions (Figures 4 and 5). For Group A samples, the r50 of DYG, SW, JJG and GD samples are 2.50, 3.98, 0.43 and 0.68 ��m, respectively. For Group B samples, the r50 of DYG, SW, JJG and GD samples are 2.74, 4.28, 0.47 and 0.63 ��m, respectively. The r50 values of the samples in Groups A and B meet the following magnitude relation: r50SW>r50DYG>r50GD> r50JJG. This suggests that the permeability of the samples in Groups A and B should also obey the sequence above.
Table 4 Summary of physico-mechanical parameters of tested samples
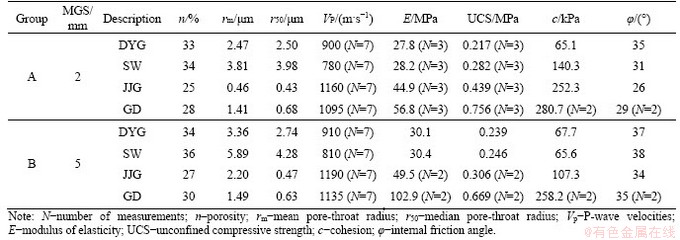
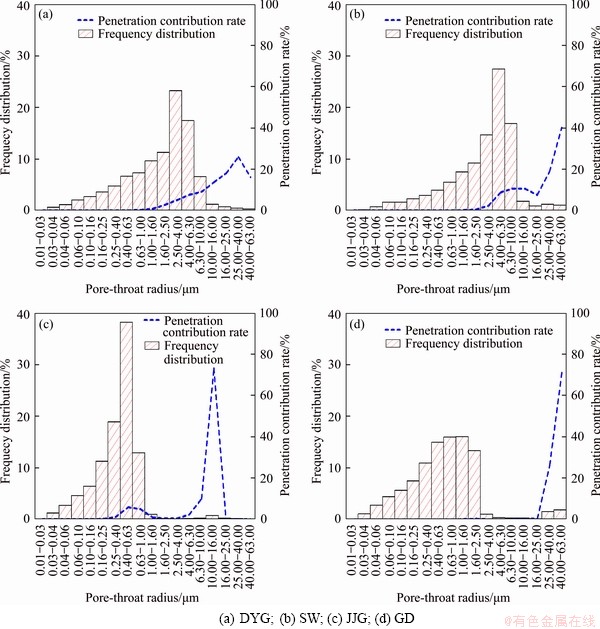
Figure 4 Pore-throat radius distributions and penetration contribution rate curves of samples in Group A:
No internal defect is detected with the wave propagation test device, and the average P-wave velocities (Vp) values of each seven samples with the same MGS and size from the DYG, SW, JJG and GD are summarized in Table 4. For all samples, the Vps in the samples with MGS=2 mm approach those in the sample with MGS=5 mm as seen in Table 4. The Vps in the samples of Group A and Group B fit the following order: VpJJG>VpGD> VpDYG>VpSW.
On the basis of the elastic portion of stress-strain curve obtained from unconfined compressive (UCS) test, the modulus of elasticity of different samples are calculated and presented in Table 4. The average modulus of elasticity (E) values (three samples) of the DYG, SW, JJG and GD samples in Group A are 27.8, 28.2, 44.9 and 56.8 MPa, respectively, and those of the above samples in Group B reach 30.1, 30.4 ,49.5 and 102.9 MPa, respectively.
Further, the average unconfined compressive strength (UCS) values (three samples) for the DYG, SW, JJG and GD samples in Group A are 0.217, 0.282, 0.439 and 0.756 MPa, respectively. The UCS values of the DYG, SW, JJG and GD samples in Group B are 0.239, 0.246, 0.306 and 0.669 MPa (the average of two samples for the JJG and GD), respectively (Table 4). The UCS values of the samples in Groups A and B meet the following magnitude relation: UCSGD>UCSJJG>UCSSW> UCSDYG.
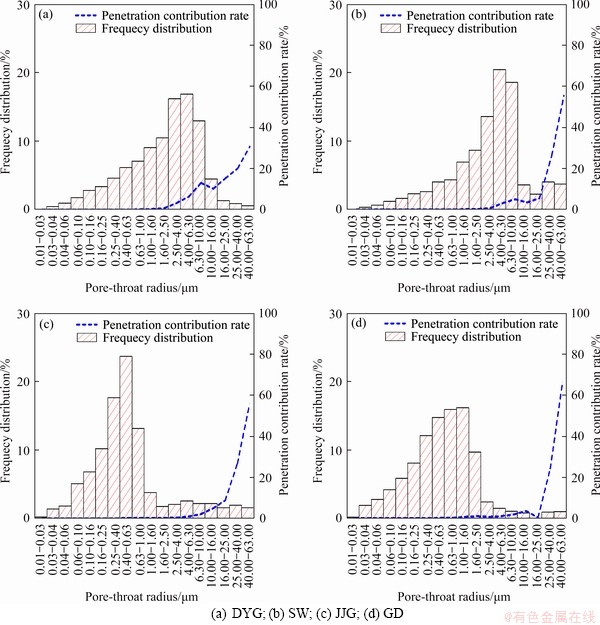
Figure 5 Pore-throat radius distributions and penetration contribution rate curves of samples in Group B:
For each sample from Groups A and B, at least three cylinders are used to perform the unconsolidated-undrained (UU) triaxial tests, and the cohesion (c) and internal friction angle (��) values are determined according to Mohr-Coulomb failure criterion. For the Group A samples, the shear strength indexes of the DYG, SW, JJG and GD samples are cDYG=65.1 kPa, ��DYG=35��; cSW=140.3 kPa, ��SW=31��; cJJG=252.3 kPa, ��JJG=26�� and cGD=280.7 kPa, ��GD=29�� (the average shear strength indexes for GD), respectively (Table 4). For the Group B samples, the shear strength indexes of the DYG, SW, JJG and GD samples are cDYG=67.7 kPa, ��DYG=37��; cSW=65.6 kPa, ��SW=38��; cJJG=107.3 kPa, ��JJG=34�� and cGD=258.2 kPa, ��GD=35�� (the average shear strength indexes for GD) respectively (Table 4). It is obvious that for the samples both with a diameter of 42 mm and with a diameter of 100 mm, the c values of the GD are significantly higher than those of the DYG, SW and JJG, and the �� values of the JJG are markedly lower than those of the DYG and SW and GD.
4 Discussion
4.1 Formability of tested deposits
The mixtures of the four debris-flow materials with maximum grain sizes (MGSs) =2 mm and 5 mm with water can be poured into coherent, homogeneous cylinders with a maximum height of 25.6 cm, and a series of formed deposits are made, which is unexpected, surprising, and undesignedly refines the description of a debris-flow deposit setting like a poor grade of concrete in the meantime [4, 15, 44].
Appearing as porous materials, few of natural loose soils [39, 45] in hillslopes and fans can be remolded into dense specific shapes. We infer that whether a sediment can be cast into competent cylinders with hundreds of kPa of unconfined compressive strength (UCS) can be regarded as an indicator of susceptibility to a debris flow or diagnostic of a debris-flow deposit, in combination with the work carried out at other sites in Yunnan, Sichuan and Gansu provinces of China. To confirm the distinctive shaping ability of debris-flow deposits, and to underpin the inference mentioned above, the sediments that do not derive from the debris-flow deposits, including granular flow deposits, fluvial deposits, residual lateritic clay and loess, are tested according to the methods described in Section 2.
The materials of granular flow deposits and fluvial deposits are collected from the DYG Gully. The thoughtful site investigations combined with an interpretation of aerial and satellite images reveal that kinematics of the DYG debris-flow event is very complex. Generally, it originated from gully wall collapses within the zero-order basins in the front of the snowline (elevation of about 3800 m). The collapse-debris flow draining northwestward into the main channel of DYG Creek at point C took the form of a granular flow [46, 47] in the upper channel, and evolved into the mature debris flow by incorporating water and sediment along the flow path near point D. Farther down, the debris flow travelled ~5.5 km until reaching the main stem of Nu River at 1403 m above sea level (Figure 6(a)).
The samples are the fine fraction (<2 mm and <5 mm) separated during the in-situ large volume sieving (over 200 kg, MGS=20 cm), which was undertaken at 14 sites along the event path in 2015. The sediment deposited by the 2010 DYG event could be easily recognized because only on this sediment is a dense stand of Alnus viridis seedlings growing throughout the floor and lowermost walls of DYG Valley [5, 48]. Here, the granular flow deposit from sieving sites G1, G2 and G3 (Figures 6(b)-(d)) and the pre-event fluvial deposit underlying the debris-flow deposit at sieving sites F (Figure 6(e)) are selected to perform comparative tests.
The grain size distributions of the two types of sediments are shown in Figure 7. For comparison purpose, this figure also contains the grain-size curves of the DYG debris-flow deposit shown in Figure 1, and shows significant variation in their sorting. From the debris flow through granular flow to stream, the grain size segregation of the sediments deposited by them is more obvious than one according to the curve patterns and Cu values, and the debris-flow deposit is significantly more poorly sorted compared to the latter two (Figure 7). As might be expected, the slurryability and formability of the deposits from the granular flow and stream are distinctly different from that of their counterpart��the DYG debris-flow deposit. First, when mixed with water regardless of water content, the two types of the deposits of both <2 mm and <5 mm tested here cannot form viscoplastic slurries in which water and debris are one and the same [15, 32] (Figures 8(a)-(d); (i)-(l)). Next, the mixtures of the debris and water cannot be poured into complete cylinders at all and the undisaggregated pieces can be easily broken with hand, meaning that they have nearly zero UCS (Figures 8(e)-(h); (m)-(p)).
Further, the natural unconsolidated sediments, including residual lateritic clay samples with MGS <2 mm (collected from Chenggong in Yunnan provinces (24��51��30.55��N/102��52��23.99��E)) and loess samples with MGS <2 mm (sampled from Longxi in Gansu provinces (35��13��43.74��N/ 104��27��17.02��E)), are also tested following the methods described in Section 2. It is clearly seen from Figure 10 that both residual lateritic clay and loess cannot be remolded into complete cylinders when mixed with water, even a cylinders with a maximum height of around 25 mm (Figure 9(a)).
Therefore, the formability of a sediment in hillslopes and on fan regions, and subsequent unconfined compressive strength (UCS) of the formed samples may serve as a diagnostic characteristic of debris-flow initiation and old debris-flow deposits.
4.2 Obtained parameters and indications on sediment characteristics
The results reported in Section 3 suggest that the values of the physico-mechanical parameters of the samples from the four different debris-flow events in Group A approach those of their counterparts in Group B, which might be attributed to the small maximum grain size (MGS) contrast between the two groups.
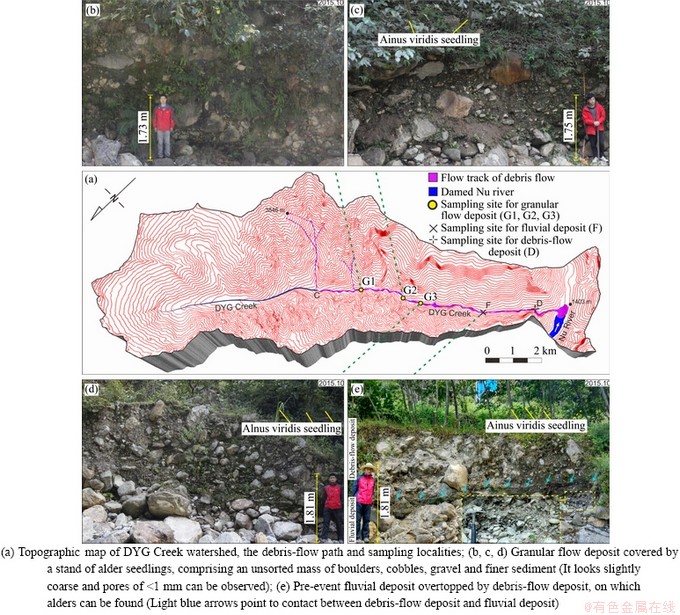
Figure 6 DYG debris-flow track and sampling strategies for granular flow deposit and fluvial deposit:
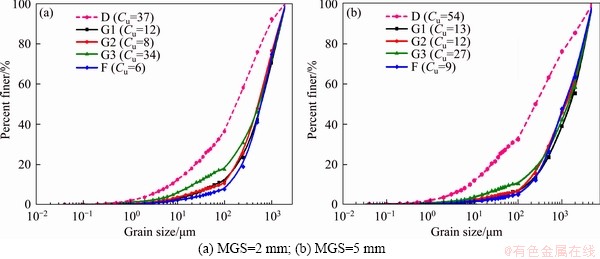
Figure 7 Grain size distributions (GSDs) of granular flow deposit in DYG debris flow event (G1 to G3), pre-event fluvial deposit (F), and their counterpart-the DYG debris-flow deposit (D):
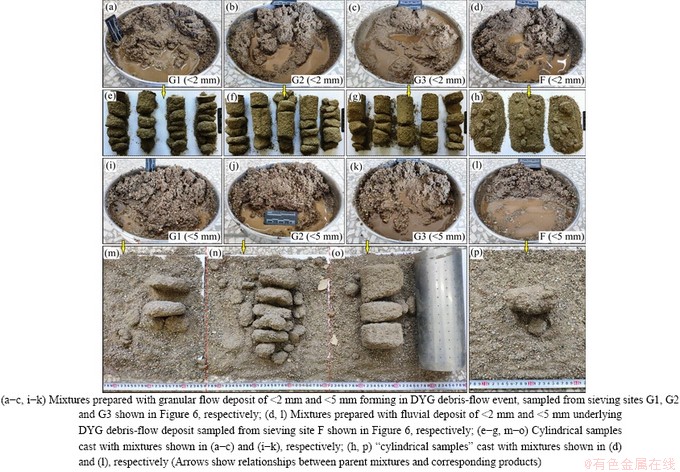
Figure 8 Admixtures of non-debris flow sediments from DYG Creek with water and samples poured with these mixtures for unconfined compression test following the procedure described in Section 2:
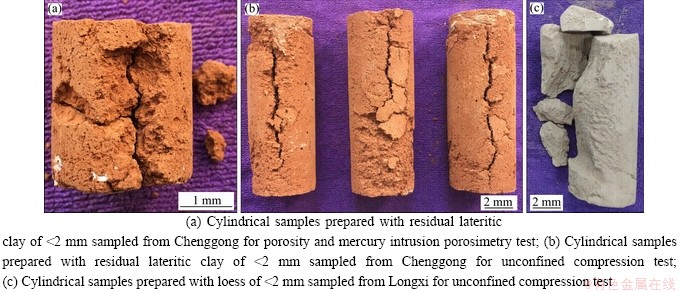
Figure 9 Cylindrical samples poured with admixtures of residual lateritic clay and loess with water for physico- mechanical tests following procedure described in Section 2:
The physical parameter (porosity, n; mean pore-throat radius, rm; median pore-throat radius, r50; P-wave velocities, Vp), elastic deformation parameter (elastic modulus, E) and strength parameters (unconfined compressive strength, UCS; cohesion, c) are independent of each other. However, their magnitudes should be functions of the packing of grains according to individual connotations [37, 40, 45], that is, the n, rm and r50 values are inversely proportional to the densification of tested samples, and the Vp, E, UCS and c values are directly proportional to the densification of tested samples. Table 4 indicates that both for Groups A and B, the values of the above parameters of the DYG approximate those of their counterparts in the SW, but are largely different from those of their equivalents in the JJG and GD. The changes of the seven parameters between the different types of the samples are coordinated. Interestingly, the internal friction angle (��) does not follow the variation pattern of the above seven parameters between the JJG-GD and the DYG-SW samples (Table 4). The discrepancy originates mainly from the fact that �� can be influenced by the shapes of coarse debris, fine grain contents and debris compositions besides the densification of tested samples, as discussed below. So, the combination of n, rm, r50, Vp, E, UCS and c can characterize debris flow-related sediments.
The reconstituted samples with high densification and strengths can be viewed as the combined expression of the diagnostic characteristics favoring debris-flow occurrence, and the differences in the physico-mechanical behaviors of the four debris flow deposits should result from the discrepancy in the composition of the assemblage of favoring factors for debris flows, that is, the four deposits embody different diagnostic characteristics of debris flows.
4.2.1 Sorting of particles
The evidences from the filed observations and laboratory tests have shown that most debris-flow deposits are poorly sorted [20, 26, 49, 50]. Further, the (extremely) poor sorting of debris has been identified as one of the primary controls on debris flows. The Cus for all the samples from the DYG, SW, JJG and GD debris-flow deposits are significantly larger than the threshold of 4-6 for poorly sorted soils [45], and extremely poorly sorted. Some are, even unsorted (sufficiently well graded in the parlance of engineering), which can be told from the grading curves (Figure 2).
The porosity and pore-throat radius distribution of samples are more closely related to the particle size distributions of comprising materials [43, 51]. The low porosity ratio (e<0.6), mean pore-throat radius (0.46-5.89 ��m), and median pore-throat radius (0.43-4.28 ��m) of cylinder samples (Table 4) imply that the comprising materials of the experimental samples are poorly sorted [49]. Further, the high P-wave velocities (Vp) of the testing cylinders also verify that the intergranular pores in the samples and porosities of the samples are all very small, which enables the stress wave in the samples to propagate without much disturbance. In the same way, only porous materials with low porosity and pore-throat size can have high Vp, modulus of elasticity (E), unconfined compressive strength (UCS) and cohesion (c) values similar to those shown in Table 4. Further, according to the packing theory, only the poorly sorted debris can be packed into deposits with a low porosity and pore-throat size.
Based on the analysis of the mechanism, the high strengths of the tested debris-flow deposits suggest the poor sorting of the comprising debris, which is in reasonable agreement with the results of the granular analysis of the tested materials. Poor sorting is essential, but it is an insufficient condition for generating sediments of high strengths.
4.2.2 Mineral composition of fines
Typical clay minerals including kaolinite, montmorillonite and illite [40] have been recognized as an important favoring factor for debris-flow formation by many authors [47, 49, 52].
Among the four types of samples, the JJG and GD samples have the higher P-wave velocities (Vp), unconfined compressive strength (UCS) and cohesion (c) values and lower porosity (n), mean pore-throat radius (rm), median pore-throat radius (r50) and internal friction angle (��) values (Table 4), which can be attributed to the abundant illite in the two deposits. As shown in Figure 2, the contents of illite in the clay fraction of JJG and GD deposit are, respectively, up to 55% and 35%, which agrees with their cation exchange capacity (CEC) and plasticity index. This concentration of typical clay minerals is very high, even extremely high among debris-flow deposits [50, 52]. The observations with a field-emission scanning electron microscopy (FESEM, FEI Nova Nano SEM 450) for the fine fraction further present abundance of illite in the testing samples of JJG (Figures 10(a)-(c)) and GD (Figures 10(d)-(f)).
Under FESEM, it can be clearly seen that the flaky illite crystals have sheet-phyllo structure, and are less than 5 ��m in dimension. Furthermore, it is interesting to note that although the FESEM samples are prepared by means of fine particles settling in water, the illite scraps are not parallel to each other (Figures 10(a) and (f)). This may be considered as the expression of dispersive behavior of illite, as dispersion is one of the main mechanisms of typical clay minerals, which facilitates debris slurrying.
The abundant illite with large specific surface area in the JJG and GD deposit contributes to the high Vp, UCS, c values, and the low n, rm, r50, �� values of the testing samples. The contributions of illite are derived from its effect of pore-filling and muddy cementation, which markedly reduces the total pore volume and the size of the intra-aggregate and inter-aggregate pores of deposits, thereby elevating the densification and strength of the JJG (Figures 11(a) and (e)) and GD (Figures 12(b) and (f)) samples. The low �� values of the JJG and GD samples are caused by the illite lowering the contact friction between the other clasts.
4.2.3 Accidental detritus
Although lower than those of the JJG and GD samples, the P-wave velocities (Vp), unconfined compressive strength (UCS) and cohesion (c) values of the DYG and SW samples are still significantly higher than those of natural unconsolidated sediments. It is inexplicable that the typical clay mineral is not included in DYG and SW deposits (Figure 2), the fractions with MGS= 0.5 mm of which are classified as silt. Further, the fractured surfaces of the tested DYG (Figures 11(c), and (g)) and SW (Figure 11(d) and (h)) cylinders all show a rough appearance. In addition, it is worthy to note that the UCS and c values of GD deposit are remarkably higher than those of JJG deposit. This puzzling phenomenon implies that some additional factors promoting the occurrence of the DYG, SW and GD debris flows and helping the formation of the high Vp, UCS and c values of their deposits also exist.
As described above, the organic matter contents (OMC) quantifying SWD in the fractions both <0.075 and <2 mm of the DYG, SW and GD deposits are far higher than those of JJG deposit. In addition, even with the absence of typical clay mineral, the cation exchange capacity (CEC) for the fractions of the DYG and SW deposits with the particle size <0.075 mm are still up to 6.86 and 9.40 cmol/kg, respectively. At the same time, the CEC of the GD deposit is also remarkably higher than that of the JJG deposit. Combining the visual observations in the laboratory (Figure 11) with the analysis results of OMC and CEC, it may be reasonably inferred that SWD should play an important role in the generations of their high Vp, E, UCS and c values.
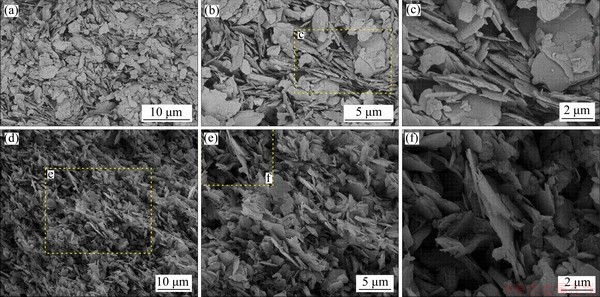
Figure 10 FESEM images of clay-sized fractions (<0.005 mm) separated from JJG (a-c) and GD (d-f) deposits

Figure 11 Mesoscopic structures of prepared samples with four debris-flow deposits for physico-mechanical laboratory tests:((d, h, i, j) show SWD packed in DYG and SW cylinders)
Owing to its low density and rough surface (i.e. large specific surface area), SWD with a strong ability of absorbing fine debris can apparently facilitate the formation of dense deposits. This is in agreement with the conclusion that the presence of soil organic matter may increase the cohesion of aggregates [53].
The SWD <2 mm in diameter separated from the DYG and SW field debris-flow deposits is densely wrapped with finer particles. In spite of having been disturbed several times by in situ sampling, laboratory sieving and manual picking, etc., the SWD under FESEM shows a surprising cementing ability to fines (see Figure 12 by TANG et al [28] for detailed descriptions). Since the disturbances for the samples are relatively slight, Figures 11(d, h, i, j) show that the cementing and reinforcing of SWD are more conspicuous in the testing cylindrical samples, and the SWD can be recognized only by their shapes. Therefore, SWD is one of the important contributors of the high strengths of the testing DYG, SW and GD samples, and can be viewed as one of debris flow-related diagnostic features in well-vegetated alpine areas.
In summary, the physico-mechanical properties of remolded deposits can give valuable indications on the diagnostic characteristics favoring debris-flow formation. Although it is not feasible to develop unified standard values of porosity (n), mean pore-throat radius (rm), median pore-throat radius (r50), P-wave velocities (Vp), modulus of elasticity (E), unconfined compressive strength (UCS) and cohesion (c) for potential debris-flow source materials and existing debris- flow deposits, the findings that the sediments from debris-flow deposits can be remolded into coherent, homogeneous cylinders with high strengths can provide an important reference for debris-flow studies, including assessment of debris-flow susceptibility and historical debris-flow deposit identification.
4.3 Classification of tested materials and implications
In addition to the above molding potentials of sediments and characterizing parameters for the remolded columns, the magnitudes of porosity (n), mean pore-throat radius (rm), median pore-throat radius (r50), P-wave velocities (Vp), modulus of elasticity (E), unconfined compressive strength (UCS) and cohesion (c) (Table 4) are also noteworthy, i.e. whether the samples with these index properties are rocks or soils needs to be discussed.
Because the limit that separates soft rocks from soils, to date, is not well defined [54], especially due to their peculiarities, the tested samples could not be exactly located even in the relatively detailed classification given by ISRM [55]. According to ISRM [55], the SW, JJG and GD in both Group A and Group B can be identified as extremely weak rocks with a UCS range of 0.25-1.0 MPa.
Unfortunately, we could not find the DYG a corresponding location in existing soil classifications. The soil classification based on the UCS applies only to cohesive soils [33, 40, 45, 55, 56]. The DYG deposit exhibits a typical sandy-silt matrix, but the fractions with MGS=2 and 5 mm can be remolded into the standard specimens needed for UCS tests and the prepared samples have UCS values of over 0.2 MPa. Obviously, it is still difficult to give the DYG deposit an appropriate name according to the current classifications of earth materials. In view of the qualitative definition of soil and rock [37, 40], it seems relatively reasonable to think of the DYG samples as hard soils. Thus, the tested debris-flow deposits may be roughly classified as hard soil-soft rocks.
As used here, the term, hard soil-soft rock, however, is only a physico-mechanical concept and quite different from that used in the literature [57-60]. Compared to the latter, debris-flow deposits are the newly deposited materials, except for those ancient ones taking the form of intercalations on stratigraphic sections. Nevertheless, the fine fractions (<5 mm) of these fresh sediments can be surprisingly remolded into dense cylinders (n of 25%-36%, rm of 0.46-5.89 ��m, r50 of 0.43-4.28 ��m, Vp of 800-1200 m/s) with high values of the mechanical parameters (E of 28-103 MPa, UCS of 220-760 kPa, as well as c of 65-281 kPa).
The above behavior properties of debris-flow deposits give valuable indications on debris flows as well as some processes operating behind them. Undoubtedly, wide grading and poor sorting of debris are necessary for the formation of the deposits with high strength [13, 15]. Most debris flows originate from the gully wall failures in the source areas [61, 62], and initial landslide deposits do not inherently contain a very wide spectrum of grain sizes. Therefore, the debris torrents observed at points of interest should be a result of sediment entrainment along channels following wall failures near gully heads [63-65]. Equally important, the results presented above support the view that debris torrents are one-phase flows [15, 32]. The viscous fluids in motion behave somewhat like magma and eventually come to rest somewhere to form cohesive diamictons with massive structure.
5 Conclusions
A series of laboratory analyses, observations and tests are carried out to characterize the integrated properties of the sediments capable of changing into debris flows, for debris-flow hazard assessment, recognition of old debris-flow deposits, and in-depth understanding of debris-flow processes.
1) The four debris-flow materials with maximum grain sizes (MGSs) of 2 and 5 mm from the Dongyuege (DYG), Shawa (SW), Jiangjia Gully (JJG) and Gengdi (GD) debris flows occurring in southwest China can all be remolded into coherent, homogeneous cylinders with a maximum height- diameter ratio of 2.8 and a maximum height of 25.6 cm. In view of the results of the contrast tests on the debris-flow deposits, granular flow deposits, fluvial deposits, residual lateritic clay and loess, whether a sediment can be cast into competent cylinders for unconfined compressive strength tests can be regarded as a diagnostic evidence of ancient debris-flow deposits.
2) The discrepancy in physico-mechanical properties between the four different debris-flow deposits indicates that the combination of the porosity, mean pore-throat radius, median pore- throat radius, P-wave velocity, modulus of elasticity, UCS, and cohesion can characterize assembling characteristics of debris flow-related sediments (i.e., grain size distributions, mineralogy of fine particles, and accidental detritus such as small wood debris). Although it is not feasible to develop unified standard values of foregoing physico- mechanical parameters for existing debris-flow deposits, the findings that the sediments from debris-flow deposits can be remolded into coherent, homogeneous cylinders with high densification and strength may be applied to evaluate the susceptibility to debris flows and to identify old debris-flow deposits.
3) Despite the fact that the tested materials are the newly deposited sediments, they can be classified as hard soil-soft rocks according to UCS, and it is inferred that other debris-flow deposits elsewhere would fall into this range.
4) The high densification and strength of the tested deposits suggest that sediment entrainment along torrential paths is of importance for the formation of mature debris-flow materials, and the subsequent debris flows should be viewed as one-phase flows.
Contributors
YANG Kui carried out data curation, data processing and wrote the the first draft of the manuscript. XU Ze-min designed the project, performed data analysis, and contributed to the paper writing. All authors replied to reviewers�� comments and revised the final version.
Conflict of interest
The authors declare no conflict of interests.
References
[1] SOHN Y K, RHEE C W, KIM B C. Debris flow andhyperconcentrated flood-flow deposits in an alluvial fan, Northwestern part of the Cretaceous Yongdong basin, Central Korea [J]. The Journal of Geology, 1999, 107(1): 111-132. DOI: 10.1016/j.ge omorph.2013.03.01510.1086/31 4334.
[2] LIN P S, LIN J Y, HUNG J C, YANG M D. Assessing debris-flow hazard in a watershed in Taiwan [J]. Engineering Geology, 2002, 66(3, 4): 295-313. DOI: 10.1016/S0013- 7952(02)001 05-9.
[3] SOHN Y K. Coarse-grained debris-flow deposits in the Miocene fan deltas, SE Korea: A scaling analysis [J]. Sedimentary Geology, 2000, 130(1, 2): 45-64. DOI: 10.1016/S0037-0738(99)00099-8.
[4] IVERSON R M. The physics of debris flows [J]. Reviews of Geophysics, 1997, 35(3): 245-296. DOI: 10.1029/97RG0 0426.
[5] MORTON D M, ALVAREZ R M, RUPPERT K R, GOFORTH B. Contrasting rainfall generated debris flows from adjacent watersheds at Forest Falls, Southern California, USA [J]. Geomorphology, 2008, 96(3): 322-338. DOI: 10.1016/ j.geomorph.2007.03.021.
[6] YANG K, XU Z M, TIAN L, WANG K, REN Z, TANG Y J, LUO J Y, GAO H Y. Significance of coarse clasts in viscous debris flows [J]. Engineering Geology, 2020, 272: 105665. DOI: 10.1016/j.enggeo.2020.105665.
[7] OGUCHI T, OGUCHI C T. Late quaternary rapid talus dissection and debris flow deposition on an alluvial fan in Syria [J]. Catena, 2004, 55(2): 125-140. DOI: 10.1016/ S0341-8162(03)00112-7.
[8] NI H Y, ZHENG W M, LIU X L, GAO Y C. Fractal- statistical analysis of grain-size distributions of debris-flow deposits and its geological implications [J]. Landslides, 2011, 8(2): 253-259. DOI: 10.1007/s10 346-010-0240-x.
[9] LI Y, ZHOU X J, SU P C, KONG Y D, LIU J J. A scaling distribution for grain composition of debris flow [J]. Geomorphology, 2013, 192: 30-42. DOI: 10.1016 /j.geomorph.2013.03.015.
[10] D��ARCY M, RODA-BOLUDA D C, WHITTAKER A C. Glacial-interglacial climate changes recorded by debris flow fan deposits, Owens Valley, California [J]. Quaternary Science Reviews, 2017, 169: 288-311. DOI: 10.1016/ j.quascirev.2017.06.002.
[11] WEBB R H, GRIFFITHS P G, RUDD L P. Holocene debris flows on the Colorado Plateau: The influence of clay mineralogy and chemistry [J]. Geological Society of America Bulletin, 2008, 120(7): 1010-1020. DOI: 10.1130/B26055.1.
[12] DETIENNE M, DELMELLE P, GUEVARA A, SAMANIEGO P, OPFERGELT S, MOTHES P A. Contrasting origin of two clay-rich debris flows at cayambe volcanic complex, Ecuador [J]. Bulletin of Volcanology, 2017, 79(4): 27. DOI: 10.1007/s00 445-017-1111-2.
[13] de BLASIO F V, BREIEN H, ELVERHOI A. Modelling a cohesive-frictional debris flow: An experimental, theoretical, and field-based study [J]. Earth Surface Processes and Landforms, 2010, 36(6): 753-766. DOI: 10.1002/esp.2101.
[14] KANG H S, KIM Y T. Rheological properties of loose sands subjected to upward flow [J]. Canadian Geotechnical Journal, 2017, 54(5): 664-673. DOI: 10.1139/cgj-2016-0171.
[15] JOHNSON A M, RODINE J R. Debris flow [M]// Slope Instability. Chichester: Wiley, 1984: 257-361.
[16] MAJOR J J, PIERSON T C. Debris flow rheology: Experimental analysis of fine-grained slurries [J]. Water Resources Research, 1992, 28: 841-857. DOI: 10.1029/ 91WR02834.
[17] HUBL J, STEINWENDTNER H. Estimation of rheological properties of viscous debris flow using a belt conveyor [J]. Physics and Chemistry of the Earth, Part B: Hydrology Oceans and Atmosphere, 2000, 25(9): 751-755. DOI: 10.1016/S1464-1909(00)000 97-6.
[18] JEONG S W, LOCAT J, LEROUEIL S, MALET J P. Rheological properties of fine-grained sediment: The roles of texture and mineralogy [J]. Canadian Geotechnical Journal, 2010, 47(10): 1085-1100. DOI: 10.1139/T1 0-012.
[19] MAY C L, GRESSWELL R E. Spatial and temporal patterns of debris-flow deposition in the Oregon Coast Range, USA [J]. Geomorphology, 2004, 57(3, 4): 135-149. DOI: 10.1016/S0169-555X(03)0 0086-2.
[20] LOPES L D C F L, BACELLAR L D A P, CASTRO P D T A. Assessment of the debris-flow susceptibility in tropical mountains using clast distribution patterns [J]. Geomorphology, 2016, 275: 16-25. DOI: 10.1016/ j.geomorph.2016.09.026.
[21] WILFORD D J, SAKALS M E, INNES J L, SIDLE R C, BERGERUD W A. Recognition of debris flow, debris flood and flood hazard through watershed morphometrics [J]. Landslides, 2004, 1(1): 61-66. DOI: 10.1007/s10346-003- 0002-0.
[22] SANTANGELO N, DAUNIS-I-ESTADELLA J, DI CRESCENZO G, DI DONATO V, FAILLACE P I, MARTIN-FERNANDEZ J A, ROMANO P, SANTO A, SCORPIO V. Topographic predictors of susceptibility to alluvial fan flooding, Southern Apennines [J]. Earth Surface Processes and Landforms, 2012, 37: 803-817. DOI: 10.1002/esp.3197.
[23] KAIN C L, RIGBY E H, MAZENGARB C. A combined morphometric, sedimentary, GIS and modelling analysis of flooding and debris flow hazard on a composite alluvial fan, Caveside, Tasmania [J]. Sedimentary Geology, 2018, 364: 286-301. DOI: 10.1016/j.sedgeo.2017.10.005.
[24] BREVIK E C, REID J R. Differentiating till and debris flow deposits in glacial landscapes [J]. Soil Survey Horizons, 2000, 41: 83-90.DOI:10.2136/sh2000.3.0083.
[25] de SCALLY F A, OWENS I F, LOUIS J. Controls on fan depositional processes in the schist ranges of the Southern Alps, New Zealand, and implications for debris-flow hazard assessment [J]. Geomorphology, 2010, 122(1): 99-116. DOI: 10.1016/j.geomorp h.2010.06.002.
[26] de SCALLY F A, OWENS I F. Depositional processes and particle characteristics on fans in the Southern Alps, New Zealand [J]. Geomorphology, 2005, 69(1): 46-56. DOI: 10.1016/j.geomorph.2004.11.021.
[27] ZHOU Z H, REN Z, WANG K, TANG Y J, TIAN L, XU Z M. Effect of excess pore pressure on the long runout of debris flows over low gradient channels: A case study of the Dongyuege debris flow in Nu River, China [J]. Geomorphology, 2018, 308: 40-53. DOI: 10.1016 /j.geomorph.2018.01.012.
[28] TANG Y J, XU Z M, YANG T Q, ZHOU Z H, WANG K, REN Z, YANG K, TIAN L. Impacts of small woody debris on slurrying, persistence, and propagation in a low-gradient channel of the Dongyuege debris flow in Nu River, Southwest China [J]. Landslides, 2018, 15: 2279-2293. DOI: 10.1007/s10346-018-1036-7.
[29] LAN H X, ZHOU C H, WANG L J, ZHANG H Y, LI R H. Landslide hazard spatial analysis and prediction using GIS in the Xiaojiang watershed, Yunnan, China [J]. Engineering Geology, 2004, 76(1, 2): 109-128. DOI: 10.1016/j.enggeo. 2004.06.009.
[30] GUO X J, CUI P, LI Y. Debris flow warning threshold based on antecedent rainfall: A case study in Jiangjia Ravine, Yunnan, China [J]. Journal of Mountain Science, 2013, 10(2): 305-314. DOI: 10.1007/s11629-013-2521-z.
[31] MARCHI L, ARATTANO M, DEGANUTTI A M. Ten years of debris-flow monitoring in the Moscardo Torrent (Italian Alps) [J]. Geomorphology, 2002, 46(1, 2): 1-17. DOI: 10.1016/S0169-555X(01)00162-3.
[32] COUSSOT P, MEUNIER M. Recognition, classification and mechanical description of debris flows [J]. Earth-Science Reviews, 1996, 40(3, 4): 209-227. DOI: 10.1016/0012- 8252(95)00065-8.
[33] GB/T 50123. Standard for soil test method [S]. 1999. (in Chinese)
[34] IVERSON R M, LOGAN M, LAHUSEN R G, BERTI M. The perfect debris flow? Aggregated results from 28 large-scale experiments [J]. Journal of Geophysical Research Atmospheres, 2010, 115: F03005. DOI: 10.1029/ 2009JF001514.
[35] LY/T 1243. Determination of cation exchange capacity in forest soil [S]. Beijing: The State Forestry Administration of the People��s Republic of China, 1999. (in Chinese)
[36] GB 50021. Code for investigation of geotechnical engineering [S]. Beijing: Ministry of Housing and Urban-Rural Construction of the People��s Republic of China, 2001. (in Chinese)
[37] TERZAGHI K, PECK R B, MESRI G. Soil mechanics in engineering practice [M]. 3rd ed. New York: Wiley, 1996: 19-21.
[38] MALET J P, LAIGLE D, REMAiTRE A, MAQUAIRE O. Triggering conditions and mobility of debris flows associated to complex earthflows [J]. Geomorphology, 1996, 66(1-4): 215-235. DOI: 10.1016/j.geomorph.2004.0 9.014.
[39] HOLTZ R D, KOVACS W D, SHEAHAN T C. An Introduction to Geotechnical Engineering [M]. 2nd ed. US: Pearson Education, Inc., 2011.
[40] National Engineering Handbook, Chapter 3-Engineering classification of earth materials�� [S]. Washington, DC, U.S.: Department of Agriculture-Natural Resources Conservation Service, 2012.
[41] LU S G, YU X L, ZONG, Y T. Nano-microscale porosity and pore size distribution in aggregates of paddy soil as affected by long-term mineral and organic fertilization under ricewheat cropping system [J]. Soil and Tillage Research, 2019, 186: 191-199. DOI: 10.1016/j.still.2018.10.008.
[42] CUETO N, BENAVENTE D, MARTINEZ-MARTINEZ J, GARCIA-DEL-CURA M A. Rock fabric, pore geometry and mineralogy effects on water transport in fractured dolostones [J]. Engineering geology, 2009, 107(1, 2): 1-15. DOI: 10.1016/j.enggeo.2009. 03.009.
[43] LALA A M S, EL-SAYED N A A. Controls of pore throat radius distribution on permeability [J]. Journal of Petroleum Science and Engineering, 2017, 157: 941-950. DOI: 10.1016/j.petrol.2017.08.005.
[44] PHILLIPS C J. Rheological investigation of debris flow material [D]. New Zealand: University of Lincoln, 1988.
[45] DAS B M. Advanced soil mechanics [M]. 3rd ed. New York: Taylor & Francis, 2008.
[46] PIERSON T C, COSTA J E. A rheologic classification of subaereal sediment-water flows [M]// Debris Flows/Avalanches: Process, Recognition, and Mitigation. United States: Boulder Co., 1987: 1-12.
[47] SCOTT K M, VALLANCE J W, PRINGLE P T. Sedimentology, behavior, and hazards of debris flows at mount rainier, Washington [J]. U S. Geological Survey Professional Paper, 1995, 1547: 1-56.
[48] CISLAGHI A, RIGON E, LENZI M A, BISCHETTI G B. A probabilistic multidimensional approach to quantify large wood recruitment from hillslopes in mountainous-forested catchments [J]. Geomorphology, 2018, 306: 108-127. DOI: 10.1016 /j.geomorph.2018.01.009.
[49] RODINE J D, JOHNSON A M. The ability of debris, heavily freighted with coarse clastic materials, to flow on gentle slopes [J]. Sedimentology, 1976, 23(2): 213-234. DOI: 10.1111/j.1365-3091.1976.tb0 0047.x.
[50] PIERSON T C. Dominant particle support mechanism in debris flows at MT Thomas, New Zealand, and implications for flow mobility [J]. Sedimentology, 1981, 28(1): 49-60. DOI: 10.1111/j.1365-3091.198 1.tb01662.x.
[51] SASANIAN S, NEWSON T A. Use of mercury intrusion porosimetry for microstructural investigation of reconstituted clays at high water contents [J]. Engineering Geology, 2013, 158: 15-22. DOI: 10.1016/j.enggeo.2013.03.002.
[52] KAITNA R, RICKENMANN D, SCHATZMANN M. Experimental study on rheologic behaviour of debris flow material [J]. Acta Geotechnica, 2007, 2(2): 71-85. DOI: 10.1007/s11440-007-0026-z.
[53] CHENU C, BISSONNAIS Y L, ARROUAYS D. Organic matter influence on clay wettability and soil aggregate stability [J]. Soil Science Society of America Journal, 2000, 64(4): 1479-1486. DOI: 10.2136/sssaj2000.6441479x.
[54] FESTA V, FIORE A, LUISI M, MICCOLI M N, SPALLUTO L. Petrographic features influencing basic geotechnical parameters of carbonate soft rocks from Apulia (Southern Italy) [J]. Engineering geology, 2018, 233: 76-97. DOI: 10.1016/j.enggeo.2017.12.009.
[55] International Society for Rock Mechanics (ISRM). Suggested methods for the quantitative description of discontinuities in rock masses [J]. International Journal of Rock Mechanics and Mining Sciences and Geomechanics Abstract, 1978, 15(6): 319-368. DOI: 10.1016/0148- 9062(78)9147 2-9.
[56] ASTM D2166M-16. Standard test method for unconfined compressive strength of cohesive soil [S]. United States: The American Society for Testing and Materials, 2000.
[57] ERCOLI L, ZIMBARDO M, NOCILLA A. Rock decay phenomena and collapse processes in the ��Latomiae del Paradiso�� in Syracuse (Sicily) [J]. Engineering Geology, 2014, 178(23): 155-165. DOI: 10.1016/j.enggeo.2014.06. 015.
[58] PARK D, MICHALOWSKI R L. Three-dimensional stability analysis of slopes in hard soil/soft rock with tensile strength cut-off [J]. Engineering Geology, 2017, 229: 73-84. DOI: 10.1016/j.enggeo. 2017.09.018.
[59] MARGHERITA Z, CLAUDIO C, LAURA E, ALESSANDRA N. A risk assessment proposal for underground cavities in Hard Soils-Soft Rocks [J]. International Journal of Rock Mechanics and Mining, 2018, 103: 43-54. DOI: 10.1016/ j.ijrmms.2018.01.024.
[60] OMAR H, AHMAD J, NAHAZANAN H, MOHAMMED T A, YUSOFF Z M. Measurement and simulation of diametrical and axial indirect tensile tests for weak rocks [J]. Measurement, 2018, 127: 299-307. DOI: 10.1016 /j.measurement.2018.05.067.
[61] REMAITRE A, MALET J P, MAQUAIRE O. Geomorphology and kinematics of debris flows with high entrainment rates: A case study in the south French Alps [J]. Comptes Rendus Geosciences, 2011, 343(11): 777-794. DOI: 10.1016/j.crte.2011.09.007.
[62] LEGG N T, MEIGS A J, GRANT G E, KENNARD P. Debris flow initiation in proglacial gullies on Mount Rainier, Washington [J]. Geomorphology, 2014, 226: 249-260. DOI: 10.1016/ j.geomorph.2014.08.003.
[63] GODT J W, COE J A. Alpine debris flows triggered by a 28 July 1999 thunderstorm in the central Front Range, Colorado [J]. Geomorphology, 2007, 84(1, 2): 80-97. DOI: 10.1016/j.geomorph.2006.07. 009.
[64] CHIARLE M, IANNOTTI S, MORTARA G, DELINE P. Recent debris flow occurrences associated with glaciers in the Alps [J]. Global and Planetary Change, 2007, 56(1): 123-136. DOI: 10.1016/j.gloplacha.2006.07. 003.
[65] GUTHRIE R, HOCKIN A, COLQUHOUN L, NAGY T, EVANS S G, AYLES C. An examination of controls on debris flow mobility: Evidence from coastal British Columbia [J]. Geomorphology, 2010, 114(4): 601-613. DOI: 10.1016/j.geomorph.2009.09.021.
(Edited by FANG Jing-hua)
���ĵ���
��ʯ���ѻ���������ѧ��Ϊ
ժҪ��Ϊ��������ʯ���ѻ�ʶ��İ붨��-�����������ĶԶ��¸���ɳ�ߡ����ҹ��������Ĵ���ʯ���ѻ���������ѧ��Ϊ������ϵͳ�о���ʵ�鷢�֣�������ʯ�����϶��ܱ�����Ϊ���ֱ�������߶ȷֱ�Ϊ100 mm��256 mm�����п�״������������塣��������Ŀ�϶�ȡ�ƽ�����뾶����ֵ���뾶��P�����ٷֱ�Ϊ25%~36%��0.46~5.89 ��m��0.43~4.28 ��m��800~1200 m/s������ģ��������ѹǿ�Ⱥ��ھ����ֱ�Ϊ28~103 MPa��220~760 kPa (Ӳ��������)��65~281 kPa��ͨ���Աȿ���������������л���ճ���������ijɽ�-�����������֣��������ܷ����ܳɿɽ��е��Όѹ����������ܱ���Ϊ����ʯ���ѻ����ж����ݡ����ϱ��������ܹ���ӳ��ͬ��ʯ���ѻ���������ɡ�ϸ��м����ɷּ���м��ʯ���͵ȷ���IJ��졣
�ؼ��ʣ���ʯ����س����������ѧ��Ϊ����ʯ�����ԣ���ʯ���ֺ����ۣ�����-Ӳ��
Foundation item: Project(41931294) supported by the National Natural Science Foundation of China; Projects(U1502232, U1033601) supported by the National Natural Science Foundation of China-Yunnan Joint Fund
Received date: 2020-02-29; Accepted date: 2020-06-22
Corresponding author: XU Ze-min, PhD, Professor; Tel: +86-13629475100; E-mail: xzm768@kust.edu.cn; ORCID: https://orcid.org/ 0000-0002-0092-4284
Abstract: To characterize and recognize the debris flow-related deposits, the physico-mechanical performance of four deposits from the Dongyuege (DYG), Shawa (SW), Jiangjia Gully (JJG), and Gengdi (GD) debris flows in southwest China is investigated through laboratory analyses and tests. The four debris-flow materials can all be remolded into coherent, homogeneous cylinders with high densification and strength�Cporosity of 25%-36%, mean pore-throat radius of 0.46-5.89 ��m, median pore-throat radius of 0.43-4.28 ��m, P-wave velocity of 800-1200 m/s, modulus of elasticity of 28-103 MPa, unconfined compressive strength (UCS) of 220-760 kPa, and cohesion of 65-281 kPa. Based on the comparison in slurryability and formability among debris-flow deposits, granular flow deposits, fluvial deposits, residual lateritic clay and loess, whether a sediment can be cast into competent cylinders for physico-mechanical tests can be regarded as a diagnostic evidence of old debris-flow deposits. The discrepancy in physico-mechanical properties among the four debris-flow deposits suggests that the combination of foregoing physico-mechanical parameters can characterize assembling characteristics of debris flow-related sediments including grain size distribution, mineralogy, and accidental detritus. Four deposited sediments above can be surprisingly classified as hard soil-soft rocks according to UCS, and the hard soil-soft rock behaviors can advance the further understanding of debris flows.
