

Life cycle inventory for base metal ingots production in Japan including mining and mineral processing processes by cost estimating system database
T. ADACHI1, G. MOGI2
1. Department of Materials and Environmental Science, Institute of Industrial Science, The University of Tokyo, Komaba, Meguro-Ku, Tokyo 153-8505, Japan
2. Department of Technology Management for Innovation, The University of Tokyo, Hongo, Bunkyo-Ku,
Tokyo 113-8656, Japan
Received 15 July 2007; accepted 10 September 2007
Abstract:
CO2 emission levels of copper and zinc mines from which Japanese smelters import ore concentrates into Japan, were estimated by using a database called MLED. Eleven copper mines selected from data availability of mine site covered 84% of the total imported concentrates. Adding inventories of sea transportation and smelting processes to mine development process, total CO2 emission level for copper and zinc ingots produced in Japan were calculated. The results show that the emission share of mining and mineral processing processes for each mine is indicated around 30%-70% of total emission for ingots, which implies the importance of including the mining activities to the inventory of upper stream products.
Key words:
LCI; LCA; base metal ingots; cost estimating system; mining process;
1 Introduction
Life Cycle Assessment (LCA) has been widely applied to evaluate environmental burdens regarding production and service activities. LCA is an integrating process to measure the environmental burdens associated with a product, process or activity by identifying consumptions of energy and materials. In a preparation stage for LCA, a catalog called Life Cycle Inventory (LCI) should be developed, tabulating environmental burdens throughout the lifecycle of product, process or activity. It takes the form of a table summing up resources inputs and outputs under consideration. Fundamentally, LCA should evaluate various kinds of environmental burdens such as NOx, SOx and heavy metals. However, this study deals with only CO2 emissions, because it is difficult to measure the other burdens practically.
Recently, more and more case studies of LCI on final products or materials have been done in the world. But in most of these studies, the mining activities are excluded from their system boundary because of the difficulty in data acquisition from foreign countries, except for few papers [1-3]. Systematic LCI on mining activities is needed for more accurate LCA.
Inputs data for production are usually referred to statistics of government and industry associations, or reports of investigations on individual mines. But there are problems for both sources respectively. For referring to the macro statistics, research items are insufficient in CO2 measurements. Concerning the latter source, although we can sometimes obtain reliable inventory data by investigating a mine, it is difficult to calculate general emission level because of sample limitation. In this work, we construct a database to estimate LCI on the mining activities from fundamental information of the concerned mine. This database called MLED (Mining LCI Estimating Database) provides not only standard CO2 emissions level for each production style on mining process but also energy and material consumptions.
2 Mining LCI estimating database
2.1 Outline of MLED
MLED estimates costs of energy and material use due to mine production and processing from a general mining cost estimating database system at the beginning. It then calculates energy and material consumptions through dividing the total costs by their unit prices respectively. Consequently, CO2 emissions with respect to mining process are computed, multiplying the consumptions by CO2 emission factors. Such indirect calculation for estimating CO2 emissions makes sense as the cost estimating system for mining is sufficiently practical. This database can be applied to estimate the LCI for various mining designs, production rates or equipments used. For example, the changes of energy consumption and material use according to change in mining method can be estimated in advance.
Equations for cost estimation in our database totally depend on CES (Cost Estimating System) (U.S. Bureau of Mines [4-6]). CES was developed by collecting data from more than 250 mines for 34 mineral commodities. It is used to estimate the capital and operating costs for initial development and operations stage, respectively. CES consists of two costing sections corresponding to mining and mineral processing and deals with seven kinds of consumption inputs for energy and materials, i.e. fuel oil, electricity, explosives, lubricant, steel and tires. The costs for each unit process can be estimated using either costing curves or formulas. MLED also uses these seven consumption inputs for LCI analysis.
About 1 100 formulas or cost curves, which have influence on LCI calculation, are selected from CES to construct the database, which is developed on Microsoft Access. Selected equations are classified into groups and their correlations are described to form the database. MLED consists of four data tables, categorized into capital cost and operating cost for surface mining and underground mining, respectively. The price for each cost item is also prepared as a database table to calculate consumptions from each cost.
2.2 Equations and database form
The cost curves are typically presented on a logarithmic scale of cost versus capacity. The corresponding cost formulas are of the form as
![]()
where C represents the cost and X is an independent variable for capacity or size. A and B are coefficients of scale factor defined in USBM��s analysis. M represents a multiplier to transform the cost from per meter or per area into total cost in the process.
Because energy and material consumptions that are estimated by MLED depend on these cost curves, estimated CO2 emissions also would be expected to have errors below 25%. A case study [7] on Chile copper mine has an error about 11% by comparison with the actual values.
In addition to the definition of the CES equations, following assumptions are made in MLED: 1) all steel products such as drill-bits, rock-bolts and cutters, are classified as steel; 2) explosives cost accounts for 70% of blasting materials (explosives and detonators) cost. 3) if costs are indicated per mining equipment, each cost is weighted by the proportion of its usage.
Interface forms and tabs for data input and item selection are developed to make the database be more useful. In addition to those forms, forms to display computational results are also developed, both for surface mining and underground mining. By filling those data forms, MLED automatically calculates material consumptions and CO2 emissions. Fig.1 shows an example of date input form for an underground mine. Each data for equations has particular reliability range indicated in the right side of the input field.
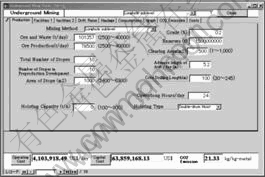
Fig.1 Screen shot of date input form for underground mine
2.3 Calculation of CO2 emissions
Essentially, the environmental burdens from production processes of mining equipments and facilities themselves would also be considered in mining LCI. However, since there are no available data at present, this database exclude LCI of those processes. Repair parts are also excluded from the calculation as we could not identify those parts in detail.
The respective CO2 emissions are computed through multiplying consumptions of energy and input materials by their CO2 emission factors. The CO2 emission factors used in MLED are listed in Table 1 and Table 2.
CO2 emission from a mine consists of emissions both from daily operation and initial development. Each emission is presented in terms of mass per unit metal production (kg-CO2/kg-Metal). Fig.2 shows an example form of CO2 emissions calculations for underground mine.
On our purpose of this study, a system boundary of LCI for base metal production in Japan ranges from mining and mineral processing activities in foreign countries to smelting activity in Japan, including sea transportation by bulk ships, as shown in Fig.3. CO2 emissions by the sea transportation and the smelting activity are referred from published statistics and commercial LCI data base[10, 13]. These statistics are used for all concentrates of different mines.
Table 1 CO2 emission factors for input energies and materials
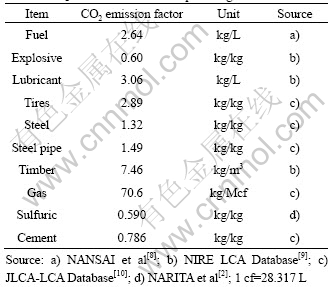
Table 2 CO2 emission factors for electricity production in different contents[11-12]

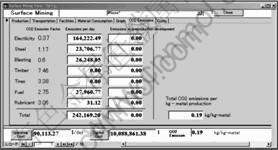
Fig.2 Screen shot of CO2 emissions estimation form
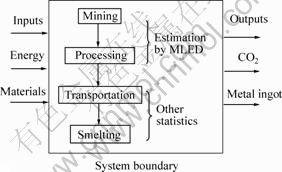
Fig.3 System boundary for metal ingot LCI
3 Estimation of CO2 emissions of base metals production in Japan by MLED
The fundamental data of mining activities to estimate CO2 emission by MLED are collected from annual reviews of firms, journals related to mining, papers and others. Because the number of the input data is over 40 items, it is difficult to fill all of them. The process data that consume a great deal of energy in operation is important such as ore transportation, hoist, milling and others. In this study, we calculate LCI of eleven mines that achieve these main data, from where Japanese smelters import concentrates.
Amount of concentrations from eleven mines accounts for 84% of copper ingots production in Japan, including upper nine mines exported to Japan. The estimation results of CO2 emission per 1 kg copper ingots by mining, mineral processing, sea transportation and smelting activities are shown in Fig.4.
The differences among mines are more than 50%. For example, Escondida mine that is the largest copper mine in the world produces concentrates at lower level of emission due to its scale factors. On the other hand, Alumbrera mine is estimated to emit most amount of CO2 because it locates in western part of Argentine, which extends the distance to Japan.
Weighted average (metal content of each mine) of CO2 emission for copper ingot in Japan is estimated 2.38 kg-CO2/kg-Cu. Though the results have any error in equations and data acquisition, this value is near another result used a different method like Narita[2].
Addition to it, we also calculated the effect of by-products of copper ore. Extracted copper ore in mines often include other metals called by-products such as gold, silver and molybdenum. A problem would be occurred when LCI treats multi-products processes��how should the environmental burdens be allocated among metal products. Though there are some allocation methods basically, we apply value base method by metal value ratio in copper ore. Each metal value is calculated on average metal price in 2000-2004.
As shown in Fig.5, allocated CO2 emissions are also averaged on mines respectively, because ore values in each mine do not have so much difference. CO2 emissions range from 1.5 to 2.5 kg-CO2/kg-Cu. Whole weighted average by production rate of copper metal declines to 1.94 kg-CO2/kg-Cu, 19% lower than unallocated average.
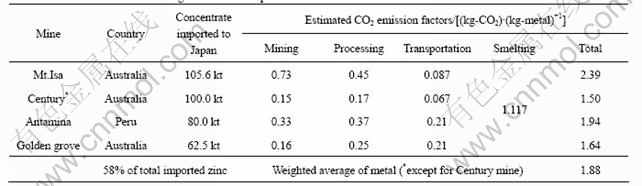
The CO2 inventory of zinc ingots produced in Japan is estimated as the same method of copper. But mine data are more limited compared with copper mine. The amount of zinc metal in achieved mine data is 58% of the total imported zinc, as listed in Table 3. The weighted
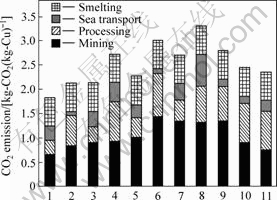
1��Escondida; 2��Grasberg; 3��Collahuasi; 4��Antamina; 5��Los pelambres; 6��Batu Hijau; 7��La Candelaria; 8��Alumbrera; 9��Ok Tedi; 10��Highland Valley; 11��Huckleberry
Fig.4 Estimated CO2 emission for copper ingot in Japan by eleven mine sites average (metal content of each mine) of CO2 emission for zinc ingot in Japan is estimated 1.88 kg- CO2/kg-Zn.
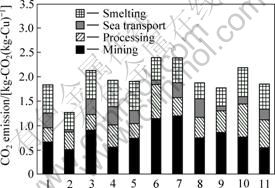
1��Escondida; 2��Grasberg; 3��Collahuasi; 4��Antamina; 5��Los Pelambres; 6��Batu Hijau; 7��La Candelaria; 8��Alumbrera; 9��Ok Tedi; 10��Highland Valley; 11��Huckleberry
Fig.5 Allocation of estimated CO2 emission to copper ingot considering all by product metals
Table 3 Estimated results for zinc ingots smelted in Japan
On the other hand, considering which process is dominant on CO2 emissions in base metal ingot production, the mining process and mineral processing process have large amount ratios, 40%-50% and 20%-30%, respectively. While the inventory of mining activities is often excluded in many LCI reports, these values indicate that we cannot ignore these amounts to estimate material products LCI.
4 Conclusions
1) An inventory estimating database for mining LCI (MLED), which enables to evaluate the environmental burdens, has been developed. Using MLED, CO2 emissions due to different mining method and production rates can easily be compared. MLED with data input interfaces automatically calculates CO2 emissions from cost estimation based on equations of CES.
2) The weighted average of CO2 emission factor for copper ingots is estimated at 2.38 kg-CO2/kg-Cu. Because eleven concerned mines cover 84% of total imported copper concentrate to Japan, LCI of copper ingots produced in Japan is expected around 2.0 kg-CO2/ kg-Cu even if by products allocation is concerned.
3) For zinc ingots, weighted average CO2 emission inventory produced in Japan is estimated 1.88 kg-CO2/kg-Zn, which has covered 58% of total zinc production.
4) To ignore environmental burdens from mining activities will underestimate LCI for ingots as well as other products, especially for copper used. The mining process and mineral processing process hold about 30%-70% of total CO2 emissions in our estimations.
References
[1] International Aluminum Institute. Life cycle assessment of aluminum: Inventory data for the worldwide primary aluminum industry[R]. 2003.
[2] NARITA N, SAGISAKA M, INABA A. Life cycle inventory analysis of CO2 emission from electrolytic copper production system[J]. Shigen-to-Sozai(Journal of MMIJ), 2001, 117(11): 49-55.
[3] YOSHIKI-GRAVELSINS K S, TOGURI J M, CHOO R T C. Metals production energy and the environment, Part ��: Energy consumption[J]. JOM, 1993, 45: 15-20.
[4] U.S. Bureau of Mines. Bureau of mines cost estimating system handbook: 1. Surface and underground mining[M]. BuMines IC 9142, 1987.
[5] U.S. Bureau of Mines. Bureau of mines cost estimating system handbook: 2. Mineral processing[M]. BuMines IC 9143, 1987.
[6] U.S. Bureau of Mines. The USBM cost estimating system, economic analysis tools for the mineral industry[EB/CD]. SP17-95, CD-ROM, US Geological Survey, 1995.
[7] ADACHI T, MOGI G. Estimation of life cycle inventory on mining and mineral processing processes using cost estimation database[J]. Shigen-to-Sozai(Journal of MMIJ), 2005, 121(12): 590-596.
[8] NANSAI K, MORIGUCHI Y, TOHNO S. Embodied energy and emission intensity data for Japan using input-output tables��Inventory data for LCA[R]. CGER, NIES, 2002.
[9] NIRE. NIRE-LCA ver.2. (NIRE, 1996)
[10] Life Cycle Assessment Society of Japan: JLCA-LCA database 2004[M]. 2nd ed. Japan Environmental Management Association for Industry, 2004.
[11] International Energy Agency. Energy balances of OECD countries[R]. IEA/OECD, 2004.
[12] International Energy Agency. Energy balances of non-OECD countries[R]. IEA/OECD, 2004.
[13] Ship and Ocean. Report of emission mitigation of green house gases (CO2) from shipping[R]. 2001. (in Japanese)
Corresponding author: Tsuyoshi ADACHI; Tel: +81-3-5452-6345; E-mail: adachi@iis.u-tokyo.ac.jp
(Edited by HE Xue-feng)
