
J. Cent. South Univ. Technol. (2011) 18: 177-183
DOI: 10.1007/s11771-011-0677-7
![]()
Implementation of remote monitoring system for prediction of tool wear and failure using ART2
NOH Min-Seok, HONG Dae Sun
School of Mechatronics, Changwon National University, Changwon 641-773, Korea
? Central South University Press and Springer-Verlag Berlin Heidelberg 2011
Abstract:
Remote monitoring of tools for prediction of tool wear in cutting processes was considered, and a method of implementation of a remote-monitoring system previously developed was proposed. Sensor signals were received and tool wear was predicted in the local system using an ART2 algorithm, while the monitoring result was transferred to the remote system via internet. The monitoring system was installed at an on-site machine tool for monitoring three kinds of tools cutting titanium alloys, and the tool wear was evaluated on the basis of vigilances, similarities between vibration signals received and the normal patterns previously trained. A number of experiments were carried out to evaluate the performance of the proposed system, and the results show that the wears of finishing-cut tools are successfully detected when the moving average vigilance becomes lower than the critical vigilance, thus the appropriate tool replacement time is notified before the breakage.
Key words:
tool wear; remote monitoring system; ART2 neural network; machine tool; tool replacement time��
1 Introduction
Recently, most industries introduce unmanned automation production systems to cope with high labor cost while improving the quality of products. In automation systems, monitoring of the state of production facilities is essential for maintaining the reliability and productivity. Especially, in automated cutting processes, tool wear or breakage [1] may cause some serious problems such as the deterioration of products and processing performance as well as the loss of operational safety. Thus, it is needed to develop a system to monitor the tool state during cutting operation so that the tools can be replaced at appropriate time in advance before its breakage.
Meanwhile, owing to the rapid growth of internet technology, web-based remote monitoring (e-monitoring) technology and web-based remote maintenance and repair (e-maintenance) technology [2-4] have been developed as the basic technologies to embody e-factory and e-automation. These technologies can predict and diagnose the degree of machine breakdown and tool wear by monitoring the state of machines and tools via internet or intranet.
Until now, a lot of research work on tool wear monitoring has been carried out. Usually, since it is very difficult to directly measure the tool wear, indirect methods using other relevant parameters representing tool wear are usually used. These parameters include cutting forces, vibration, acoustic emission, current, power, temperature and others [5]. Also, various indirect methods for tool wear monitoring have been reported, including statistical analysis [6], Fourier transform [7], wavelet transform [8], fuzzy logic and neural networks [5, 9].
In this study, a method of implementation of a previously developed remote monitoring system is presented [10-11], which adopts vibration signals as the tool wear parameter and uses an ART2 algorithm for monitoring. The system is installed at an on-site machine tool to monitor the wear of two kinds of roughing-cut tools and a finishing-cut tool for cutting titanium alloys. Specifically, a vibration sensor is installed near the main spindle of a machine tool, and vibration signals are received by the monitoring system built with a server PC installed around the machine tool. Then, the signals are analyzed to evaluate the tool wear by the ART2 algorithm previously trained by unsupervised learning [12-14]. The tool wear is evaluated on the basis of the similarity of a vibration signal monitored and the normal-state patterns previously stored in the ART2.
In the meantime, vigilance is adopted as the similarity measure. However, even when a tool being used is not in wear stage but in normal stage, once in a while the vigilance abruptly changes to a low value as if the tool were in wear state. To cope with this problem, a statistical approach is carried out in real time with a moving average method [15] applied to original vigilances. A number of experiments are carried out for three kinds of cutting tools for titanium alloys.
2 Remote monitoring system using ART2
In this study, MATLAB and LABVIEW are used to implement a real time remote monitoring system. MATLAB is used for the ART2 algorithm, while LABVIEW is for the signal processing and monitoring in the local system.
2.1 Concept of remote monitoring system
The monitoring system consists of a local system and a remote system. Fig.1 shows the configuration of the overall monitoring system. The local system is located around the on-site machine tool, while the remote system, far from the local system, is usually in the laboratory or in the office. Two systems are connected via internet or intranet.
It is very difficult to directly measure the wear dimension of a tool used in cutting processes. To cope with this difficulty, vibration signals are used to indirectly measure the tool wear, and an accelerometer is installed near the main spindle of a machine tool. The vibration signals are acquired by the local PC, and are monitored by the ART2 algorithm. Here, the monitoring results are transmitted to the remote PC using the web publishing tool by LABVIEW.
2.2 ART2 algorithm using MATLAB
In the real-time tool monitoring system, ART2 neural network is used for monitoring of vibration signals from the vibration sensor. The neural network is initially trained by a number of normal signals, then is used for monitoring. Fig.2 shows the concept of training and monitoring. As a result of training, a number of classes representing normal signal patterns are created. In this training process, the threshold vigilance (��t) plays an important role. The higher the value, the more the number of classes. Then, this system is used to evaluate the performance degradation of machines or tools in monitoring stage. Specifically, when a new signal comes in, the similarity between the signal and the trained classes is evaluated, and the similarity is used as the measure of tool wear. Here, the similarity is termed vigilance, a dimensionless parameter, lying between 0.746 2 and unity [16-17].
In this system, the initial 10 min normal-state data are used for training, then, the degree of tool wear is evaluated through long-term monitoring to determine the adequate tool replacement time.
3 Application of remote monitoring system
The monitoring system described in the previous section was installed at a machine tool machining titanium-alloy aircraft components. Three types of end mills were used as cutting tools, and the tool wear for each tool is to be monitored.
3.1 Experimental setup
To measure tool wear, a suitable sensor needs to be selected when a tool is being used for cutting workpieces. In such circumstance, it is very difficult to directly measure tool wear by any sensor. To cope with this difficulty, an indirect method is adopted for measuring the tool wear. An accelerometer is used for sensing the vibration around the tool. Here, the accelerometer is installed at a spot near the tool.
The local PC acquires vibration signals from the sensor, and the signals are monitored by the ART2 algorithm. The vibration signals are transformed to FFT (Fast Fourier Transform) signals, used as input patterns to the ART2 algorithm. The monitoring result is then transmitted to the remote PC. Fig.3 shows photographs

Fig.1 Constitution of overall monitoring system installed at on-site machine tool
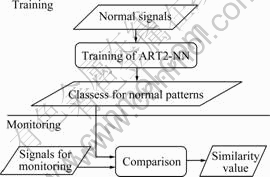
Fig.2 Concept of ART2-based monitoring system divided into training stage and monitoring stage
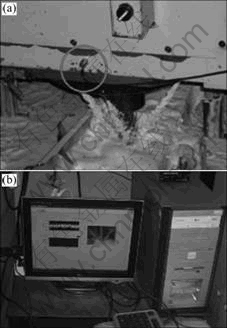
Fig.3 Installation of monitoring system: (a) Accelerometer installed at spot near tool; (b) Local PC for monitoring of tool wear
showing the vibration sensor and the monitoring system installed.
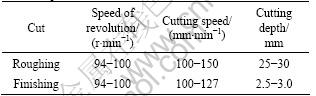
Three kinds of tools are used in this cutting process: both 8Fl. (eight-flute) fine pitch end mill (Tool A) and 6Fl. (six-flute) minicut end mill (Tool B) for roughing cuts, and 6Fl. (six-flute) HSS end mill (Tool C) for finishing cuts. Fig.4 shows the new cutting tools without any wear used for the experiment. Table 1 lists the cutting conditions.
3.2 Signal processing
The vibration signals are acquired every 5 s in real time, and the initial 1 s signals are used for transforming to FFT one, the frequency range of which lies between zero and 500 Hz.
As shown in Fig.2, the ART2 algorithm is divided into two stages: training and monitoring. The initial
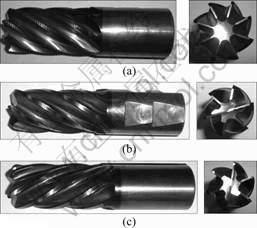
Fig.4 Three kinds of new tools: (a) 8Fl. fine pitch end mill (Tool A) for roughing cuts; (b) 6Fl. minicut end mill (Tool B) for roughing cuts; (c) 6Fl. HSS end mill (Tool C) for finishing cuts
Table 1 Cutting conditions for roughing cuts and finishing cuts used in experiment
10 min normal signals during cutting with a new cutting tool are used as training data. In monitoring stage after training, the vibration signals are used as monitoring data, input patterns to the ART2 algorithm.
3.3 Measurement of tool wear
The wear quantity of a tool used at an actual production site can be measured only after a length of operation is completed. This is because a normal tool being used should not be removed or replaced during cutting processes at the production site.
The wear dimension can be usually measured on the basis of the average wear width and the maximum wear width, and in this study the latter one is adopted. To measure the wear dimension, two kinds of measurement methods with a dial gauge and a microscope are used, and the measurement results are compared with each other.
In Figs.5(a), (b) and (c), microscopic photographs show wear shapes of three kinds of tools, respectively. Also, Fig.6 shows that a used tool is fixed at a lathe chuck, and the tool wear is being measured by a dial gauge.
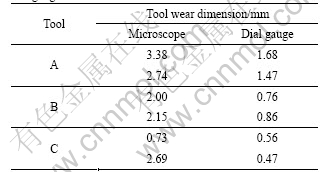
The wear dimensions measured by a microscope and a dial gauge are compared, and the results are shown in Table 2. It can be seen that the dimensions measured
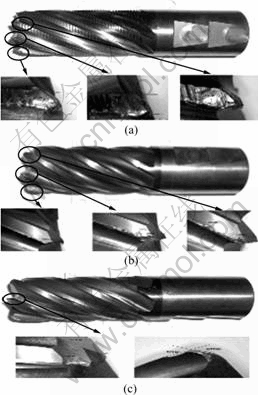
Fig.5 Microscopic photographs of wear shape after completing cutting: (a) Three worn edges of Tool A; (b) Three worn edges of Tool B; (c) Worn edge of Tool C

Fig.6 Measurement of tool wear by dial gauge
by two methods are much different front each other; the dimension by the microscope is much bigger than that by the dial gauge. This is because the round tip of the dial gauge is interfered with the deep inner side of a worn part of the tool, and the error occurs in the measurement. Thus, the microscope measurement method having smaller error is adopted.
Table 2 Tool wear dimensions measured by microscope and dial gauge for three kinds of tools
3.4 Tool wear monitoring
The remote monitoring system was applied to a machine tool for monitoring tool wear in real time. The initial 10 min vibration signals from a sensor are regarded as normal-state patterns by which the ART2 algorithm is trained. Here, the threshold vigilance ��t= 0.88 is used.
Fig.7 shows the monitoring results for three kinds of tools. Fig.7(a) is the result for a roughing-cut tool (Tool A), Fig.7(b) for a roughing-cut tool (Tool B), and Fig.7(c) for the finishing-cut tool (Tool C). In Fig.7, the horizontal axis shows the number of input patterns, while the vertical axis is the vigilance monitored.
A series of input patterns are acquired every 5 s, and the duration of each experiment is the same as the total cutting time. In Fig.7, the vigilance monitored is shown to continuously change from the start to the end of a cutting process.
As shown in Figs.7(a) and (b), the vigilances for the roughing-cut tools (Tool A and Tool B) are irregularly changed. This is because roughing-cut requires deep cutting depth and high material removal rate, and the vibration signals are not stable. On the other hand, as shown in Fig.7(c), the vigilance for the finishing-cut tool (Tool C) tends to decrease as the cutting process goes on, and the vigilance of the latter part marked by a circle rapidly decreases in comparison with the earlier part. These results are to be analyzed in detail hereinafter.
3.5 Analysis of monitoring signals
Table 3 gives the vigilance distribution for two kinds of roughing-cut tools. The tool wear dimensions described are measured for each of three identical-type tools used in cutting under same cutting condition. In this roughing-cut tool case, vigilances are shown to lie between 0.75 and unity regardless of the wear quantity of tools. Also, as shown in Figs.7(a) and (b), no conclusion can be made on the tendency of vigilance change.
In the case of the finishing-cut tool, the vigilances during the latter part of a cutting process stay relatively low, as shown in Fig.7(c). Thus, a length of a cutting
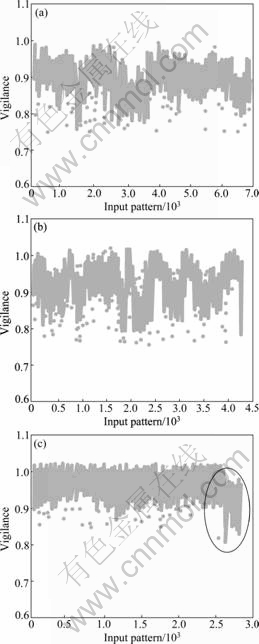
Fig.7 Monitoring results based upon monitored vigilance for three kinds of tools: (a) Irregular pattern in case of Tool A; (b) Same irregular tendency as Tool A in case of Tool B; (c) Relative low vigilance during latter part shown in circle in case of Tool C
Table 3 Vigilance distribution versus wear dimension in case of roughing-cut tools
process can be divided into two stages. The former part having relatively higher vigilance can be regarded as normal stage, while the latter part can be wear stage.
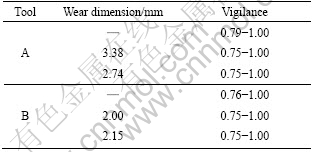
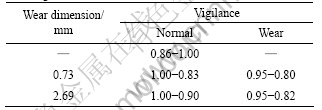
Table 4 gives the vigilance distribution for three finishing-cut tools. Since the threshold vigilance is set to be 0.88, similar values lower than the threshold vigilance could be considered as the signal of abnormal state, that is, a tool is in wear state. However, once in a while, such abnormal signals appear even in normal stage for the finishing-cut tool, as can be seen in Table 4, and are commonly generated due to the uneven lubricant injection quantity along with the chip pocket phenomenon and other unexpected disturbances or noises.
Table 4 Vigilance distribution versus wear dimension in case of finishing-cut tool
To cope with this problem, a moving average method [15] as a statistical approach is applied in this study. The moving average means the average of a fixed number of measured values close to the standard point of time.
Fig.8(a) shows the vigilance change for the finishing-cut tool, while Fig.8(b) shows the one obtained by applying the ten-point moving average method. In Fig.8(a), the number of points lower than the threshold vigilance in the normal stage is counted to be 46, while no such point exists in Fig.8(b).
Resultantly, the moving average method can eliminate abnormal signals in normal stage, and this statistical method is used during entire cutting processes including wear stage. Also, the moving average vigilance same as the critical vigilance is regarded as the boundary for a tool to start to wear. However, such boundary is not clearly shown in the case of the roughing-cut tools.
3.6 Implementation of real-time monitoring system
On the basis of the result of the above experiment, the real time tool wear monitoring system was implemented to a machine tool in industry. The initial 10 min sensor signals are considered as normal ones, and are used as the training patterns to the ART2 algorithm. As a result of training, a number of classes representing normal patterns are generated and stored, and are used as the references for monitoring. After training, subsequent sensor signals are used for monitoring of tool wear in real time, as explained in the previous section.
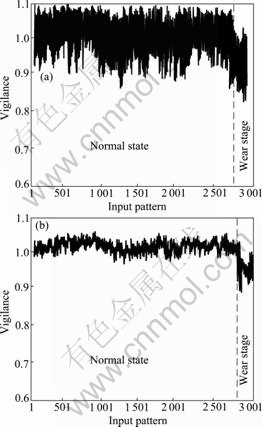
Fig.8 Vigilances obtained from experiment: (a) Original vigilance monitored from finishing-cut tool; (b) Ten-point moving average vigilance
In monitoring stage, the vigilance of a new signal is evaluated by comparing with the classes previously trained, and a series of vigilances are generated every 1 s. When the vigilance is lower than the critical vigilance of 0.88, an alert message ��Warning�� with big letters appears in the monitor, and a supervisor should examine the condition of a tool being used, the machine, and the workpiece. If the tool is judged to be normal, the signal can be considered as a new normal one, and then ART2 can be easily and fast retrained by the supervisor.
In the meanwhile, as a result of applying the ten-point moving average method, new moving average vigilances are also successively generated in real time, and are used as the references for deciding whether the tool is normal or in wear state. When a number of successive moving average vigilances lower than the critical vigilance appear for a period of time, the monitoring system also gives another warning message for tool replacement.
For a finishing-cut tool cutting titanium alloy parts, tool wear was monitored by the remote monitoring system. Fig.9 shows the ten-point average vigilance change for the tool during approximately 530 min cutting processes to completely produce a part. Total 6 328 patterns are created, and it is shown that all the moving average vigilances are above the critical value depicted as a solid straight line. Thus, in this application, little tool wear occurs during the cutting process. Also, the used cutting tool was examined, and the wear of the tool is found to be negligible. Consequently, it is concluded that the real-time remote monitoring system was successfully implemented to a real cutting process for predicting the tool replacement time before the tool breakage.
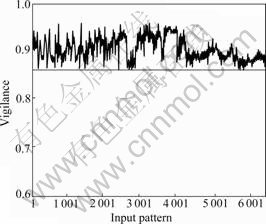
Fig.9 Moving average vigilance change in cutting titanium alloy parts
4 Conclusions
1) The remote monitoring system previously developed is actually implemented to an on-site machine tool in industry. To indirectly monitor the tool wear state, an accelerometer is installed to be near the cutting tool, and the vibration signals from the accelerometer are utilized for the monitoring system.
2) When a tool being used is not in wear stage but in normal stage for finishing-cut tools, once in a while the vigilance monitored abruptly changes to a low value as if the tool is in wear. To cope with this difficulty, a moving average method is applied to the original vigilances. As a result, the distinction between the normal stage and the wear stage is clearly shown.
3) A series of experiments are carried out for three kind of cutting tools: two kinds of roughing-cut tools and a finishing-cut tool. The results show that the moving average vigilances monitored for the finishing-cut tool become lower than the critical vigilance during the latter part of cutting process, and then the tool is examined to be in wear state. Thus, the monitoring system can notify the appropriate tool replacement time before its breakage.
Acknowledgment
This research is financially supported by Changwon National University in 2009-2010.
References
[1] JANTUNEN E. A summary of methods applied to tool condition monitoring in drilling [J]. International Journal of Machine Tools & Manufacture, 2002, 42(9): 997-1010.
[2] WU Bin, ZHOU Bing-hai, XI Li-feng. Remote multi-robot monitoring and control system based on MMS and web services [J]. The Industrial Robot, 2007, 34(3): 225-239.
[3] MULLER A, CRESPO M A, IING B. On the concept of e-maintenance: Review and current research [J]. Reliability Engineering & System Safety, 2008, 93(8): 1165-1187.
[4] KIM D H, LEE Y S, KIM S H. Study on the design of risk management web-monitoring system using AANN [J]. Journal of Control, Automation and Systems Engineering, 2004, 10(6): 545-550. (in Korean)
[5] ALIUSTAOGLU C, ERTUNC H M, OCAK H. Tool wear condition monitoring using a sensor fusion model based on fuzzy inference system [J]. Mechanical Systems and Signal Processing, 2009, 23(2): 539-546.
[6] XIE M, GOH T N, WIKLUND H. Statistical monitoring and control of tool wear processes [J]. International Journal of Reliability, Quality, and Safety Engineering, 2000, 7(4): 331-340.
[7] EL-WARDANY T I, GAO D, WLBESTAWI M A. Tool condition monitoring in drilling using vibration signature analysis [J]. International Journal of Machine Tools & Manufacture, 1996, 36(6): 687-711.
[8] ZHU K P, WONG Y S, HONG G S. Wavelet analysis of sensor signals for tool condition monitoring: A review and some new results [J]. International Journal of Machine Tools & Manufacture, 2009, 49(7/8): 537-553.
[9] ALONSO F J, SALGADO D R. Analysis of the structure of vibration signals for tool wear detection [J]. Mechanical Systems and Signal Processing, 2008, 22(3): 735-748.
[10] JANG U-Il, NHO Min-Seok, CHOI Kook-Jin, HONG Dae Sun. Development of a web-based remote monitoring system for evaluating degradation of machine tools Using ART2 [C]// IEEE/ASME International Conference on Mechatronics and Embedded Systems and Applications, 2008: 315-320.
[11] NHO Min-Seok, KWON Jung-Hee, JANG U-Il, HONG Dae Sun, JUNG Hae Yong. Real time monitoring system for prediction of tool wear and failure in machining processes using ART2 [C]// ICROS-SICE International Joint Conference, 2009: 3105-3106.
[12] ASAKURA T, KOBAYASHI T, XU B, HAYASHI S. Fault diagnosis system for machines using neural networks [J]. Journal of the Japan Society of Mechanical Engineering, 2000, 43(2): 364-371.
[13] YU D H. A fault diagnosis based on multilayer ART2 neural network [J]. Journal of Korean Institute of Intelligent Systems, 2004, 14(7): 830-837.
[14] LEE I S, SHIN P J, JEON G J. Multiple faults diagnosis of a linear system using ART2 neural networks [J]. Journal of Control, Automation and Systems Engineering, 1997, 3(3): 244-251. (in Korean)
[15] WILLIAMS A S. Statistics for business and economics [M]. Thomson South-Western, 2005: 783-786.
[16] CARPENTER G A, GROSBERG S. ART2: Self-organization of stable category recognition codes for analog input patterns [J]. Applied Optics, 1987, 26(23): 4919-4930.
[17] CARPENTER G A, GROSBERG S. A massively parallel architecture for a self-organizing neural pattern recognition machine [J]. Computer Vision, Graphics, and Image Processing, 1987, 37(1): 54-115.
Received date: 2010-06-29; Accepted date: 2010-09-22
Corresponding author: HONG Dae Sun, PhD; Tel: +82-55-213-3627; Fax: +82-55-263-5221; E-mail: dshong@changwon.ac.kr
