
J. Cent. South Univ. Technol. (2010) 17: 1079-1086
DOI: 10.1007/s11771-010-0600-7
![]()
Improved parameter selection method for mesoscopic numerical simulation test of direct tensile failure of rock and concrete
LIU Zhi-guang(���ǹ�), CHEN Jian-yun(�½���), BAI Wei-feng(������), XU Qiang(��ǿ)
State Key Laboratory of Coastal and Offshore Engineering, Dalian University of Technology, Dalian 116024, China
? Central South University Press and Springer-Verlag Berlin Heidelberg 2010
Abstract:
In order to numerically simulate the failure process of rock and concrete under uniaxial tension, an improved method of selecting the mechanical properties of materials was presented for the random mechanic parameter model based on the mesoscopic damage mechanics. The product of strength and elastic modulus of mesoscale representative volume element was considered to be one of the mechanical property parameters of materials and assumed to conform to specified probability distributions to reflect the heterogeneity of mechanical property in materials. With the improved property parameter selection method, a numerical program was developed and the simulation of the failure process of the rock and concrete specimens under static tensile loading condition was carried out. The failure process and complete stress-strain curves of a class of rock and concrete in stable fracture propagation manner under uniaxial tension were obtained. The simulated macroscopic mechanical behavior was compared with the available laboratory experimental observation, and a reasonable agreement was obtained. Verification shows that the improved parameter selection method is suitable for mesoscopic numerical simulation in the failure process of rock and concrete.
Key words:
1 Introduction
Tensile failure is one of the major types of failure of rock and concrete. The failure process of materials is characterized by nonlinear stress-strain relationship and failure localization, which is rooted in the mesoscale heterogeneity of material mechanical property. The heterogeneity can be described by introducing specified probability distributions. A series of mesoscopic numerical models emerged to simulate the progressive failure process of materials based on the material heterogeneity. The representative models included the random particle model [1], the lattice model [2], the random aggregate model [3], and the random mechanic parameter model [4-5].
The random mechanic parameter model is a method of completely continuum mechanics for numerically processing nonlinear and discontinuum mechanics problems in material failure based on mesoscopic damage mechanics. The model has been successfully applied to the research of rock and concrete damage mechanics [6-8]. However, the result is unsatisfactory for simulating the failure process of the type of rock and concrete in a stable fracture propagation manner subjected to uniaxial tension, especially for simulating both the nonlinear hardening before peak stress and the strain softening after that.
Therefore, in this work, an improved method of selecting the material mechanical property parameter for the random mechanic parameter model was put forward. Structural resistance could be considered as the product of all random variables in structural reliability theory [9]. Accordingly, the product of strength and elastic modulus of mesoscale representative volume element (RVE) was assumed to be the parameter for the description of material mesoscopic mechanical properties in this work and the corresponding numerical code was developed. The progressive failure process of rock and concrete specimens under static uniaxial tension was simulated using the code with the random mechanic parameter model. Comparisons of simulated results and the available laboratory experimental results for macroscopic nonlinear mechanical behaviors were performed.
2 Mechanical properties of mesoscopic materials
Both independent strength and elastic modulus are considered as the basically mechanical properties of the mesoscale RVE in the random mechanic parameter model [4-8]. However, the mechanical property parameters are correlated with each other. The interrelation of the property parameters has an effect on the progressive failure process of materials, which should be considered in the numerical simulation model [10]. Due to less studies on the influence of interrelation of property parameters on material failure process, further investigation is still needed.
Based on the elastic damage constitutive law, numerical simulation model is successfully applied in many fields with independent strength and elastic modulus as the basically mechanical parameters of RVE. However, it is difficult to simulate tensile failure process of rock and concrete materials, particularly for the cases that have the failure mode of a stable fracture propagation manner. The simulated failure process under uniaxial tension is mostly characterized by the macroscopic brittle failure with a vertical stress drop after peak stress, which cannot reflect the nonlinear hardening phase and strain softening phase.
The difficulties mentioned above are caused by many factors. Numerically denoting heterogeneous mechanical properties of materials in the model is very important. On the one hand, the distribution parameters describing heterogeneous properties of materials should be determined in terms of laboratory experiments or practical investigations. Unfortunately, the available data are very limited. On the other hand, a new mechanical property parameter is needed to reflect the mesoscale heterogeneity of materials more objectively and comprehensively. It is the emphasis of this work.
In recent years, acoustic emission (AE) test and CT scan have been applied to laboratory experiments by numerous researchers to monitor fracture creation [11-12]. These advanced studies enhanced the understanding of the progressive nature of fracture in materials under external loading. Some researchers attempted to illustrate the distribution features of material strength by AE test or CT scan fractal analysis during material failure process. The failure process of the test specimen is certainly related to the interaction between stress and strength conditions at mesoscopic scale. Material local failure will occur when element stress exceeds its strength. In addition, the material stress condition is mainly determined by the randomly distributed elastic modulus. Therefore, the results of AE test and CT scan reflect the combined influence of elastic modulus and strength on material failure process, by which one cannot determine the distribution features of strength.
From the other point of view, there is a corresponding relationship between RVE and structural component. The mechanical property parameters of RVE belong to structural resistance category to a limited extent. Strength of RVE refers to the ability of an element to withstand an applied stress without failure and elastic modulus implies the ability of an element to resist deformation. Strength and elastic modulus are regarded as fundamental resistances to an element, and a variable expressed as the function of fundamental resistance is considered as comprehensive resistance in this work.
The (comprehensive) structural resistance can be expressed as the product of several fundamental random variables (fundamental resistance) in structural reliability theory [9]. Hence, the product of strength (f ) and elastic modulus (E) of RVE is taken as the comprehensive resistance of the element, which is denoted as R�� and can be expressed as
![]() (1)
(1)
where R�� is a mechanical property parameter of material reflecting the mechanical properties of materials more objectively and comprehensively than strength or elastic modulus. The material heterogeneity can be reflected by the randomly distributed R�� that is caused by micro-defects such as micro crack and micro pore. The method for describing the material heterogeneity with the random distribution of independent strength and elastic modulus is also considered for comparison.
Actually, the purpose of studying the material mesoscale heterogeneity is to distinguish the relatively strong part from the relatively weak one. For the available mesoscopic numerical model, the heterogeneity of materials is considered by assuming that strength and elastic modulus either independently or perfectly linear correlated randomly distribute within materials. It can be found that whether an element is stronger or weaker than another by comparing strength or elastic modulus of elements in a general case.
For example, as shown in Fig.1, there are three elements (1, 2, 3) and their property parameters (strength and elastic modulus) are (f1, E1), (f2, E2) and (f3, E3). Because E1 is greater than E2, element 1 is stronger than element 2 though f1 equals f2. But it is difficult to tell which one is stronger between elements 2 and 3 because E2 is greater than E3 while f2 is smaller than f3. In this work, it is suggested that, R��, which is the product of strength and elastic modulus of element, can be used to measure element property. A large value of R�� implies a stronger element (material) and vice versa. So, element 2 is stronger than element 3 for![]() is greater than
is greater than![]() It can be concluded that the proposed property parameter
It can be concluded that the proposed property parameter ![]() reflects material heterogeneity more objectively and comprehensively.
reflects material heterogeneity more objectively and comprehensively.
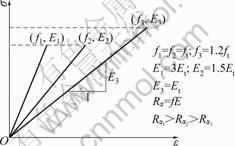
Fig.1 Strength and elastic modulus of elements (ft is reference strength, and Et is reference elastic modulus)
3 Generation of correlated random number
The values of E and R�� are generated directly, from which the value of element strength is obtained. There is a certain relationship between R�� and E but not a perfect linear correlation because f is also a random variable, and E cannot be obtained from R��. Correlated random number sequence as the values of correlated R�� and E can be generated with the given distributions [13-14].
Weibull distribution and lognormal distribution were used in the random mechanic parameter model to reflect the mesoscopic heterogeneity of materials. The probability density function (f(x)) of Weibull distribution can be expressed as
 (2)
(2)
where x is the mechanical property parameter of RVE (such as comprehensive property parameter R�� and elastic modulus E); u0 is the scale parameter related to the average of the mechanical property parameters; and m is the homogeneity index defining the shape of the distribution function.
The probability density function (f(x)) of lognormal distribution is
![]() (3)
(3)
where ![]() and �� are the mean and standard deviation of ln x, respectively.
and �� are the mean and standard deviation of ln x, respectively.
A heterogeneous material in the simulation of a medium composed of many RVEs can numerically be produced using probability density function. The computationally produced heterogeneous medium is analogous to a real specimen tested in the laboratory, which is referred to as a numerical specimen.
��R and ��R are the mean and standard deviation of R��, respectively, which can be written as the following forms [9]:
![]() (4)
(4)
![]() (5)
(5)
where ��f and ��f are the mean and standard deviation of strength, respectively; and ��E and ��E are the mean and standard deviation of elastic modulus, respectively.
In the case of lognormal distribution, with Eqs.(4) and (5) one obtains
![]() (6)
(6)
where ��R, ��f, and ��E are the standard deviations of ln R��, ln f, and ln E, respectively. It leads to the conclusion that ��R is greater than ��E or ��f. When property parameters conform to Weibull distribution mR will be smaller than mE or mf. Therefore, the distribution of R�� is more heterogeneous than that of E and f in the specimen.
4 Numerical simulation on material failure under uniaxial tension
A numerical code was developed with the improved mechanical property parameter selection method based on the random mechanic parameter model. The deformation and failure processes of heterogeneous materials such as rock and concrete under static uniaxial tension condition were studied. Throughout the following of this section, the numerical specimens were 100 mm in length, and 100 mm in width. They were simulated with 100��100 mesoscopic elements in 2D plane stress problem. Furthermore, for all the cases, the material mechanical properties of each element were different and produced randomly by a computer according to a specified probability distribution. The applied displacement at the top of specimen was at a constant rate of 0.2 ��m/step in the axial direction.
In the code, the product of element tensile strength (ft0) and initial elastic modulus (E0) is considered to be one of the mechanical property parameters of materials. The material heterogeneity is considered by assuming that the mechanical property parameters of elements conform to Weibull distribution and lognormal distribution, respectively. An elastic damage-based law (as shown in Fig.2) is employed to describe the constitutive law of materials at mesoscopic scale. The element as well as its damage is assumed to be homogeneous and isotropic in the code. The sign convention used throughout this work is that tensile stress and strain are positive, and �� and �� are stress and strain of element, respectively. In Fig.2, there exists
 (7)
(7)
where ftr is the residual tensile strength, which is given as ftr=��ft0, ft0 and �� are the uniaxial tensile strength and residual strength coefficient, respectively; ��tu is the ultimate tensile strain of the element, describing the state at which the element will be completely damaged, etu=�Ǧ�t0; and �� is the ultimate strain coefficient.
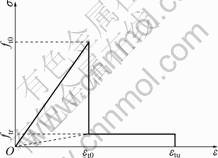
Fig.2 Elastic damage constitutive law of element under uniaxial tensile stress
Initially, an element is considered to be elastic, with elastic properties defined by initial elastic modulus and Poisson ratio. The stress-strain relationship for an element is considered to be linear elastic until the given damage threshold is attained, and then modified by softening. Elements undergo damage when the following maximum tensile strain criterion is satisfied at the element level:
![]() (8)
(8)
The elastic modulus of damaged element degrades as follows:
![]() (9)
(9)
where D represents the damage variable; and![]() and E0 are elastic moduli of the damaged and the undamaged elements, respectively.
and E0 are elastic moduli of the damaged and the undamaged elements, respectively.
No initial damage is incorporated in this model at the beginning D=0. According to the constitutive relationship of the mesoscopic element under uniaxial tension as shown in Fig.2, the damage evolution of the element can be expressed as
 (10)
(10)
where ��t0 is the strain at the elastic limit, which is the threshold strain.
The parameters describing the stress-post peak mechanical behavior of the element, such as ultimate strain coefficient and residual strength coefficient, have little influence on the simulated failure process of material mesoscopic numerical model [1, 15]. Therefore, ��=2 and ��=0.1 were taken in this work.
Compressive (shear) damage is neglected because only tensile damage occurs according to the experience of materials subjected to static uniaxial tension condition.
4.1 Numerical simulation of rock specimen
Firstly, numerical specimens should be produced. Here R��, is assumed to conform to Weibull distribution and lognormal distribution, respectively, so is the initial elastic modulus. Suppose that ten rock specimens were subjected to uniaxial tension and produced with the following distribution parameters [16].
Weibull distribution: mR=1.5, mE=1.8, u0E=25 GPa, u0f=10 MPa, linear correlative coefficient ��RE=0.7, 0.6, 0.5, 0.4, 0.3.
Lognormal distribution: ��R=0.70, ��E=0.60, ��E= 25 GPa, ��f=10 MPa, ��RE=0.7, 0.6, 0.5, 0.4, 0.3.
The ten specimens are denoted as W-1, W-2, W-3, W-4, W-5 and L-1, L-2, L-3, L-4, L-5, respectively. Specimens with different linear correlative coefficients, ��RE=0.7, 0.6, 0.5, 0.4, 0.3, represent the randomly distributed mechanical property parameters (R�� and E0) from relatively strong linear correlativity to relatively weak linear correlativity. ��E is equal to 0.60 to produce a relatively heterogeneous rock specimen. Because the distribution of R�� is more heterogeneous than that of E0 in the material, mR is smaller than mE, and ��R is greater than ��E. Poisson ratio (��) of all elements is identical and its value is 0.2.
The failure process of two other specimens produced with independent tensile strength (ft0) and initial elastic modulus (E0) was also numerically simulated. The two other specimens are denoted as W-6 and L-6 as their mechanical properties conform to Weibull distribution and lognormal distribution respectively, whose average tensile strength and average initial elastic modulus are the same as those of the former specimens. Furthermore, both mf and mE are equal to 1.8, and ��f and ��E are equal to 0.6 for the two other specimens.
Fig.3 depicts the tension stress-strain curves for the specimens produced by the proposed property parameter selection method with different linear correlative coefficients between mechanical property parameters (R�� and E0), where the curves are normalized so that the strength failure points are superimposed on each other. The curves belong to Class��stress-strain ones, which monotonically increase in strain and have a clear post-peak region, indicating that the material fails in a stable fracture propagation manner. Although the constitutive law for the individual element in the numerical model is nearly brittle (with only 10% residual strength), a substantial non-linearity exists before and after the maximal stress. In the case of stronger linear correlativity, the stress-strain curve indicates more brittle behavior. However, in the case of weaker linear correlativity, it indicates less brittle behavior, even slightly ductile behavior.
It can be learnt that, the stress-strain relationship and the strength characterization depend strongly on the linear correlativity between comprehensive mechanical property parameter and initial elastic modulus of specimens. Under uniaxial tension, the shape of the stress-strain curve of the specimen with relatively weak linear correlation has gentler post-peak behavior. The maximal strength of the specimens is also related to the linear correlative coefficient. The larger the linear correlative coefficient, the larger the strength. As a result, the curve becomes more linear, indicating more brittle behavior in the stronger linear correlativity case and the sharper strength loss.
As shown in Fig.4(a), the nonlinear stress-strain curves of specimens W-3 (��RE is 0.5) and L-4 (��RE is 0.4) are typical Class��ones, which are similar to the curves of marble observed in laboratory experiments [17]. The simulated curves of specimens based on the improved method show stable fracture failure characteristic and evident phenomenon of nonlinear hardening and stress-strain softening, which is identical to the laboratory experimental investigation. However, the simulated curves of specimen with independent tensile strength and initial elastic modulus indicate brittle fracture failure characteristic after nonlinear hardening phase (Fig.4(b)).
The progressive failure process of rock specimen in a stable fracture propagation manner under uniaxial tension is captured in the numerical simulation with the proposed property parameter selection method. A detailed view of failure process of specimen W-3 at 12 selected stress levels is shown in Fig.5 when property parameters R�� and E0 conform to Weibull distribution, which is due to fracture initiation, propagation and coalescence. Dots in the specimens shown in Fig.5 indicate local material damaged. The darker the dot, the larger the value of the damage. From the early loading to until 50%-60% of the peak stress, fracture development is relatively sparse in specimen and distributes uniformly. A population of randomly located, noninteracting
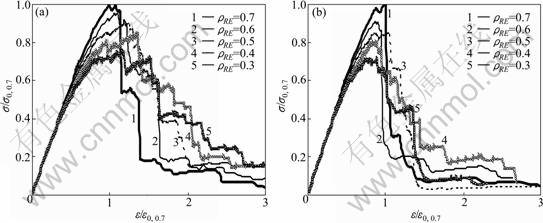
Fig.3 Stress-strain curves of specimens with different linear correlative coefficients (��RE) between comprehensive property parameter R�� and initial elastic modulus E0 (��0, 0.7 is peak stress of specimen with ��RE equal to 0.7 and ��0, 0.7 is strain corresponding to peak stress): (a) Weibull distribution; (b) Lognormal distribution
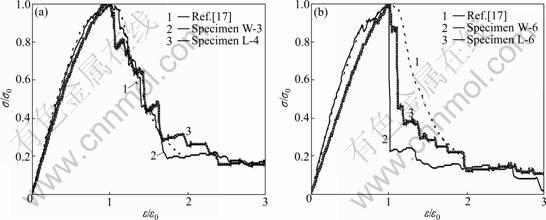
Fig.4 Comparison between simulated stress-strain curves and those of laboratory experiment of marble in Ref.[17] (��0 is peak stress of specimen and ��0 is strain corresponding to peak stress): (a) With correlated R�� and E0; (b) With independent ft0 and E0
fracture is observed and no relation to the location or inclination of the future fracture can be observed. As shown in Fig.4(a), macro stress increases proportionally with the increase of strain and specimen is in linear elastic state.
Afterward, fracture development speeds up gradually and the stress-strain curve is slightly convex (Fig.4(a)). As the load reaches a high level (70%-80% of peak stress), localized fracture is observed in some weak positions, which leads to the formation of local fracture zones. The zones are isolated from each other. With further increase of the load until specimen reaches peak stress state, a primary fracture zone near the specimen center is developed due to the propagation and coalescence of some local fracture zones. After the peak stress state, which is about 90% of the peak stress, the new damaged elements increase rapidly and mainly distribute in the primary fracture zone. Finally, the primary fracture zone spreads to form a macro crack traversed specimen and the specimen loses its loading capacity. So, R�� and E0 conform to lognormal distribution in the failure process.
For the specimen produced with independent property parameters, the failure process before peak stress state is basically identical to that of specimen produced with the proposed property parameter selection method. However, the local fracture spreads in an unstable manner after the peak stress, and a macro crack forms instantly and traverses the specimen.
It can be learnt that the simulated results are determined from the material mechanical parameter selection method. The simulated failure process of the rock is brittle for the case using independent elastic modulus and tensile strength as the basic physical mechanical parameters of the rock. However, the progressive failure process in a stable fracture propagation manner can be captured with the improved parameter selection method.
4.2 Numerical simulation of concrete specimen
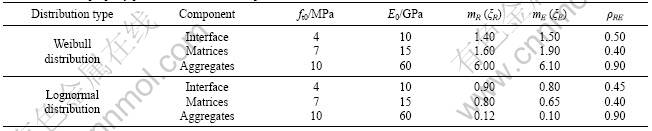
Concrete is assumed to be a three-phase composite composed of matrices, aggregates and interface between them in the numerical simulation. Additionally, the mechanical properties of each phase are different. In order to reflect the heterogeneity of each phase in concrete at the mesoscopic level, the concrete is numerically described by many mesoscopic elements with the same size and the correlated mechanical property parameters (R�� and E0) of each phase are assumed to conform to specific distributions. Two numerical specimens were produced randomly by computer according to specific Weibull distribution and lognormal distribution, respectively. The maximum grain size of aggregate is 10 mm, and the aggregate areal fraction of specimens is 45%. The distribution parameters for the three phases of concrete specimens are listed in Table 1 [8]. Poisson ratios of all the aggregate elements are identical, as well as those of all the matrices elements and all interface elements, and the values are 0.18, 0.20 and 0.25, respectively. For comparison, two other numerical specimens were produced with independent tensile strength and initial elastic modulus, and the homogeneity index of tensile strength is the same as that of elastic modulus in the two
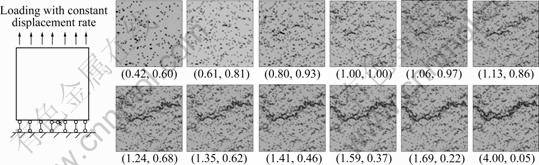
Fig.5 Simulated failure process of rock under uniaxial tension with correlated R�� and E0 at 12 selected stress levels (R�� and E0 conform to Weibull distribution; and values in brackets are respectively normalized strain and stress corresponding to Fig.4(a))
Table 1 Material property parameters for concrete specimens
other specimens.
The simulated results were compared with the laboratory experimental results of concrete under uniaxial tension [18] to verify the simulated results and the rationality of the improved property parameter selection method. It should be pointed out that the mesoscopic numerical simulation is not for the laboratory experiment in Ref.[18], which is different in mechanical property parameter values, specimen shape, and aggregate size. But it is reasonable to verify the simulated results by comparing their stress-stain curves and failure characteristics.
It is confirmed by lots of concrete laboratory experiments that complete stress-strain curve of concrete under uniaxial tension contains both nonlinear hardening phase and stain softening phase [18-20]. Those characteristics can be observed in the simulated results of the specimens produced with the improved property parameter selection method. As shown in Fig.6(a), the stress stepwise dropping at the end of stress-strain curve may be caused by that the friction and aggregate interlock after elements are damaged are not taken into consideration in the numerical simulation.
For specimens produced with independent tensile strength and initial elastic modulus, simulated stress-strain curves have little nonlinear hardening phase before peak stress. Additionally, the fracture spreads in an unstable manner, which leads to a nearly vertical stress drop until loading capacity reaches 10%-20% of strength and brittle failure to the specimen (Fig.6(b)).
The failure process of concrete specimen based on the improved property parameter selection method is shown in Fig.7 for material property parameters conforming to lognormal distribution. At the early loading stage, the tensile damage initiates at the interface between aggregates and matrices and randomly distributes in the specimen. With the increase of displacement the localized concentration of stress or strain around failed locations is arrested, which results in the formation of local fracture zones. After the peak stress state, the local fracture zones extend bypassing the aggregate. Some of them interconnect each other to form a main crack traversed specimen. Finally, the specimen fails and loses load capability owing to large deformation.
The mesoscale heterogeneity is the root cause of the

Fig.6 Comparison between simulated stress-strain curves and those of laboratory experiment of concrete (water-to-cement ratio is 0.6; ��0 is 1.686 MPa; ��0 is 73��10-6) in Ref.[18]: (a) With correlated R�� and E0; (b) With independent ft0 and E0
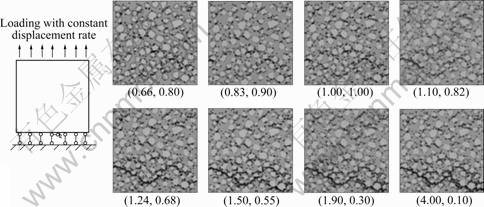
Fig.7 Simulated failure process of concrete under uniaxial tension with correlated R�� and E0 at eight selected stress levels (dots indicate damage; R�� and E0 of numerical specimens conform to lognormal distribution; and values in brackets are normalized strain and stress, respectively)
macroscopic nonlinear mechanical properties of rock and concrete under uniaxial tension. The heterogeneity is not arbitrary but organized, which can be better reflected by the improved parameter selection method. The numerical simulation based on the improved property parameter selecting method is capable of capturing the progressive failure process of concrete under uniaxial tension from localization failure to structural failure, which is an effective tool for further study on the concrete nonlinear mechanical behavior.
5 Conclusions
(1) There is a limitation to introducing the mesoscale heterogeneity into materials with independently distributed strength and elastic modulus for the mesoscopic numerical simulation of rock and concrete failure process. Each of them implies only one aspect of the heterogeneity of mechanical property in materials.
(2) The product of strength and elastic modulus is considered to be a comprehensive mechanical property parameter for mesoscopic materials, which denotes the combination of load bearing ability and deformation resistance. The tensile failure process of rock and concrete in a stable fracture propagation manner is simulated, which shows good conformity with the available laboratory experiment.
(3) The macro stress-strain curves and the strength characteristics of rock and concrete depend strongly on the linear correlativity between mechanical property parameters. The curves indicate more brittle behavior and higher macroscopic strength of materials in the stronger linear correlativity case.
(4) New property parameter should be studied to reflect the heterogeneity more rationally. For instance, the property parameter may be the following forms of strength and elastic modulus besides the product form:
![]()
where Wc is the curtail value of the elastic strain energy of ideally brittle material when failure occurs under tensile stress. In addition, the distribution features of material mechanical property parameters such as the heterogeneity index and the linear correlative coefficient should be determined more accurately.
References
[1] Bazant Z P, Tabbara M R, Kazemi M T, Pijaudier-Cabot G. Random particle models for fracture of aggregate or fiber composites [J]. Journal of Engineering Mechanics, 1990, 116(8): 1686-1705.
[2] Lilliu G, van MIER J G M. 3D lattice type fracture model for concrete [J]. Engineering Fracture Mechanics, 2003, 70(7/8): 927-941.
[3] Liu Guang-ting, Wang Zong-min. Simulation of the fracture of concrete with random aggregate model [J]. Journal of Tsinghua University, 1996, 36(1): 84-89. (in Chinese)
[4] Tang C A. Numerical simulation of progressive rock failure and associated seismicity [J]. International Journal of Rock Mechanics and Mining Sciences, 1997, 34(2): 249-261.
[5] Tang C A, Yang W T, Fu Y F, Xu X H. A new approach to numerical method of modeling geological processes and rock engineering problems-continuum to discontinuum and linearity to nonlinearity [J]. Engineering Geology, 1998, 49(3/4): 207-214.
[6] Zhu W C, Tang C A. Numerical simulation of Brazilian disk rock failure under static and dynamic loading [J]. International Journal of Rock Mechanics and Mining Sciences, 2006, 43(2): 236-252.
[7] Zuo Yu-jun, Tang Chun-an, Zhu Wan-cheng, Li Di-yuan, Li Shu-cai. Numerical analysis of tunnel reinforcing influences on failure process of surrounding rock under explosive stress waves [J]. Journal of Central South University of Technology, 2008, 15(5): 632-638.
[8] Zhu W C, Tang C A. Numerical simulation on shear fracture process of concrete using mesoscopic mechanical model [J]. Construction and Building Materials, 2002, 16(8): 453-463.
[9] Gong Jin-xin. Computational methods for reliability of engineering structures [M]. Dalian: Dalian University of Technology Press, 2003: 36-43. (in Chinese)
[10] Liang Zheng-zhao, Tang Chun-an, Zhang Yong-bin, Ma Tian-hui. On probability model of physico-mechanical parameters of quasi-brittle material and associated mechanical failure behaviors [J]. Chinese Journal of Rock Mechanics and Engineering, 2008, 27(4): 718-727. (in Chinese)
[11] Rudajev V, Vilhelm J, Koz��k J, Lokaj��?ek T. Statistical precursors of instability of loaded rock samples based on acoustic emission [J]. International Journal of Rock Mechanics and Mining Sciences, 1996, 33(7): 743-748.
[12] P?ikryl R, Lokaj��?ek T, Li C, Rudajev V. Acoustic emission characteristics and failure of uniaxially stressed granitic rocks: The effect of rock fabric [J]. Rock Mechanics and Rock Engineering, 2003, 36(4): 255-270.
[13] Noh Y, Choi K K, Du L. Reliability-based design optimization of problems with correlated input variables using a Gaussian Copula [J]. Structural and Multidisciplinary Optimization, 2009, 38(1): 1-16.
[14] Madsen H O, Krenk s, Lind N C. Methods of structural safety [M]. New York: Dover Publications, 2006: 204-220.
[15] Tang Chun-an, Zhu Wan-cheng. Numerical test of damage and fracture of concrete [M]. Beijing: Science Press, 2003: 45-49. (in Chinese)
[16] Tang C A, Liu H, Lee P K K, Tsui Y, Tham L G. Numerical studies of the influence of microstructure on rock failure in uniaxial compression. Part I: Effect of heterogeneity [J]. International Journal of Rock Mechanics and Mining Sciences, 2000, 37(4): 555-569.
[17] Okubo S, Fukui K. Complete stress-strain curves for various rock types in uniaxial tension [J]. International Journal of Rock Mechanics and Mining Sciences and Geomechanics Abstracts, 1996, 33(6): 549-556.
[18] Liu Xi-la, Wen Bin. Concrete strain softening considering global boundary conditions [J]. Chinese Journal of Rock Mechanics and Engineering, 2008, 27(5): 885-892. (in Chinese)
[19] Carpinteri A, Ferro G. Scaling behavior and dual renormalization of experimental tensile softening responses [J]. Material and Structures, 1998, 31(5): 303-309.
[20] van VLIEJ M R A, van MIER J G M. Effect of strain gradients on the size effect of concrete in uniaxial tension [J]. International Journal of Fracture, 1999, 95(1/2/3/4): 195-219.
Foundation item: Project(50679006) supported by the National Natural Science Foundation of China; Project(NCET-06-0270) supported by the Program for New Century Excellent Talents in University
Received date: 2009-11-06; Accepted date: 2010-04-18
Corresponding author: Liu Zhi-guang, Doctoral candidate; Tel: +86-411-84705357; E-mail: liuzg1981@163.com
