
J. Cent. South Univ. Technol. (2008) 15: 224-229
DOI: 10.1007/s11771-008-0043-6
![]()
Chaotic time series prediction for surrounding rock��s deformation of deep mine lanes in soft rock
LI Xi-bing(��Ϧ��)1, WANG Qi-sheng(����ʤ)1, 2, YAO Jin-rui(Ҧ����)3, ZHAO Guo-yan(�Թ���)1
(1. School of Resources and Safety Engineering, Central South University, Changsha 410083, China;
2. School of Energy Sources Engineering, Henan Polytechnic University, Jiaozuo 454150, China;
3. Guizhou Kaiyang Phosphor Mine Group Co., Guiyang 532000, China)
Abstract:
Based on the measured displacements, the change laws of the effect of distance in phase space on the deformation of mine lane were analyzed and the chaotic time series model to predict the surrounding rocks deformation of deep mine lane in soft rock by nonlinear theory and methods was established. The chaotic attractor dimension(D) and the largest Lyapunov index(Emax) were put forward to determine whether the deformation process of mine lane is chaotic and the degree of chaos. The analysis of examples indicates that when D��2 and Emax��0, the surrounding rock��s deformation of deep mine lane in soft rock is the chaotic process and the laws of the deformation can still be well demonstrated by the method of the reconstructive state space. Comparing with the prediction of linear time series and grey prediction, the chaotic time series prediction has higher accuracy and the prediction results can provide theoretical basis for reasonable support of mine lane in soft rock. The time of the second support in Maluping Mine of Guizhou, China, is determined to arrange at about 40 d after the initial support according to the prediction results.
Key words:
deformation; prediction; mine lane in soft rock; surrounding rock; chaos; time series��
1 Introduction
With the increase of excavation depth, the surrounding rock of mine lane gets into a complex mechanical environment. The stability control of surrounding rock of deep mine lane in soft rock has become a major problem of safe mining[1-4]. The surrounding rock��s deformation of mine lane is the dynamic random process[5-6]. Therefore, dynamic data analytic methods should be used in the prediction of the development tendency to the surrounding rock��s deformation of mine lane. In the past, most of the linear models such as grey models[7-8], time series AR models[9], MA model[10] and ARMA models[11] were adopted. These models are stronger subjective and have low accuracy. However, deep soft rock is a special mechanical medium of nonlinearity, inhomogeneity, anisotropy and rheology. Thus the deformation and mechanical features of soft rock have great difference from those of linear mechanical medium. The most prominent feature is that the mechanical process of the deformation of mine lane is uncertain and random, that is, the mechanical properties are chaotic. It reflects the chaotic system containing the characteristics of being order and disorder combined with certainty and randomness. On the one hand, chaos is a random behavior of uncertainty in nonlinear system; on the other hand, there are chaotic attractors in chaotic system. The attractors attract each other and maintain stability under small disturbance, it is an invariable in movement as a whole[12]. This indicates that the behavior of chaotic systems can be predicted[13-14].
Therefore, in this work, the surrounding rock��s deformation process of deep mine lane in soft rock at Maluping Mine Subordinate to Kaiyang Phosphor Mine Group Co. in Guizhou Province, was studied as a practical example. The chaotic time series model was built to predict the surrounding rock��s deformation of mine lane by chaotic theory.
2 Prediction model of chaotic time series of surrounding rock��s deformation of mine lane
2.1 Reconstruction of state space
The surrounding rock��s deformation process of mine lane is actually a complex dynamic system that is influenced by multivariables, such as excavation depth, in-situ stress, geological constitution, support styles, construction methods, construction organization and arrangement and some other factors. According to the thoughts of state space reconstruction, in the state space reconstruction of a system, the time series of a variable
contains correlative dynamic information of other variables involved in the system[15-17]. The behavior of the system can be characterized by the evolution orbits of variables in the state space[16]. In view of this, time series of the mine lane��s displacement can be reconstructed to get a state space reflecting its deformation process. Then characteristic values of this state space can be calculated to analyze the intrinsic relationship of the variables that affect the deformation of mine lane.
The measured displacement is a single variable time series collected at certain time: {x(ti)=1, 2, ???, n}. According to Refs.[16, 18], embedding m-dimensional state space into time series mine lane��s displacement, a new time series that contains part information of mine lane��s displacement changing with time can be obtained. The phase distribution of the new time series is
 (1)
(1)
where �� is the time-delay, ��=�Ǧ�t (��=1, 2, ???), ?t is the time interval of data collection; N denotes the number of embedding points, N=n-(m-1)��, respectively.
2.2 Determination of chaotic attractor dimension
Chaotic attractor dimension(D) of the surrounding rock deformation time series can be calculated by the method in Refs.[15, 19].
Suppose that there are N vectors of Yi (i=1, 2, ???, N) in m-dimensional reconstructed state space. If the Euclidean distance of two vectors Yi and Yj is denoted by rij, there will exist a sufficiently small distance ��. The correlation integral is used to describe the probability C(��, m) of the distance of arbitrary two points that is smaller than �� in the reconstructed state space of chaotic time series.
![]() (0�ܦˡ�1) (2)
(0�ܦˡ�1) (2)
where H(?) is Heaviside function, and
1, �ˣ�0
![]() 0, �ˡ�0 (3)
0, �ˡ�0 (3)
When the embedding dimension m is increased, C(��, m) will be increased at D(m) index. That is, C(��, m)= K+��D(m), where K is constant. Then attractor dimension D can be obtained by
![]() (4)
(4)
According to Eqn.(4), when the embedding dimension m reaches a certain value, D tends to saturation, and when D��2, the system is chaotic. Therefore, the chaotic attractor dimension D is an important indicator to determine whether the system reaches chaos or not.
2.3 Calculation and prediction of largest Lyapunov exponent
Lyapunov index(Emax) is a parameter that describes the attracting or segregating degree of two nearest tracks at exponential law with time in the state space. It is also an indicator to measure a chaotic system��s sensitive dependence on initial conditions. Emax can be used to identify whether a system reaches chaos or not. When Emax��0, it means that the system is in a chaotic state, the larger Emax shows the higher chaotic degree of a system. When Emax��0, the system is in the quasi-periodic or cyclical pattern of movement.
Time series with few data points and the multi-dimensional G-P algorithm can be used to calculate Emax[20]. Firstly, time series of mine lane��s displacement {x(ti), i=1, 2, ???, n} is fast Fourier transformed to calculate the average cycle T; secondly, in the reconstructed state space, for every Yi, search for its nearest neighboring points and limit short-term separation each other to let its nearest neighboring points move separately along with orbits. Then the distance of every Yi in state space to its nearest neighbor is
![]() (5)
(5)
Accordingly, the distance between point j and its nearest point at discrete time steps can be worked out:
![]() (6)
(6)
If the nearest point i is divergent similar to the index of Emax, then the average value ?(j) of ln ri(j) for all i can be obtained, namely
![]() (7)
(7)
where n is the number of non-zero ri(j). By the least square linear regression, the slope of approximate linear equals the largest Lyapunov exponent Emax:
 (8)
(8)
2.4 Establishment of prediction equation
If Y(tN) is the predictive center point, the neighboring points of Y(tN) are Ybi(tN) in state space. Y(tN+T) is the evolutional value of Y(tN) after time T. Then the prediction equation can be denoted by
![]() (9)
(9)
where ��=1, 2, ???; N denotes the number of embedding points, N=n-(m-1)��. According to Eqn.(9), if only T�ܦ�, only x(tN+T) will be unknown in Eqn.(1), and other (m-1) components will be all known. Therefore, the prediction values can be obtained by Eqn.(9).
3 Project example
3.1 Establishment of prediction equation
The law on the deformation and damage of surrounding rock of mine lane is should be understood more completely when deep mine lane excavated, so as to provide a theoretical basis for the optimum design of the support parameters. In this work, the middle transportation tunnel at level 700 of Maluping Mine belonging to Kaiyang Phosphor Mine Group Co. in Guizhou Province was selected as experimental mine lane. Three observation sections were located at the sites of excavation, the first jet and the re-sprayed. Four displacement observation points were arranged on each section. The surface displacement of mine lane was monitored by the tunnel displacement monitor SWJ-�� in the period of 120 d. The change curves of measured displacement with time are shown in Fig.1.
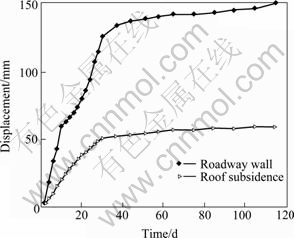
Fig.1 Relationship between displacement and time for mine lane
From Fig.1, the surface displacement of mine lane shows remarkable time effect, revealing obvious stages. The deformation of mine lane is at the sharp deformation stage in the periods of the mine lane excavation and the first support (about 40 d). The deformation velocity is larger than 0.4 mm/d. The accumulative deformation reaches 60%-80% of the whole deformation. After the second support, the deformation velocity becomes small obviously, and the deformation is at the stages of the even speed and speed-down. The relationship between displacement and time is
U(t)=Umax-Umaxexp[(t+a)/b] (10)
where U(t) is the convergence at time t, Umax is the largest convergence, a and b are constants. Regress results of convergence of experimental mine lane on different sections are shown in Table 1.
Table 1 Regress results of convergence of experimental mine lane

3.2 Chaotic prediction of surrounding rock��s de- formation of mine lane
Based on the measured data of mine lane displacement and the time delay (��=1), firstly, the average cycle T was calculated and the measured displacement of original time series of mine lane was cumulated and synthesized; secondly, its state space was reconstructed by Eqn.(1); thirdly, the probability that the distance of two random phase points in the reconstructed state space is smaller than �� was calculated by Eqn.(2), then curves of ln C(��, m)��ln �� can be gained, as shown in Fig.2.
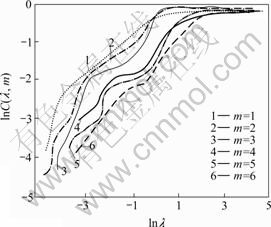
Fig.2 ln C(��, m)��ln �� curves of displacement time series for mine lane in soft rock (0�ܦˡ�1, m is embedding dimension)
Based on monitoring data (see Fig.1) and by using Eqn.(4), the chaotic attractor dimension was calculated to be D=3.217��2. The results show that when m=4, the gradient of the curve slope is the minimum. This also reflects that there are four relevant variables that influence the deformation process of mine lane. Therefore, the embedding dimension is 4. According to Eqn.(8), the largest Lyapunov exponent can be calculated as Emax=0.0362��0, which indicates that the reconstructed displacement time series of the mine lane is chaotic.
A representative mine lane in Maluping mine, Guizhou, China, was used as an example in this work. Based on the measured data of the surrounding rock��s deformation concerned places resprayed after 30 d, the surrounding rock��s deformation of mine lane sprayed was predicted by chaotic time series prediction, grey prediction and linear time series prediction methods, respectively. The predicted values by Eqn.(9) are listed in Tables 2 and 3.
Grey prediction was performed by GM(1, 1) model
in virtue of Ref.[2]. Suppose the displacement time series of the mine lane is ![]() corresponding to it, the time rank is t={t1, t2, ???, tN}, hence, the predicted values can be denoted by
corresponding to it, the time rank is t={t1, t2, ???, tN}, hence, the predicted values can be denoted by
![]() (11)
(11)
where k=1, 2, ��, N-1, a and u are constant.
Table 2 Predicted and measured results of mine lane wall��s displacement
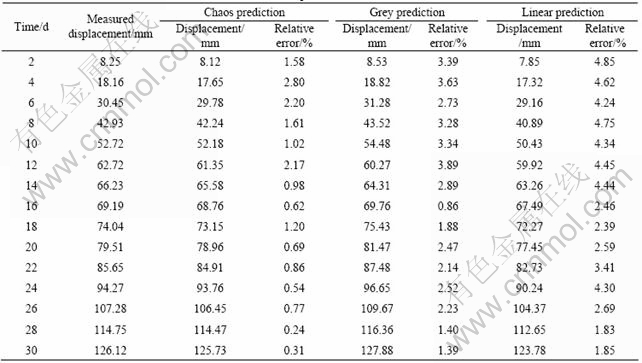
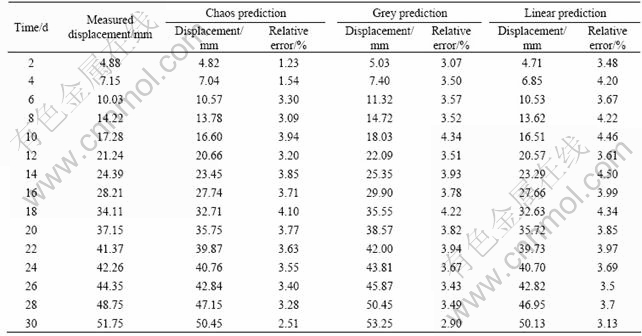
Table 3 Predicted and measured results of roof subsidence of mine lane
According to the original displacement time series and Eqn.(11), the prediction values of sides displacement of mine lane are
 (12)
(12)
The prediction values of roof subsidence of mine lane are
 (13)
(13)
By means of the linear regress method in Ref.[4], the prediction of the mine lane displacement was carried out at five steps. The measured and predicted results are shown in Tables 2 and 3. The measured and predicted curves of mine lane displacement are shown in Figs.3 and 4, respectively.
It can be seen from Tables 2 and 3, the average relative errors of the chaotic time series prediction, the
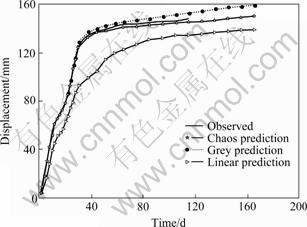
Fig.3 Predicted wall��s displacement curves of mine lane
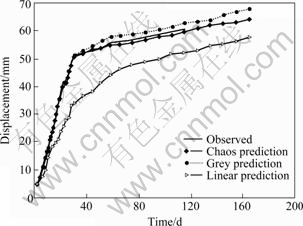
Fig.4 Predicted roof subsidence curves of mine lane
grey prediction and the linear time series prediction are 1.7%, 3.4% and 3.9%, respectively. And from Figs.3 and 4, compared with the grey prediction and the linear time series prediction methods, the chaotic time series prediction method shows much more smaller relative error and the higher accuracy. That is to say, the chaotic time series prediction model is in a good agreement with the actual evolution process of the deformation of mine lane.
The results of monitoring in situ and predicting of soft rock mine lane deformation in Maluping Mine indicate that the surrounding rock��s deformation energy of mine lane cannot release thoroughly after the initial support, and the deformation and damage of mine lane are still prominent. According to the deformation curves of mine lane, about 40 d after the initial support, the surrounding rock��s deformation of mine lane tends to be relatively stable. Therefore, the time of the second support should be arranged at about 40 d after the initial support.
4 Conclusions
1) By reconstructing state space of mine lane��s displacement time series, the chaotic attractor dimension D and the largest Lyapunov index (Emax) are proposed to determine whether the deformation process of mine lane is chaotic or not and the degree of chaos. When D��2 and Emax��0, the surrounding rock��s deformation of deep mine lane in soft rock is the chaotic process and the laws of deformation can still be well demonstrated by the method of the reconstructive state space.
2) The surrounding rock��s deformation of mine lane in soft rock is the chaotic process involved in multivariate during the evolution. By means of reconstruction of mine lane��s displacement time series, the evolution orbits of relevant variables during the mine lane deformation process in the state space can be obtained, which reveals the intrinsic laws of all relevant variables in the deformation process of mine lane.
3) Three methods such as the chaotic time series, the linear time series and the grey model are used to predict the surrounding rock��s deformation of mine lane in soft rock. The results indicate that the chaotic time series prediction model is similar to realistic situations, and its accuracy is the highest.
4) The prediction results of the surrounding rock��s deformation of mine lane can provide a reliable theoretical basis for reasonable support of mine lane in soft rock. Experimental results of Maluping Mine of Guizhou, Chna, indicate that the time of the second support should be arranged at about 40 d after the initial support.
References
[1] HE Man-chao. Soft rock roadway of Chinese coal mining support theory and practice[M]. Xuzhou: China University of Mining and Technology Press, 1996: 1-17. (in Chinese)
[2] ZHAI Xin-xian, LI Di-quan, SHAO Qiang. Control over surrounding rocks deformation of soft floor and whole-coal gateways with trapezoidal supports[J]. Journal of China University of Mining and Technology, 2005, 25(2): 118-123. (in Chinese)
[3] ZHANG Yong, HUA An-zeng. Study of the dynamic stability of tunnel system [J]. Journal of China Coal Society, 2003, 28(1): 22-25.
[4] LI Shu-cai, WANG Ming-bin. An elastic stress-displacement solution for a lined tunnel at great depth[J]. International Journal of Rock Mechanics and Mining Sciences, 2007, 45(4): 486-494.
[5] WANG C, WANG Y, LU S. Deformational behavior of roadways in soft rocks in underground coal mines and principles for stability control[J]. International Journal of Rock Mechanics and Mining Sciences, 2000, 37(10): 937-946.
[6] WU Yong-ping, HUANG Chao-hui, ZENG You-fu, WANG Chao. Analysis of collapse of surrounding and stability control in soft rock mine lane in a deep mine[J]. Science Technology and Engineering, 2006, 23(10): 3280-3290.
[7] BI Xiang-yang, WANG Yong-yan, FEN Chang-jian. Using gray model to predict the deformation of the enclosing rock around tunnels[J]. Journal of Liaoning Technical University: Natural Science, 1999, 12(6): 586-589. (in Chinese)
[8] SUN Qi-han, WANG Yong-yan. Using gray theory to predict the displacement of the enclosing rock around tunnels[J]. Chinese Journal of Applied Mechanics, 1997, 18(3): 136-140. (in Chinese)
[9] FAN J, YAO Q, CAI Z. Adaptive varying-coefficient linear model[J]. Journal of the U.K. Royal Statistical Society: Series B, 2003, 65(7): 57-80.
[10] TSOLAKI E P. Testing nonstationary time series for Gaussianity and linearity using the evolutionary bispectrum: An application to internet traffic data[J]. Signal Processing, 2007, 88(6): 1355-1367.
[11] CHEN Zi-ying. Time series analysis[J]. Chinese Journal of Geotechnical Engineering, 1991, 13(4): 87-95. (in Chinese)
[12] NEIL R S. Chaotic dynamics of nonlinear systems[M]. New York: Johnwiley and Sons, 1989: 126-135.
[13] LIU Zhi-xiang, LI Xi-bing. Chaotic optimization of tails gradation[J]. Journal of Central South University: Science and Technology, 2005, 36(4): 683-688. (in Chinese)
[14] JIANG Wei-dong, LI Xi-bing. Spatiotemporal chaos model of seepage line in tailings dam and its back analysis[J]. Journal of Central South University: Science and Technology, 2003, 34(6): 704-706. (in Chinese)
[15] TAKENS F. Detecting strange attractors in turbulence [C]// Dynamical Systems and Turbulence. Berlin: Spring-Verlag, 1981: 366-381.
[16] PACKARD C. Geometry from time Series[J]. Phys Rev Lett, 1980, 45(8): 712-716.
[17] FRASER A M, SWINNEY H L. Independent coordinates for strange attractors[J]. Physical Review A, 1986, 33(2): 1134-1140.
[18] KENNEL M B, BROWN R, ABARBANEL H D J. Determining embedding dimensions for phase space chaotic data[J]. Phys Rev A, 1992, 45(6): 3403-3411.
[19] ABARBANEL H D J, KENNEL M B. Local false nearest neighbors and dynamical dimensions from observed chaotic data[J]. Phys Rev E, 1993, 47(5): 3057-3068.
[20] GRAASSBERGER P, PROCACCIACA I. Characterization of strange attractors[J]. Physical Review Letters, 1983, 50(5): 346-349.
(Edited by CHEN Wei-ping)
Foundation item: Project(50490274) supported by the National Natural Science Foundation of China
Received date: 2007-07-21; Accepted date: 2007-09-12
Corresponding author: LI Xi-bing, PhD, Professor; Tel: +86-731-8879612; E-mail: xbli@mail.csu.edu.cn
