
J. Cent. South Univ. (2016) 23: 1032-1039
DOI: 10.1007/s11771-016-0352-0

Optimization and mechanism of surfactant accelerating leaching test
AI Chun-ming(������)1, WU Ai-xiang(�Ⱞ��)2, WANG Yi-ming(������)2, HOU Chun-lai(���)2
1. College of Safety Science and Engineering, Liaoning Technical University, Huludao 125105, China;
2. School of Civil and Environment Engineering, University of Science and Technology Beijing, Beijing 100083, China
 Central South University Press and Springer-Verlag Berlin Heidelberg 2016
Abstract:
To solve the problem of slow leaching speed of copper, surfactant was added into lixivium as leaching agent in the experiment. Based on physical chemistry and seepage flow mechanics, the leaching mechanics of surfactant was analyzed. The solution surface tension and surfactant adsorbing on the surface of ore have a significant impact on the surface wetting effect. With leaching rate for response, the study screened out three main factors by Plackett-Burman design method: the sulfuric acid concentration, surfactant concentration and temperature. Among these three factors, the surfactant concentration is the most important contributor to leaching rate. After obtaining the experiment center by the steepest ascent experiment, a continuous variable surface model was built by response surface methodology. By solving quadratic polynomial equation, optimal conditions for leaching were finally obtained as follows: the sulfuric acid concentration was 60 g/L, the surfactant concentration was 0.00914 mol/L, and the temperature was 45 ��C. The leaching rate was 66.81% in the optimized leaching conditions, which was close to the predicted value, showing that regression result was good.
Key words:
surfactant; optimization; leaching; response surface��
1 Introduction
Based on physical chemistry, mass transfer and dynamic action, solution mining is a mining method which uses leaching reagent to dissolve useful components in ore from solid into lixivium and then extract metal from lixivium [1-2]. In the process of leaching, the lixivium contacting and reacting are two cruxes of solution mining [3]. When the capacity of chemical reaction between lixivium and ore is constant, the contacting condition, wettability and penetration effect determine the leaching rate.
To solve the problem that the surface tension of liquid hinders the contact between lixivium and ore, adding surfactant into solution has been considered. Substance that has or is related to the property of significantly altering surface properties in low concentration can be classified as surfactant [4]. Research shows that adding surfactant into lixivium will decline surface tension, and increase the hydrophlia of ore, because bacteria is easier to get contact with ore, so that the leaching speed is improved [5-9]. In 1964, Duncan carried out a research on the impact of surfactant toward T. f. (Thiobacillus ferrooxidans) leaching chalcopyrite. When the concentration of Twain 20 was between 0.001% and 0.003%, leaching effectiveness was the best and the maximum leaching rate of copper was 85% [10]. SIERAKOWSKI and LEE [11] added fluoride aliphatic surfactant into sulfuric acid solution, and leaching rate was increased by 4.79% [11]. Adding surfactant will become an efficient way of improving ore heap penetrability and increasing ore leaching rate, which has great prospect in the future [12-15].
Optimization leaching condition is very important to increase ore leaching rate. By using response surface methodology, the study not only can have less frequency of experiment and shorter experimental cycle, but also can obtain regression equation of factors and response values. All of these advantages can make up for the deficiency of previous method [16].
In the preliminary works, lauryl sodium sulfate was screened out as leaching agent for copper ore leaching. In order to further improve its potential, leaching rate was chosen as response value. First of all, important factors that have impact on leaching rate by Plachkett-Burman method were determined. Secondly, biggest corresponding domain was got by the steepest ascent design. Finally, important factors impacting leaching rate were optimized by continuous variable surface model built with response surface methodology.
2 Experimental material and principle
2.1 Experimental material
2.1.1 Ore samples
Experimental ore samples were taken from a copper mine in Yunnan province, China, which was collected by heap leaching. The ore is high argillaceous alkaline oxidation ore, whose grade is 1.26%. Phase analysis was applied to ore by X-ray scattering techniques. The results are presented in Table 1.
Table 1 Chemical composition of copper ore (mass fraction, %)
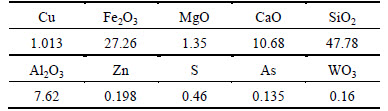
Table 1 shows that silicate is the main gangue mineral followed by oxides. The content of alkaline mineral is over 40%. This copper mine is a typical refractory high-alkaline oxidized copper ore. In the experiment, ore samples below 200 mesh were used when leaching ore.
2.1.2 Preparation of solution
Sulfuric acid was chosen as leaching agent in the experiment. The sulfuric acid concentration was represented by the mess of 98% concentrated sulfuric acid per unit volume acid.
Lauryl sodium sulfate (anionic) was chosen as surfactant. The relative molecular mass was 288 mol/L and critical Micelle concentration (CMC) was 0.008 mol/L.
2.2 Experimental principles
2.2.1 Adsorption of surfactant on ore surface
Ore surface absorption of surfactant in the lixivium will have an impact on the wetting effect. Copper ore surface generally presents electronegativity. The polar group of anionic surfactant is negatively charged towards lixivium, which is conducive to promote ore surface to contact with lixivium, as shown in Fig. 1(a).
The targeted ore mineral distributed on the ore surface can easily react with lixivium, but ore mineral inside is difficult to be leached since the lixivium can hardly penetrate. Anionic surfactant is absorbed in the fissures (Fig. 1(b)) so that it will promote lixivium to penetrate and have chemical reactions in the ore interior.
2.2.2 Improving wettability of ore surface
When liquid drops on the surface of solid, it may spread out or form a liquid drop. The three-phase boundary of solid, liquid and gas is called gas-liquid boundary tangent. The angle, which is in the liquid, between the tangent and the solid interface, is called contact angle. It is symbolized by ��, as shown in Fig. 2.
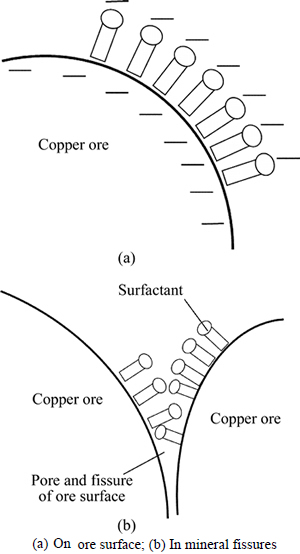
Fig. 1 Adsorption of anionic surfactant on ore surface:
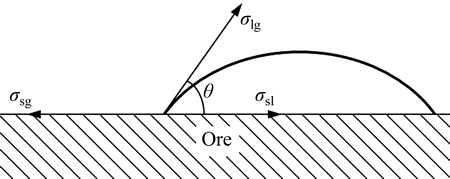
Fig. 2 Contact angle of ore surface
The relation between contact angle, solid-liquid tension, solid-gas tension and gas-liquid tension can be presented as follows:
 (1)
(1)
where ��sl, ��sg and ��lg are solid-liquid tension, solid-gas tension and gas-liquid tension in unit area.
Based on the analysis above, surfactant can decline the surface tension and solid-liquid tension of the solution. According to Eq. (1), both ��sl and ��lg decrease, so that cos�� increases. For the ore surface (��<90��), �� will decrease. Wettability will be better with the decline of ��. So, adding surfactant can enhance the wettability of lixivium on the ore surface.
2.2.3 Other effects
Adding surfactant is beneficial for solution to spread over the ore particles, which increases the flow velocity so that the mass transfer processes and leaching speed can get faster. Increasing the solution flow velocity will decrease the thickness of the liquid film and relatively increase convective diffusion, which is beneficial for leaching reaction. Besides, surfactant enhances concentration gradient on the both sides of liquid film on ore surface. It can also intensify the diffusion and convective diffusion as well as increase the reaction rate, thus increasing leaching rate of copper ore.
3 PB experiment
3.1 Experiment design
Based on the single factor experiment, possible factors impacting copper ore leaching can be obtained. By investigating 7 factors including A (sulfuric acid concentration), B (surfactant concentration), C (table speed), D (temperature), E (liquid-to-solid ratio), F (leaching time) and H (ore maximum particle size), N=11 PB design was finally chosen. Considering the error, four virtual teams and two levels (high and low) for each factor were set, with +1 standing for the high level and -1 standing for the low level, as given in Table 2. Significant analysis toward every factor of the experimental results was carried out by software ��Design-expert��. With P value of factors less than 0.05 as main influencing factors, the most influencing factors were finally obtained for leaching rate.
3.2 Analysis of results
Based on the results of PB experiment in Table 2, liner fitting for copper leaching rate was taken. The equation of leaching rate Y and seven factors is
Y=10.0898+0.4449A+1005.583B+0.0363C+0.4137D+0.0471E-0.0413F-0.0104G (2)
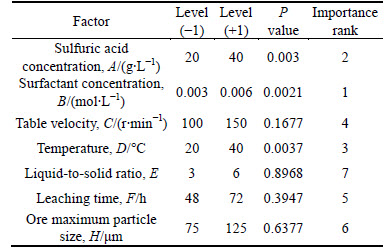
The contribution rate of seven factors for leaching rate is given in Table 3.
Through P values in Table 3, 3 of 7 factors were less than 0.05, which were significant factors, and significant degrees were: B (surfactant concentration)>A (sulfuric acid concentration)>D (temperature).
1) Surfactant could decline the surface tension of lixivium and decrease the contact angle of liquid on the ore surface, which was beneficial for the contact between solution and ore internal surface. More importantly, if the ore was totally wet, surfactant absorbing in the ore fissures made it easier for lixivium to penetrate into the ore.
2) Leaching reaction mainly happened between sulfuric acid and ore mineral. At the same time, the neutral reaction of alkaline substance with sulfuric acid will consume sulfuric acid. So, the sulfuric acid concentration was vital to leaching rate.
3) If the temperature was higher, leaching rate would be faster. And with the molecular motion getting faster, the convective diffusion velocity would be faster as well. Simultaneously, the increase of temperature would decline the surface tension and viscosity of lixivium, which benefited the ore surface wettability.
4 Steepest ascent experiment
The fit of response surface for equation will restore the real situation only in the adjacent area around the investigation area. The response surface and fitted equation will not be obtained in other areas. Therefore, the efficient response surface equation should be established in the adjacent area around the maximum leaching rate. Based on the conclusion of PB experiment, the ascent direction and the ascent step size were determined by the response value of each factor.
Table 2 Experimental design of Plackett-Burman design
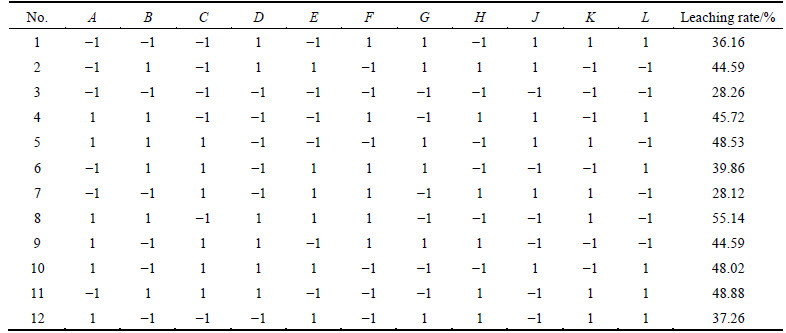
Table 3 Result of Plackett-Burman design
Since the coefficients B, A and D are positive, the surfactant concentration, acidity of sulfuric acid and the ascent direction of temperature are all positive. The step size of B is 0.003, the step size of A is 10, and the step size of D is 5. The experimental design and results are given in Table 4.
Table 4 Result of steepest ascent design
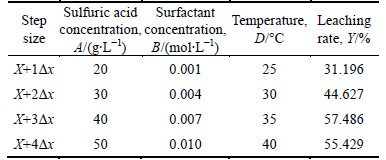
It was shown from the ascent experiment that the highest point existed between the X+3��x and X+4��x. Since the CMC of surfactant (lauryl sodium sulfate) was 0.008 mol/L, X+3��x should be chosen as the center point in the following center composition experiment. The conditions of center experiment were that the sulfuric acid concentration was 40 g/L, the surfactant concentration was 0.007 mol/L and the temperature was 35 ��C.
5 Response surface experiment
5.1 Experiment design
After getting significant factors of the leaching rate in the PB experiment and ensuring the experiment center by the steepest ascent experiment, the response surface experiment was conducted with leaching rate as response index. The Box-Behnken design was adopted in the experiment with three options (choices) for every factor, as given in Table 5.
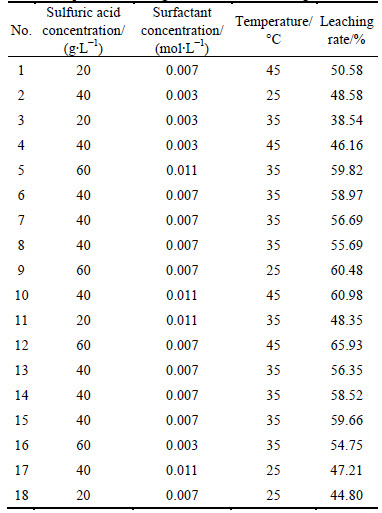
Based on the levels of three factors, the plan of response surface was got, as given in Table 6.
Table 5 Level of parameters for Box-Behnken design
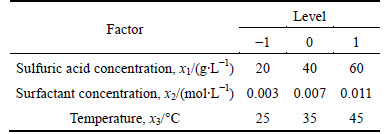
Table 6 Experimental design of Box-Behnken design
Leaching rate was chosen as response value in the experiment. The mutual relational model between each value Y and experiment factor x1 (sulfuric acid concentration), x2 (surfactant concentration) and x3 (temperature) was calculated by the quadratic polynomial in Eq. (3) as
 (3)
(3)
where Y is a predicted response value, ��0 is a constant, ��i is a linear coefficient, ��ii is a quadratics coefficient, ��ij is a mutual effect coefficient, and xi and xj are coding values of experimental factors.
5.2 Experimental results
5.2.1 Fitting of equation
The results of response surface experiment are given in Table 6 and a multiple quadratic regression equation is fitted from the result as
Y=12.2370+0.7417x1+3184.7917x2+0.2315x3-14.8125x1x2-4.125��10-4x1x3+101.1875x2x3- (4)
(4)
5.2.2 Fitted value and experimental value
According to Eq. (4), the fitted value of leaching rate can be calculated. After comparing fitted value with experimental value, the coordinate points were located with experimental value as abscissa and with predicted value as ordinate, as shown in Fig. 3.
It is shown in Fig. 3 that most of the points were located on or close to line y=x, demonstrating that predicted value was close to experimental value, so the fitting result was good.
5.2.3 Residual normal distribution
The distribution of standardized residual is shown in Fig. 4.
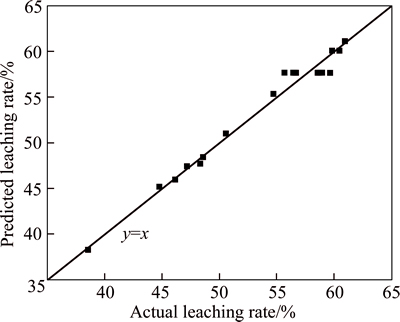
Fig. 3 Comparison of fitted value with experimental value
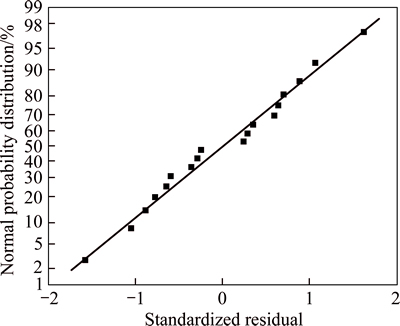
Fig. 4 Residual normal distribution
Figure 4 shows that standardized residual fitted standard normal distribution, demonstrating that the fitting result of Eq. (4) was good.
5.2.4 Analysis of leaching rate regression model
Table 7 shows the variance analysis of leaching rate regression model and coefficient significance.
It is shown in Table 7 that P value of model was less than 0.0001 and P value of lack of fit was 0.8834 (>0.05), which demonstrated that the model regression reachingthe significant level and lacking of fit was not significant, so that this experiment was reliable. The correlation coefficient of model was R2=98.3% so that the correlation was good. Corrected correlation coefficient Adj-R2=96.40% illustrated that 96.40% change of response surface could be explained by this model. The ratio of signal and noise (generally only greater than 4) measured by Adeq precision could be applied to simulation. In this work, Adeq precision equaled 26.99, which meant that this model was with enough signals to be applied to respond the design. Overall, the model could greatly explain the experimental data.
Table 7 Variance analysis of regression model and coefficient significance test
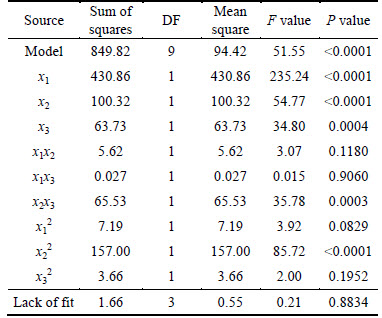
From the analysis of P value, P values of x1, x2, x3, x2x3 and x22 were all less than 0.05, which meant that these divisors impacted leaching rate significantly. There was a particularly significant interaction between surfactant and temperature.
5.3 Analysis of results
5.3.1 Impact of x1, x2 on leaching rate
As shown in Fig. 5, the leaching rate and sulfuric acid concentration were positively correlated in the experimental range. When the sulfuric acid concentration was the maximum, the leaching rate reached the highest point. When the surfactant concentration was less than 0.006 mol/L, the leaching rate got lower. When the surfactant concentration was more than 0.006 mol/L, the leaching rate got higher with the rise of temperature. When the sulfuric acid concentration was 60 g/L and the surfactant concentration was in the range of 0.008-0.01 mol/L, the leaching rate would be the maximum.
As shown in Fig. 5(b), when the surfactant concentration was less than 0.006 mol/L, the contour lines of copper leaching rate were approximately straight lines, demonstrating that the interaction of surfactant andsulfuric acid was not obvious. And the contour lines were paralleled with x axis (sulfuric acid concentration), demonstrating that the surfactant had more effect on leaching rate. Contour lines of leaching rate bent when the surfactant concentration was more than 0.006 mol/L, demonstrating that the interaction was improved. With the rise of surfactant concentration, more anions and cations were ionized in solution, and then absorbed or restrained with H+ of sulfuric acid, affecting copper leaching together.
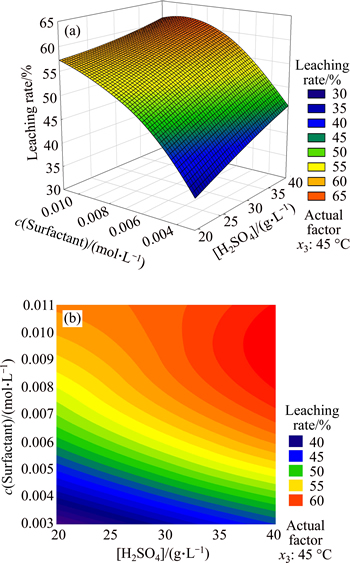
Fig. 5 Response surface (a) and contours (b) of sulfuric acid concentration and surfactant concentration
When the CMC of the surfactant (lauryl sodium sulfate) was 0.008 mol/L, the surface tension of solution was the minimum. The result showed that the surfactant concentration was 0.008-0.01 mol/L when the leaching rate was the maximum. This was because when temperature, the controlling factor, was 45 ��C, the optimal range of surfactant would increase.
5.3.2 Impact of x1, x3 on leaching rate
In Fig. 6, the leaching rate was positively correlated with sulfuric acid concentration and temperature. When these two factors were both maximum, leaching rate reached the highest point. Through the contour map, the contribution rate of sulfuric acid for leaching rate was higher than that of temperature, which could be regarded as the main factor. Because the leaching rate surface was similar to plane, the interaction between these two factors was not significant. When the sulfuric acid concentration was less than 25 g/L, leaching rate was always below 55%, no matter how the temperature changed.
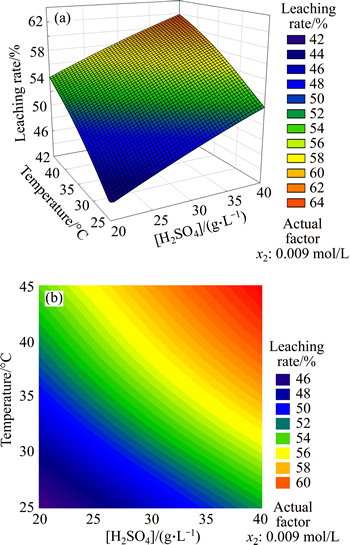
Fig. 6 Response surface (a) and contours (b) of sulfuric acid concentration and temperature
5.3.3 Impact of x2, x3on leaching rate
In Fig. 7(a), leaching rate gradually increased with the rise of temperature. When temperature was the maximum and the surfactant concentration was 0.008-0.01 mol/L, the leaching rate reached the maximum. In Fig. 7(b), contour lines of leaching rate were ellipses, which showed that the two factors affected leaching rate together and their interaction was obvious. Therefore, the interaction mainly consisted of the effect of temperature on the solubility of surfactant and CMC of surfactant.
The solubility of ionic surfactant also increased with the rise of temperature, and it would increase steeply when temperature reached a certain value which was called Krafft point, symbolized by Tk. At this point, the ionic surfactant just became micelle, and would affect the CMC value of surfactant.
Figure 8 shows the phase diagram of lauryl sodium sulfate solution versus temperature. CAB was the surfactant dissolvability curve, the part where the temperature was below Tk (left side of dotted line) was the mixed solution of monomer and hydrated crystalline solid. These hydrated crystallines were derived from superfluous surfactant at low temperature, and the surfactant would not become micelle. When the temperature was over Tk (right side of dotted line), the hydrated crystalline would exist together with the micelle. The right part of CAD curve was micelle solution phase. In this zone, the surfactant would promote the formation of micelle, while hydrated crystalline would reduce significantly or even disappear. BAD was the critical curve of micelle concentration, and the part below BAD was molecular monomer solution phase. As shown in BAD, the CMC of surfactant increased with the rise of temperature, so the conclusion that the optimal surfactant concentration was below 0.008 mol/L was reasonable.
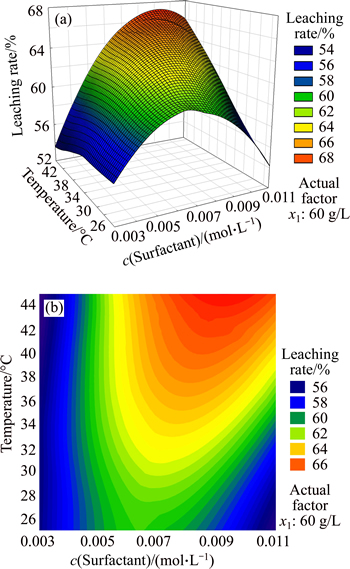
Fig. 7 Response surface (a) and contours (b) of surfactant concentration and temperature
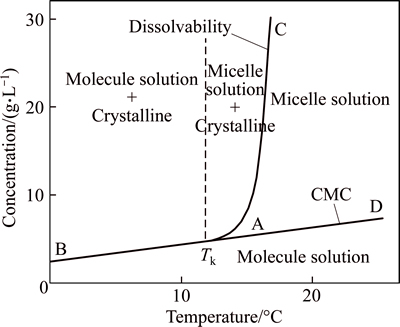
Fig. 8 Phase diagram of lauryl sodium sulfate (water system)
The reason for this phenomenon of surfactant was that water penetrating hydrophillic layer of surfactant would increase the space between bimolecular. When the temperature was below Tk, the hydrated crystalline solid would be balanced with the unimolecular surfactant saturated solution. On the contrary, at high temperature, hydraulic molecular were transformed into liquid, and separated into a certain amount of micelle solution by thermal motion. The solubility of surfactant increased, but thermodynamic quantities such as molar free energy, enthalpy, entropy and activity remained constant. Therefore, the formation of micelle could be regarded as a new phase, ��pseudo phase��, and Tk was determined by the balance dot of these three phases.
5.4 Optimization experiment
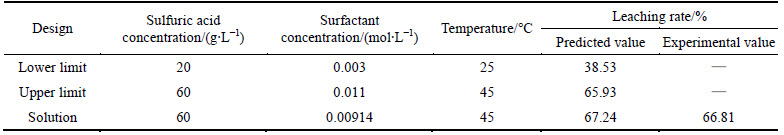
Through the limited constraints, nonlinear programming with constraints was conducted towards Eq. (4). The optimization plan and results are given in Table 8.
According to the optimization results, the best sulfuric acid concentration was 60 g/L; the best surfactant concentration was 0.00914 mol/L; the best temperature was 45 ��C; the leaching rates of copper were 66.14%, 67.08%, 67.22%, with an average of 66.81%. The results proved good agreement of experimental value with predicted value and the efficiency of the predicted model.
Table 8 Optimal parameter design of leaching rate
6 Conclusions
1) Three factors impacting leaching rate mostly were obtained by Plackett-Bruman experiment, which were sulfuric acid concentration, surfactant concentration and temperature. The center of three factors response surface experiments was gotten by the steepest ascent experiment. The sulfuric acid concentration was 40 g/L; the surfactant concentration was 0.007 mol/L; the temperature was 35 ��C.
2) Through three-factor surface response Box- Behnken design, the impacts of the sulfuric acid concentration, surfactant concentration and temperature were analyzed. When sulfuric acid concentration was 60 g/L, surfactant concentration was 0.008-0.01 mol/L and temperature was 45 ��C, the leaching rate would be the maximum.
3) After analyzing the leaching model, the optimization leaching conditions were finally summarized as follows: sulfuric acid concentration was 60 g/L; surfactant concentration was 0.00914 mol/L; table velocity was 150 r/min; temperature was 45 ��C; solid-to-liquid ratio was 6; leaching time was 72 h; the maximum particle size was 75 ��m. The leaching rate was 66.81% in the optimized leaching conditions.
References
[1] QIN W, ZHANG Y, LI W. Simulated small-scale pilot heap leaching of low-grade copper sulfide ore with selective extraction of copper [J]. Transactions of Nonferrous Metals Society of China, 2008, 18(6): 1463-1467.
[2] WU A, YIN S, QIN W, LIU J, QIU G. The effect of preferential flow on extraction and surface morphology of copper sulphides during heap leaching [J]. Hydrometallurgy, 2009, 95(1): 76-81.
[3] YIN S, WU A, WANG S, AI C. Effects of bioleaching on the mechanical and chemical properties of the waste rocks [J]. International Journal of Minerals, Metallurgy, and Materials, 2012, 13(1): 1-8.
[4] JOOS P, TOMOAIA-COTISEL A, SELLERS A J, TOMOAIA-COTISEL M. Adsorption kinetics of some carotenoids at the oil/water interface [J]. Colloids and Surfaces B: Biointerfaces, 2004, 37(3): 83-91.
[5] QIN B T, WANG D M. Characteristics and application of three-phase foam in spontaneous combustion of coal [J]. Journal of University of Science and Technology Beijing, 2007, 29(10): 971-974.
[6] WEN J, YAO G, WU M, RUAN R, CHEN J, ZOU L. Industrial heap bioleaching of arsenic-bearing low-grade copper sulfide ore [J]. Journal of University of Science and Technology Beijing, 2010, 32(4): 420-424.
[7] REYES-BOZO L, HERRERA-URBINA R, ESCUDEY M. Role of biosolids on hydrophobic properties of sulfide ores [J]. International Journal of Mineral Processing, 2011, 100(3): 124-129.
[8] LIU Y, TAN K, HU Eming, LI G, DING D. Experimental research on surfactant in leaching of hard rock type uranium ore [J]. Metal Mine, 2008(1): 32-35.
[9] WADDELL J E, SIERAKOWSKI M J, SAVU P M. Leaching of precious metal ore with fluoroaliphatic surfactant: US 5612431 [P]. 1997-03-18.
[10] DUNCAN D W, TRUSSELL P C, WALDEN C C. Leaching of chalcopyrite with Thiobacillus ferrooxidans: Effect of surfactants and shaking [J]. Applied microbiology, 1964, 12(2): 122-126.
[11] SIERAKOWSKI M J, LEE F A. Acid leaching of copper ore heap with fluoroaliphatic surfactant: US 5207996 [P]. 1993-05-04.
[12] HJELMSTAD K E. Method for particle stabilization by use of cationic polymers: US 4925247 [P]. 1990-05-15.
[13] SCHMUHL R, SMIT J T, MARSH J H. The influence of microwave pre-treatment of the leach behaviour of disseminated sulphide ore [J]. Hydrometallurgy, 2011, 108(3): 157-164.
[14] OWUSU G, DREISINGER D B, PETERS E. Effect of surfactants on zinc and iron dissolution rates during oxidative leaching of sphalerite [J]. Hydrometallurgy, 1995, 38(3): 315-324.
[15] LUTTINGER L B. Recovery of metal values from ores: US 4929274 [P]. 1990-05-29.
[16] K RBAHTI K B, RAUF M A. Application of response surface analysis to the photolytic degradation of Basic Red 2 dye [J]. Chemical Engineering Journal, 2008, 138(1): 166-171.
(Edited by YANG Bing)
Foundation item: Projects(51374035, 51304011) supported by the National Natural Science Foundation of China; Project(2012BAB08B02) supported by the National Key Technology R&D Program for the 12th Five-year Plan of China
Received date: 2015-02-27; Accepted date: 2015-04-20
Corresponding author: WU Ai-xiang, PhD, Professor; Tel: +86-10-62334680; E-mail: wuaixiang@126.com
Abstract: To solve the problem of slow leaching speed of copper, surfactant was added into lixivium as leaching agent in the experiment. Based on physical chemistry and seepage flow mechanics, the leaching mechanics of surfactant was analyzed. The solution surface tension and surfactant adsorbing on the surface of ore have a significant impact on the surface wetting effect. With leaching rate for response, the study screened out three main factors by Plackett-Burman design method: the sulfuric acid concentration, surfactant concentration and temperature. Among these three factors, the surfactant concentration is the most important contributor to leaching rate. After obtaining the experiment center by the steepest ascent experiment, a continuous variable surface model was built by response surface methodology. By solving quadratic polynomial equation, optimal conditions for leaching were finally obtained as follows: the sulfuric acid concentration was 60 g/L, the surfactant concentration was 0.00914 mol/L, and the temperature was 45 ��C. The leaching rate was 66.81% in the optimized leaching conditions, which was close to the predicted value, showing that regression result was good.
