

Effect of stress ratio on fatigue crack growth of Ti40 alloy
WU Huan(�)1, 2, ZHAO Yong-qing(������)1, ZENG Wei-dong(������)2
1. Titanium Research Center, Northwest Institute for Non-ferrous Metal Research, Xi��an 710016, China;
2. School of Materials Science and Engineering, Northwestern Polytechnical University,
Xi��an 710072, China
Received 15 July 2007; accepted 10 September 2007
Abstract:
The effect of stress ratio on fatigue crack growth (FCG) behavior of Ti40 alloy was analyzed. A unified approach, developed by VASUDEVAN and SADANANDA was used. The approach is based on the realization that fatigue requires two load parameters for unambiguous description. They are two fracture mechanics parameters: the maximum stress intensity factor Kmax and the stress intensity amplitude ��K. The results show that there are two mechanisms controlling the FCG behavior of Ti40 alloy. The curves of the two mechanisms in trajectory map are similar. They deviate to Kmax axial more strongly compared with other titanium alloy, which indicates that Ti40 alloy is more sensitive to environment.
Key words:
Ti40 alloy; stress-ratio; fatigue crack growth; unified approach; trajectory map;
1 Introduction
Ti40 alloy is a highly stabilized ��-titanium alloy possessing good burn resistance and mechanical properties. Many works on burn resistant mechanism [1-2], microstructure [3] and mechanical properties [4-5] help us to have further understanding of it. While the study of fatigue crack growth (FCG) behaviors keeps blanking. It is important to investigate it for a material designed for aircraft applications.
To analyze the variation of FCG behavior with stress ratio, two methods are commonly used. One is the crack closure concept, the other is the average stress. The latter is based on the ideas that not only the stress intensity amplitude(��K) but also the maximum stress intensity factor(Kmax) at the top of crack affect the FCG behavior of alloy. Although crack closure does exist and many experimental results can be explained by it well, many problems should not be ignored. This problem essentially relate to 1) the uncertainty in the measurements; 2) the incorrect physical concepts, and more importantly; 3) the incorrectly computed high closure values [6]. To circumvent these problems, VASUDEVAN and SADANANDA[7-10] have introduced unified approach based on the mechanical parameters ��K (stress intensity amplitude) and Kmax (stress intensity factor)[7-8]. They have pointed out that in most situations, the descriptions in terms of ��K and Kmax are necessary and sufficient for FCG without the need of crack closure. They have presented the intrinsic material response to mechanical and chemical driving forces. A fundamental threshold fatigue curve has been used, which gives two asymptotic values for ��K and Kmax, defining the two corresponding critical values in the stress intensities: ��K* and ![]() , which can describe the effect of environment on FCG behavior of alloys. In particular, the two-parametric description has far-reaching implications to the understanding of fatigue damage mechanisms and has implications to the life-prediction methodology. So in this study, the unified approach was used to analyze stress-ratio effect on FCG behavior of Ti40 alloy.
, which can describe the effect of environment on FCG behavior of alloys. In particular, the two-parametric description has far-reaching implications to the understanding of fatigue damage mechanisms and has implications to the life-prediction methodology. So in this study, the unified approach was used to analyze stress-ratio effect on FCG behavior of Ti40 alloy.
2 Experimental procedure
Ti40 alloy (Ti-25V-15Cr-xSi) used in this study was hot rolled, solution treated and aged square rod. Equiaxed ��-phase (grain size was about 200 ��m) with very small size (0.1-1.0 ��m) and small quantity and second phase are the typical structures presented in Fig.1. Standard compact tensile (CT) specimens were used in the tests (Fig.2) to select the worst stress condition I type crack as object of study. Also for high safety coefficient, crack growth direction was chosen to be the direction of the least growth resistance of the crack growth in a specimen.
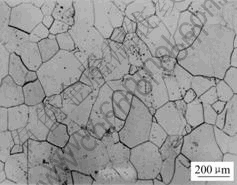
Fig.1 Optical microstructure of Ti40 alloy
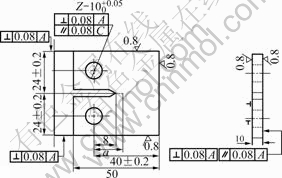
Fig.2 Geometry and dimensions of compact tensile specimen (in mm)
The tests were conducted on a computer-controlled Instron servo-hydraulic testing machine equipped with an electric resistance furnace. Experiment ambient was 500 �� and dry air. Stress ratios were 0.1, 0.5, 0.8 and 0.9. Frequency was constant at 10 Hz. The micro- structures of fracture surfaces for specimens were observed by scanning electronic microscopy.
3 Results and analyses
Data of FCG rate for Ti40 alloy at different stress ratios(R) are shown in Fig.3, which indicates an increase in the stress ratio, leading to the acceleration of FCG rate. From Fig.3, the phenomenon is significant in the incensement from 0.1 to 0.5. When R varies from 0.5 to 0.9, the increment of FGG rate becomes much smaller.
Fig.4 shows the relationship between R and ��K at FCG rates from 2��10-5 to 3��10-4 mm/cycle. Under the condition of R being less than 0.6, ��K decreases by a similar rate with increasing R at each FCG rate, while ��K decreases slowly when the FCG rate increases under the condition of high R value. These indicate that the FCG mechanism of Ti40 alloy is changed when R reaches a certain level.
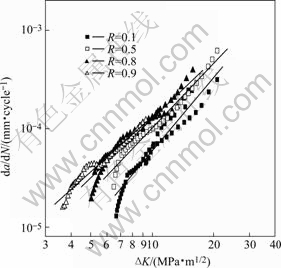
Fig.3 Effects of stress ratios on fatigue crack growth of Ti40 alloy at 500 ��
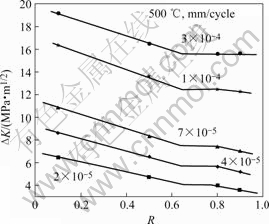
Fig.4 Relations between ��K and R for Ti40 alloy at higher R-ratios
Taking the FCG rate of 7��10-5 mm/cycle for example, according to the method proposed by VASUDEVAN and SADANANDA, extract the lines of two slop coefficients in Fig.4 to higher and lower R values respectively. The ��K and Kmax data for the two mechanisms are obtained and the resulting L-shaped curves are plotted in Fig.5. Here, there exists
Kmax=��K/(1-R) (1)
The two curves in Fig.5 indicate that there exist two mechanisms in the crack growth of Ti40 alloy. This means even FCG rate is constant, values of ��K and Kmax in crack top stress field are not the same if crack grows by different mechanisms. From the L-shaped curves, the controlling parameters ��K* and ![]() can be obtained. Extending it to other four conditions, the total ��K and Kmax L-shaped curves are obtained and shown in Fig.6.
can be obtained. Extending it to other four conditions, the total ��K and Kmax L-shaped curves are obtained and shown in Fig.6.
Extracting the data from Fig.6, the trajectory map of Ti40 alloy is obtained and shown in Fig.7. Curves of both mechanism �� and mechanism �� have similar shapes. They start far away from the ideal fatigue line and then diverges to ![]() axis because the crack extends quickly with an increase in ��K and the environmental effects. Superimposed effects of sustained load crack growth process at high Kmax come to be significant. Ti40 alloy contains large amount of vanadium, that is sensitive to the oxidation ambient. When the temperature is high, the microstructure of the material at the crack top is changed due to the oxidation reaction, which deteriorates the flow property of the material at the top of crack. Under this condition, Kmax becomes the controlling factor. The work before suffices that the divergence of the crack growth trajectory is a clear indication of the role of environment in alloy[11]. So the comparison with other titanium alloys in Fig.8 indicates a stronger effect of oxidation environment on Ti40 alloy. Facet and fragile strip mechanisms should control the crack growth of Ti40 alloy at 500 �� for long time. The patterns of the fracture surfaces at two stages after FCG tests in Fig.9 validate the above deduction.
axis because the crack extends quickly with an increase in ��K and the environmental effects. Superimposed effects of sustained load crack growth process at high Kmax come to be significant. Ti40 alloy contains large amount of vanadium, that is sensitive to the oxidation ambient. When the temperature is high, the microstructure of the material at the crack top is changed due to the oxidation reaction, which deteriorates the flow property of the material at the top of crack. Under this condition, Kmax becomes the controlling factor. The work before suffices that the divergence of the crack growth trajectory is a clear indication of the role of environment in alloy[11]. So the comparison with other titanium alloys in Fig.8 indicates a stronger effect of oxidation environment on Ti40 alloy. Facet and fragile strip mechanisms should control the crack growth of Ti40 alloy at 500 �� for long time. The patterns of the fracture surfaces at two stages after FCG tests in Fig.9 validate the above deduction.
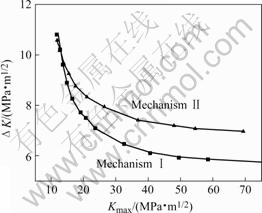
Fig.5 ��K��Kmax curves for Ti40 alloy at 500 ��
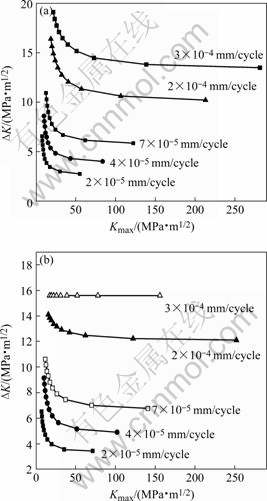
Fig.6 ��K��Kmax curves of Ti40 alloy at 500 �� and various crack growth rates: (a) Mechanism ��; (b) Mechanism ��
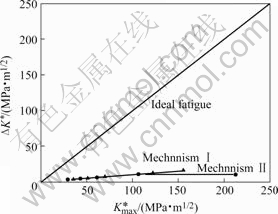
Fig.7 Crack growth trajectory map for Ti40 alloy
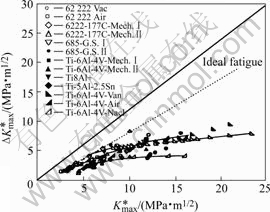
Fig.8 Crack growth trajectory map for other titanium alloys[11]
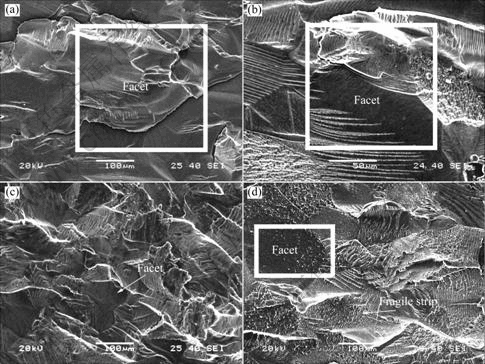
Fig.9 Fractographs of Ti40 alloy at 500 �� and different stress ratios: (a) R=0.1, ��K=7 MPa?m1/2; (b) R=0.8, ��K=7 MPa?m1/2; (c) R=0.1, ��K=17 MPa?m1/2; (d) R=0.8, ��K=17 MPa?m1/2
4 Conlcusions
1) An increase in the stress ratio leads to the acceleration of FCG rate. This phenomenon is significant with increasing R from 0.1 to 0.5 or 0.8 and 0.9, whereas the increment of FCG rate becomes much smaller when R is between 0.5 and 0.9.
2) There are two mechanisms controlling Ti40 alloy at low stress ratio and high stress ratio, respectively. The trajectory map of Ti40 alloy indicates that Ti40 alloy is more sensitive to environment compared with the other titanium alloys.
References
[1] ZHAO Yong-qing, ZHOU Lian. Burning resistant behavior and mechanism of a Ti40 alloy[J]. Rare Materials and Engineering, 1999, 28(2): 77-80.
[2] ZHAO Yong-qing, ZHOU Lian. The role of interface in the burning of titanium alloys[J]. Mater Sci Eng A, 1999, A267: 167-170.
[3] ZHAO Yong-qing, ZHU Kang-ying, QU Heng-lei, WU Huan. Microstructure of a highly stabilized beta titanium alloy[J]. Rare Materials and Engineering, 2000, 29(6): 403-407.
[4] WANG Min-min, ZHAO Yong-qing. Study on creep behavior of Ti-V-Cr burn resistant alloys[J]. Materials Letters, 2004, 58: 3248-3252.
[5] WU Huan, ZENG Wei-dong, ZHAO Yong-qing. Factors influencing properties of high stability ��-titanium alloy[J]. Heat Treatment of Metals, 2006, 31(341): 23-26.
[6] VADUDEVAN A K, SADANANDA K. Classification of fatigue crack growth behavior[J]. Metallurgical and Materials Transactions A, 1995, 26A: 1221-1233.
[7] GITTUS J. Cavities and cracks in creep and fatigue[J]. International Journal of Fatigue, 1981, 3: 109-95.
[8] SADANANDA K, VASUDEVAN A K. Analysis of fatigue cracks closure and threshold[J]. Fracture Mechanics, 1993, 25: 484-501.
[9] SADANANDA K, VASUDEVAN A K. Fatigue crack growth mechanisms in steels[J]. International Journal of Fatigue, 2003, 25: 899-914.
[10] VASUDEVAN A K, SADANANDA K, LOUAT N. A review of crack closure fatigue crack threshold and related phenomena[J]. Mater Sci Eng A, 1994, A188: 1-22.
[11] SADANANDA K, VASUDEVAN A K. Fatigue crack growth behavior of titanium alloys[J]. International Journal of Fatigue, 2005, 27: 1255-1266.
Foundation item: Project(2007CB613805) supported by the National Basic Research Program of China
Corresponding author: WU Huan; Tel: +86-29-86231078; E-mail: wuhuan27@yahoo.com.cn
(Edited by CHEN Wei-ping)
