

Effects of saccharin on microstructure and property of
electro-deposited Ni-Fe alloys
YU Jin-ku(�ڽ��), WANG Ming-zhi(������), LI Qun(�� �l), YANG Jun(�� ��), LIU Lian(�� ��)
State Key Laboratory of Metastable Materials Science and Technology, Yanshan University,
Qinhuangdao 066004, China
Received 18 June 2008; accepted 10 March 2009
Abstract:
The Ni-Fe alloy coatings were prepared by electro-deposited method, and the effects of the saccharin content in the electrolytes on the microstructure of the coatings were studied by using X-ray diffractometry(XRD), scanning electron microscopy(SEM) and transmission electron microscopy(TEM). The results show that the saccharin content in the bath affects the plating rates and the current efficiency remarkably. As the saccharin content increases, the grain size of the Ni-Fe alloys decreases. The average grain size of the deposits varies from 13 nm to 10.8 nm as the saccharin content increases from 0 g/L to 8 g/L. Accordingly, the microhardness of the as-cold deformed samples increases from Hv 600 to Hv 656.
Key words:
Ni-Fe alloys; electron microscopy; microstructure; microhardness;
1 Introduction
Crystallizers are key parts for the continuous casting equipments. Usually, the severe working condition makes the copper crystallizers worn and torn easily during processing. To replace the invalid crystallizers, the production must be stopped, and this will veritably lead to the increase of the production cost. Moreover, the wear of the copper in the working crystallizers will pollute the steel products. Therefore, many researches have been made to improve the crystallizer quality, and the widely used method is coating the copper crystallizers with Ni-Co alloys or Ni-W-Fe alloys.
A new plating material of the Ni-Fe alloys has been developed recently. With the high smelting temperature of more than 1 400 ��, the plating can endure the high working temperature and the thermo-impact caused by the liquid steel passing through the crystallizers. In addition, compared with Ni deposits, the higher hardness of the Ni-Fe alloy deposits enhances the wear-resistant property.
In order to make the Ni-Fe alloys firmly adhered to the inner surface of the copper crystallizer, the stress between the copper and the plating must be reduced. It is found that the refinement of the grain size of the plating can effectively decrease the stress[1], and this can be achieved by the addition of saccharin to the electrolytes [2-5]. However, the effects of additives on the electro- deposited Ni-Fe alloys have been rarely reported[6].
2 Experimental
The composition of the Ni-Fe electrolytes and the process parameters are listed in Table 1.
Table 1 Composition of electrolytes and process parameters
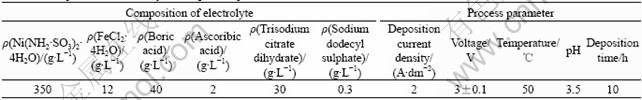
All chemicals were dissolved with distilled water. The temperature of the electrolytes was controlled by a HHS-114 water bath equipment. The pH values of the electrolytes were monitored by an acidity gauge of type PHS-25 and adjusted by either NaOH or NH2SO3H. The microhardness of the Ni-Fe deposits was tested by a microhardness gauge of type HVS-1000. The grain size of the deposits was measured using a Rigaku D/max-rB X-ray diffractometer(XRD) with Cu K�� radiation (��= 1.542 ?).
According to the XRD data, the grain size was calculated by Scherrer method:
![]() (1)
(1)
where Dc is the average grain size (nm); K is the Scherrer constant (K=0.89); �� is the X-ray wavelength; �� is the diffraction peak half-width and �� is the Bragg angle(?). The X-ray scan rate was 2 (?)/min, while the voltage was 40 kV, and the current was 40 mA. The surface morphology and the microstructure of the deposits were characterized with SEM (scanning electron microscopy of type KYKY-2800) and OM (optic microscopy of type XJG-05). EDS (energy-dispersive X-ray spectroscopy of Kevex-Sigma level 4) was used to analyze the composition. The current efficiency and the deposition rates of the electrolytes were calculated by the weighing method. The current efficiency was calculated as follows:
![]() (2)
(2)
where ��Ni and ��Fe are the current efficiencies of Ni and Fe; KNi and KFe are their electrochemical equivalents of 0.304��10-3 and 0.289��10-3 g/C, respectively; ?m is the deposits mass; w(Ni), w(Fe) are the mass percents of nickel and iron elements in the depositions, respectively; I is the current; and t is the time.
3 Results and discussion
3.1 Effects of saccharin content on morphology of Ni-Fe deposits
The surface morphologies of the Ni-Fe alloy from the electrolytes with different saccharin contents are shown in Fig.1. In Fig.1(a), one can see many pinholes on the surface of the deposits obtained from the electrolytes without saccharin. The pinholes are caused by the bubble break which once adsorbs on the surface. When the content of saccharin is increased to 2 g/L, it is seen from Fig.1(b) that the pinholes become fewer and smaller apparently, and with the further increase of saccharin content up to 8 g/L it is difficult to find any pinhole on the surface, as shown in Fig.1(c). It appears that the surface becomes smoother with increasing saccharin content in the electrolytes.
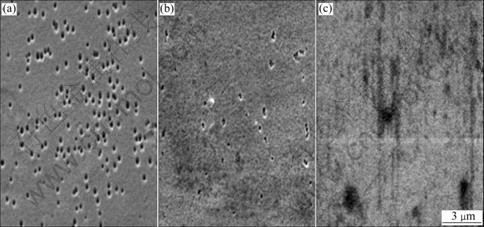
Fig.1 Surface morphologies of Ni-Fe alloy deposits depending on saccharin content in electrolytes: (a) 0 g/L; (b) 2 g/L; (c) 8 g/L
Fig. 2 presents the SEM images of the Ni-Fe alloy deposits from the electrolytes with various saccharin contents, showing a notable effect of the saccharin content on the growth of the deposits.

Fig.2 SEM images of Ni-Fe alloy plating with different contents of saccharin: (a) 0 g/L; (b) 2 g/L; (c) 8 g/L
A layer growth of the Ni-Fe alloys without any saccharin in the electrolytes is observed in Fig.2(a). This agrees well with the previously reported results[7]. With the increase of the saccharin content, the layer structure of the Ni-Fe alloys becomes weaken, as seen in Fig.2(b). When the saccharin content reaches 8 g/L, it is clear that the layer is replaced by a columnar growth, as shown in Fig.2(c). This is consistent with the reported results by FAN et al[8].
3.2 Effects of saccharin content on current efficiency and deposition rates of Ni-Fe deposits
The relationship between the content of saccharin and the current efficiency of the deposits is given in Fig.3. The results show that the current efficiency increases initially, and when the saccharin content is increased to 5 g/L, the current efficiency reaches the maximum, and then decreases.

Fig.3 Effects of saccharin content in bath on current efficiency
The similar relationship between the content of saccharin and the deposition rates of the deposits is shown in Fig.4. One can see that when the saccharin content is increased to 5 g/L, both the current efficiency and the deposition rates reach the maximum.
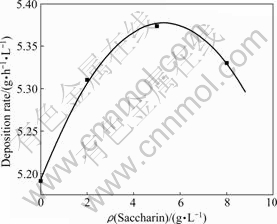
Fig.4 Effects of saccharin content in bath on deposition rates of deposits
3.3 Influence of saccharin content on phase component and composition of deposits
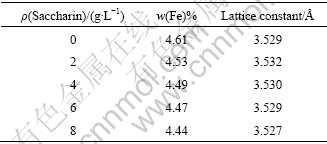
The iron contents of the deposits obtained from the electrolytes with various saccharin contents are shown in Fig.5, indicating a continuous decrease with the saccharin content. The iron content is 4.60% (mass fraction) without saccharin in the electrolytes, whereas, by contrast, the value drops down to 4.44% when the saccharin content increases up to 8 g/L. It is explained that the adsorptive capacity of saccharin on the cathodic surface increases with the saccharin content, and this prevents Fe2+ from electrodeposition and, therefore, the iron content in the deposits decreases[9].
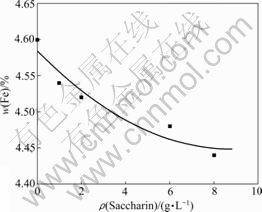
Fig.5 Relationship between saccharin content and Fe content in deposits
The further studies from XRD about the influence of the saccharin content on the lattice constant are listed in Table 2. The lattice constant of the deposits fluctuates slightly with the change of the saccharin content.
Table 2 Influence of saccharin content on lattice constant
Based on the XRD patterns of the deposits shown in Fig.6, it can be seen that the changes of the saccharin content in the Ni-Fe alloy do not affect the structure of the alloys. The deposits of the Ni-Fe alloys are mainly composed of the Ni-based ��-phase solid solution.
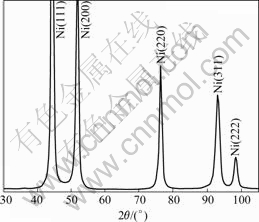
Fig.6 XRD pattern of Ni-Fe alloy deposits with saccharin content of 8 g/L
3.4 Relationship between saccharin content and grain size of deposits
The effects of the saccharin content on the grain size in Ni-Fe alloys are listed in Table 3.
Table 3 Influence of saccharin content on grain size of Fe-Ni alloys
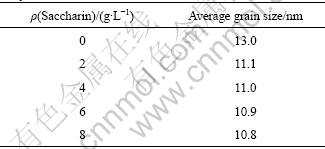
As the saccharin content increases, the grain size of the alloys decreases, changing from 13.0 nm without any saccharin in the electrolytes to 10.8 nm with the saccharin content of 8 g/L.
Some basic equations associating overpotential ��k with other relevant properties such as nucleation critical size ��i, nucleation function A, and nucleation probability W need to be referred to explain the refinement of the grain size:
![]() (3)
(3)
![]() (4)
(4)
![]() (5)
(5)
where the parameter n is the gain and loss of electrons; F is the Faraday constant (C/mol); �� is the surface tension (J/m); V is the molar volume of the crystal(cm3/mol); B is the constant and b=3.2��10-14 mV2.
Generally, the addition of saccharin to the bath increases the cathodes surface overpotential. According to Eqs.(3) and (4), the increase of the cathode overpotential results in the decrease of the critical size of the new nucleation and the nucleation function. Thus the probability of the nucleation increases rapidly and the production of more nucleus refines the grain size. On the other hand, the saccharin is absorbed on the cathodes surface of the active growth site and, this could also promote the nucleation, therefore, refines the grain size [10].
3.5 Effects of saccharin content on microhardness of deposits
The relationship curve of the saccharin content and the microhardness of the deposits is present in Fig.7. While the saccharin content increases, the microhardness of the deposits increases following the parabola law. According to Hofer and Hinterman theory, the main factors influencing microhardness are grain size, dislocation density and dislocation mobility. As shown in this experiment, the addition of saccharin can refine the grain size. In addition, the adsorption of saccharin on the cathodic surface can prevent dislocation from moving effectively, therefore, the grain boundary density will increase and the slide will be restricted. It is possible to result in the enhancement of the microhardness of the deposits.
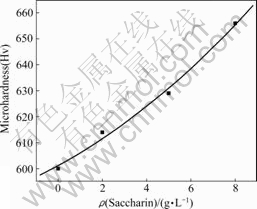
Fig.7 Relationship between saccharin content and micro- hardness of deposits
4 Conclusions
The changes of the saccharin content in the electrolytes are found to have a notable effect on the current efficiency and the deposition rates of the Ni-Fe deposits. The average grain size of the deposits varies from 13 nm to 10.8 nm as the saccharin content increases from 0 g/L to 8 g/L. The addition of saccharin with a certain content proves to refine the grain. In addition, the microhardness of the deposits is also found to increase.
References
[1] YU J K, FENG H, XING G Z, LIAO B. Analysis of affecting factors on internal stress of sulphamate Ni-Fe alloy coating [J]. Plating and Finishing, 1999, 2: 9-12. (in Chinese)
[2] BUCHHEIT T E, GOODS S H, KOTULA P G, HLAVA P F. Electrodeposited 80Ni-20Fe (Permalloy) as a structural material for high aspect ratio microfabrication [J]. Mater Sci Eng A, 2006, 432(1/2): 149-157.
[3] AFSHAR A, DOLATI A G, GHORBANI M. Electrochemical characterization of the Ni-Fe alloy electrodeposition from chloride-citrate-glycolic acid solutions [J]. Mater Chem Phy, 2002, 77(2): 352-358.
[4] LI H Q, EBRAHIMI F. Tensile behavior of a nanocrystalline Ni-Fe alloy [J]. Acta Mater, 2006, 54(10): 2877-2886.
[5] LI H Q, EBRAHIMI F. Synthesis and characterization of electrodeposited nanocrystalline nickel-iron alloys [J]. Mater Sci Eng A, 2003, 347(1/2): 93-101.
[6] EBRAHIMI F, LI H Q. Grain growth in electrodeposited nanocrystalline fcc Ni-Fe alloys [J]. Scrip Mater, 2006, 55(3): 263-266.
[7] ?GNES C, IMRE G, ENIK? T K, IMRE B. TEM and XRD study of the microstructure of nanocrystalline Ni and Cu prepared by severe plastic deformation and electrodeposition [J]. Nanostructured Mater, 1995, 6(5/8): 547-550.
[8] FAN G J, FU L F, CHOO H, LIAW P K, BROWNING N D. Uniaxial tensile plastic deformation and grain growth of bulk nanocrystalline alloys [J]. Acta Mater, 2006, 54(18): 4781-4792.
[9] KIM S H, SOHN H J, JOO Y C. Effect of saccharin addition on the microstructure of electrodeposited Fe-36wt.% Ni alloy [J]. Surf Coating Technol, 2005, 199(1): 43-48.
[10] JING T F, QIAO G Y, XIONG Y, SHAO G J, YU S X, ZHANG C J, HOU D Z. Effects of additives on the Ni nanocrystalline of JED electro-deposited [J]. Mater Prot, 2001, 7: 16-17. (in Chinese)
Foundation item: Project(599270) supported by Hebei Provincial Foundation, China
Corresponding author: YU Jin-ku; Tel:+86-335-8074792; E-mail: yujinku@ysu.edu.cn
DOI: 10.1016/S1003-6326(08)60354-4
