
J. Cent. South Univ. (2012) 19: 721-726
DOI: 10.1007/s11771-012-1063-9![]()
Near ground air temperature calculation model based on
heat transfer of vertical turbulent and horizontal air flow
ZHANG Lei(����), MENG Qing-lin(������)
School of Architecture, South China University of Technology, Guangzhou 510640, China
? Central South University Press and Springer-Verlag Berlin Heidelberg 2012
Abstract:
In order to calculate the air temperature of the near surface layer in urban environment, the surface layer air was divided into several sections in the vertical direction, and some energy balance equations were developed for each air layer, in which the heat exchange due to vertical turbulence and horizontal air flow was taken into account. Then, the vertical temperature distribution of the surface layer air was obtained through the coupled calculation using the energy balance equations of underlying surfaces and building walls. Moreover, the measured air temperatures in a small area (with a horizontal scale of less than 500 m) and a large area (with a horizontal scale of more than 1 000 m) in Guangzhou in summer were used to validate the proposed model. The calculated results accord well with the measured ones, with a maximum relative error of 4.18%. It is thus concluded that the proposed model is a high-accuracy method to theoretically analyze the urban heat island and the thermal environment.
Key words:
1 Introduction
The surface layer is a system of the atmospheric boundary layer close to the ground with the thickness being 1/10 of the whole atmospheric boundary layer. Generally, it is considered that the thickness of surface layer is several hundred meters. The human being lives within the surface layer mainly, so it keeps a close relationship with human being��s life. At present, the issue of surface layer over special underlying surface such as surface layer of urban areas and different vegetations as well as the mutual relationship between it and underlaying surface is still under research [1].
The surface layer law research is mainly focused on the atmospheric science field, where the issue concerned mainly is the influence of meteorological parameter of surface layer on meteorological parameters of the atmospheric boundary layer over it or those of even higher layer such as the atmospheric troposphere [1-2]. As for the research on urban thermal environment, meteorological parameters of air temperature, humidity and velocity of areas suitable for human activities over the earth surface are more important, where the height is about 1.5-2 m, but the air condition change within the height range for human activities shall be considered, which, in addition to bearing a close relation with the thermal environment of underlying surface, is correlated with the upper air condition. It is proved that the surface layer is in the height range of the urban heat island in vertical direction and therefore it can be considered as the upper boundary condition for the single dimension vertical thermal equilibrium model.
The air temperature calculation model mentioned in this work combines the theory of the atmospheric science field with the urban plan and building design concepts, providing a simple, reliable and fast method for thermal environment assessment in urban areas for planners and building designers.
2 Surface thermal equilibrium equation
If the solar radiation absorptivity of surface layer air is considered as zero and the phase transition of vapor is not considered, the change process of the air temperature for surface layer shall be: the temperature of all surfaces under the solar radiation area rises, while the heat will be transferred to the air layer through sensible thermal transfer, making the air temperature change. So, when the air temperature of surface layer is calculated, the surface temperature of underlying surface shall be calculated firstly.
The thermal equilibrium of any surface i in the area can be expressed as Eq. (1), where these surfaces include roof, external wall and ground:
![]() (1)
(1)
where S is short wave radiation, L is long wave radiation, ��D�� and ��U�� are for downward and upward radiation, Qc is convection heat exchange between air and surface, Qd is conduction heat transfer of solid material, and Qe is evaporation heat transfer.
The calculation methods of all parameters in Eq. (1) can be found in Refs. [3-8]. As for the calculation method of water surface temperature, please refer to Ref. [9]. Temperatures of all underlying surfaces and building walls can be reached through Eq. (1).
3 Thermal equilibrium of surface layer air
The air temperature of surface layer within urban areas results from the thermal transfer between surface layer air and underlying surface as well as the thermal transfer within the surface layer. If the temperature variation influenced by the air on solar radiation as well as the absorbed and released heat through phase transition of vapor are ignored, then the thermal transfers of air and external environment are as follows.
1) Sensible thermal transfer between underlying surface and surface layer;
2) Energy brought and taken away through air inflow and outflow;
3) Sensible thermal transfer between external building wall and ambient air;
4) Anthropogenic Heat.
The thermal transfer within the surface layer includes mainly the thermal transfer caused by air molecular diffusion and turbulence. The schematic diagram of thermal equilibrium of surface layer air is shown in Fig. 1.
In the urban surface layer shown in Fig. 1, take out a thin layer along with the contour, then the thermal equilibriums considered are as follows.
1) Horizontal air flow
If the mass flow in the area within unit time is Vmi, the heat brought is CaVmiTin and if the mass flow in the area is Vmo, the heat taken away is CaVmoT. The internal heat change in the thin layer caused by horizontal air flow within unit time can be obtained from
![]() (2)
(2)
where Ca is air specific heat, Tin is incoming air temperature, and T is mean air temperature of the thin layer.
2) Internal thermal source
The internal thermal source in the thin layer is divided into two parts: Part 1 is the sensible thermal transfer between other surface (wall surface) and air of the thin layer; Part 2 is the man-made heat dissipating capacity of other surface in the thin layer.
![]() (3)
(3)
where Hc,i is the convection heat exchange between air and surface i, Ai is the area of surface i, Ts,i is the external surface temperature of surface i, and Qa,i is the anthropogenic heat of unit area.
3) Diffusion
The heat from surface z to the thin layer within
unit time due to diffusion is ![]()
The heat from surface z+��z to the thin layer is
![]() The heat change caused within unit time due to diffusion can be obtained from
The heat change caused within unit time due to diffusion can be obtained from
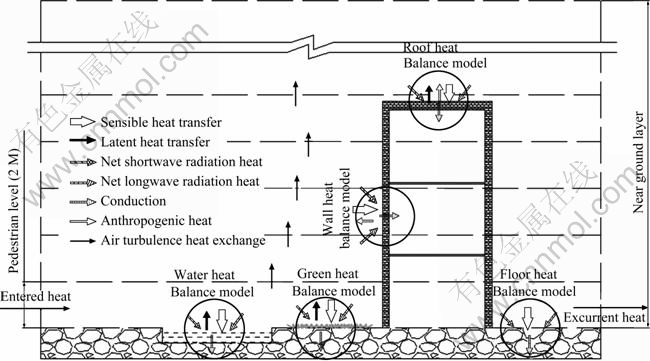
Fig. 1 Near ground air heat balance model
![]() (4)
(4)
where D is air molecular thermal diffusion coefficient, Kt is air turbulence thermal diffusion coefficient, A is horizontal area excluding building area, and dz is thickness of thin layer.
The internal heat change of the above thin layer that will cause the air temperature change in the thin layer can be obtained from
![]() (5)
(5)
Equation (6) can be obtained from the thermal equilibrium in the thin layer:
![]() (6)
(6)
Put the above expressions of Q1-Q4 into Eq. (6), Eq. (7) can be obtained after arrangement:
![]()
![]() (7)
(7)
where Ma,j is the weight of air in the thin layer, and Qv is the inner heat source.
Equation (7) is the control equation of the air temperature model of surface layer. After the discreteness of this equation, if the initial condition and boundary condition are given, all air temperatures can be obtained through forward elimination and backward substitution.
4 Calculation of heat exchange coefficient of turbulence
According to the first order closure scheme (K theory), the air turbulent motion is similar to the air molecular motion. And the turbulence thermal transmission is similar to molecular thermal transmission. So, the thermal flux caused by turbulence can be expressed as
![]() (8)
(8)
When the aerosphere section is unstable and the turbulence transmission is much faster than molecular transmission, Kt>> D, and at this time, the thermal transmission in the air H=Hd+Ht��Ht, unit mass temperature change caused by thermal transmission in the air can be expressed as
![]() (9)
(9)
That is to say, the turbulence thermal diffusivity is subjected to typical heat conduction equation, where Kt value changes in accordance with the change of air condition.
The turbulence thermal diffusivity is not the fixed air physical property parameter but a changeable parameter at any time, so it can only be obtained through iterative computation based on area roughness, air temperature, air velocity and stableness. Kt can be expressed as [10-15]
![]() (10)
(10)
where �� is Karman constant, u* is friction velocity, z is vertical height, and f2 is profile function of air temperature.
5 Model verification and result
In order to verify the accuracy of the above theoretical model and calculation method, the measurement results for the small sized area (Donghu area of the South China University of Technology) and large sized area (Guangzhou University Town) in Guangzhou, China, are adopted.
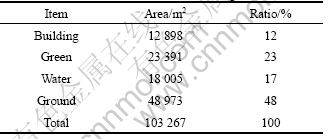
The air temperature of Donghu area of the South China University of Technology was measured from July 9th to 13th, 2007, where the planned area information is given in Table 1.
Table 1 Planned land use information of Donghu area
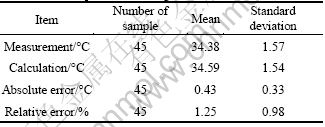
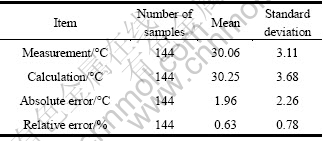
The meteorological data recorded in weather station during the measurement were adopted as the incoming flow parameter. And the average air temperature within the human activities height (2 m) obtained from the calculation model for surface layer air temperature mentioned in this work was adopted and compared with the measured result of Donghu area, as shown in Fig. 2 and Table 2.
From Fig. 2 and Table 2, the change trends of calculated values and measured values are similar to each other. The maximum relative error is 4.18%, which occurred at 13:00 on July 12th. The average relative error is 1.25%, and the time with relative errors being less than 3% accounts for 93.3% of those for measurement, from which it can be concluded that the accuracy of average temperature obtained through this model for human activities height is high.
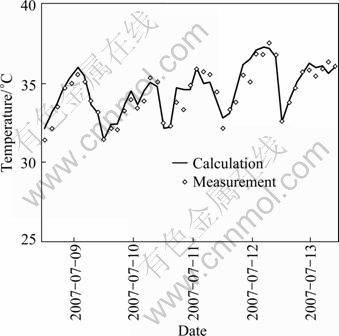
Fig. 2 Comparison between calculated values and measured values of air temperature at Donghu area
Table 2 Statistics analysis of calculated values and measured values of air temperature at Donghu area
The error between measured air temperature and calculated value is caused probably by the following points:
1) Some simplified and assumed treatments of model caused the error, for instance, other surfaces were probably under insulation boundary conditions in addition to the heat exchange along with the air flow, which would reduce the heat exchange between the calculated area and other areas in parallel with the air flow.
2) The complicated geometrical relation of outdoor environment caused the error. Some simplified treatments were performed for the model when the angle factor and shadow factor were calculated, causing the main heat source of the area, and deviation occurred during calculation of solar radiation.
3) During this calculation, influence of man-made heat was not considered, which was one of the reasons for causing errors.
The air temperature vertical distribution for Donghu area at four typical hours on July 13th is shown in Fig. 3.
From Fig. 3, the temperature of surface layer is under a temperature inversion condition at 1:00 am, where the air temperature at the bottom is 30.54 ��C, while that of the top is 30.61��C. And at 6:00 during sunrise and 18:00 during sunset, the temperature gradient is low, which is isothermal. At 12:00 at noon, the temperature of the bottom is 35.66 ��C, while that of the top is 34.62��C, showing that the temperature of surface layer is unstable. In addition, during the calculation for the temperature of surface layer for Donghu area, the calculated surface layer height is 300 m, showing that at 12:00 at noon, the influence of the thermal environment of underlying surface on the temperature of surface layer can reach up to about 300 m. When this height is exceeded, the surface layer height calculated is added, the influence on the air 2 m away from the ground will be less than 0.1 ��C. The thickness of surface layer will change along with the change of stability. When it is unstable, it can reach up to 100 m or even higher; when it is stable, it can be only 10 m or 20 m. The analysis result of this work is similar to the above description, showing that the calculation model mentioned is reasonable for the description of the air temperature of surface layer.
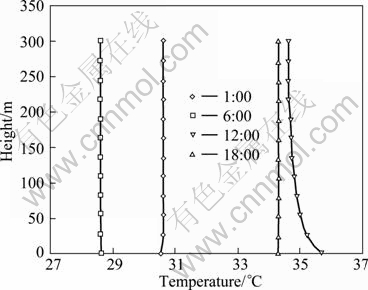
Fig. 3 Vertical air temperature distribution of East Lake
The comparison between the air temperatures of Guangzhou University City measured from August 28th-30th, 2007 and those calculated from the model is conducted. The planned area information of Guangzhou University City is given in Table 3, and the comparison result is shown in Fig. 4 and Table 4.
Table 3 Planned land use information of Guangzhou University Town

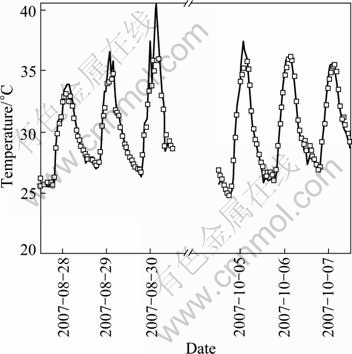
Fig. 4 Comparison results of between calculated value and measured value
Table 4 Statistics of calculated value and measured value
During the two comparing periods, the average relative error is 1.96%, where the hours with relative error being less than 5% account for 93.7% of the whole period; the hours under day time solar radiation with higher temperature is 10:00-15:00; the hours with relative error being less than 1% account for 41% which are almost under night. This can indicate further that the underlying surface is the main heat resource for surface layer air. During day time, when the influence of solar radiation on underlying surface temperature is high, the calculation for underlying surface temperature is determined by the calculation for air temperature.
The temperature variation at vertical direction of Guangzhou University Town area at four typical hours on August 29th was made too, as shown in Fig. 5. It is shown that the temperature variation trend at the height direction of Guangzhou University Town area at four typical hours is similar to that of Donghu area, where the difference is that, due to the large size of the university area, the influence of underlying surface on the air temperature of surface layer rises, at noon of August 29th, and the maximum influenced height can reach up to 850 m.
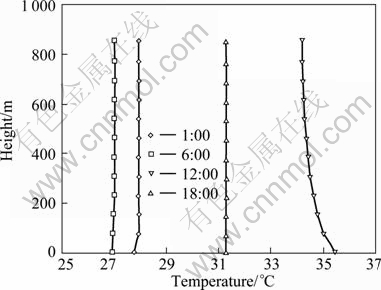
Fig. 5 Vertical air temperature distribution of Guangzhou University Town
6 Conclusions
1) The surface layer of urban area in the vertical direction is divided into several sub-layers, and energy balance equations for all air sub-layers are established, where the heat exchange of turbulence in the vertical direction and that of incoming air in the horizontal direction are considered. From the combined calculation of ground and building wall surface equations, the air temperature of surface layer is distributed vertically.
2) From the comparison between the measured air temperature of small sized Donghu area and average air temperature calculated through this model within 2 m from the ground, the error from both area is low, the maximum relative error is 4.18% and the average relative error is 1.25%.
3) From the comparison between the results measured on August 28th-30th and October 5th-7th, 2007 for Guangzhou University Town, the average relative error for the measured value and calculated value is 1.96%, and hours with relative error being less than 5% account for 93.7% of the whole period.
4) The calculation model for air temperature of surface layer can meet the accuracy requirement of thermal environment research basically. It can be used for the calculation for air temperature of surface layer of urban area and is suitable for the simplified formula for wet bulb globe temperature (WBGT) as well as predicting thermal environment quality after performance of urban plan and building design plan.
Acknowledgements
The authors are grateful to Associate Professor WANG Bao-min from the College of Environmental Sciences and Engineering of Sun Yat-Sen University for providing relative materials on dynamics of atmospheric boundary layer as well as Director HUANG Jiang and YANG Wu-lin from Guangzhou Meteorological Satellite Ground Station for providing the meteorological data of Donghu area of the South China University of Technology and Guangzhou University City area.
References
[1] Zhao Ming. Dynamics of atmospheric boundary layer [M]. Beijing: Higher Education Press, 2006: 1-2, 26-27. (in Chinese)
[2] SORBJAN Z, ULIASZ M. Some numerical urban boundary-layer studies [J]. Boundary-Layer Meteorology, 1982, 22(4): 481-502.
[3] Mills G. An urban canopy-layer climate model [J]. Theoretical and Applied Climatology, 1997, 57(3/4): 229-244.
[4] Kondo H, Genchi Y, Kikegawa Y, Ohashi Y, Yoshikado H, Komiyama H. Development of a multi-layer urban canopy model for the analysis of energy consumption in a big city: Structure of the urban canopy model and its basic performance [J]. Boundary-Layer Meteorology, 2005, 116(9): 395-421.
[5] Kusaka H, Kondo H, Kikegawa Y, Kimura F. A simple single-layer urban canopy model for atmospheric models: Comparison with multi-layer and slab models [J]. Boundary-Layer Meteorology, 2001, 101(12): 329-358.
[6] Ran Mao-yu, Yang Ruo-han, Meng Qing-lin. Prediction model and calculation method of the boundary surface temperature of out door space under solar radiation [J]. Acta Energiae Solaris Sinica, 2006, 27(7): 719-724. (in Chinese)
[7] Meng Qing-lin, Chen Qi-gao, Ran Mao-yu, LI Jian-cheng, CAI Ning. Derivation of the vaporising heat transfer coefficient he [J]. Acta Energiae Solaris Sinica, 1999, 20(2): 216-219. (in Chinese)
[8] Xiao Yong-quan, Wang Fei. Building envelope��s dynamic heat balance model under solar radiation and example analysis [J]. Acta Energiae Solaris Sinica, 2006, 27(3): 270-273. (in Chinese)
[9] Zhang Lei, Meng Qing-lin, Shu Li-fan. Analysis on dynamic thermal balance model of landscape water and its numerical simulation [J]. Building Science, 2007, 23(10): 58-61. (in Chinese)
[10] Harman I N, Finnigan J J. A simple unified theory for flow in the canopy and roughness sublayer [J]. Boundary-Layer Meteorol, 2007, 123(5): 339-363.
[11] Tanimoto Jun, Hagishima A, Chimklai P. An approach for coupled simulation of building thermal effects and urban climatology [J]. Energy and Buildings, 2004, 36: 781-793.
[12] Lee S H, Park S U. A vegetated urban canopy model for meteorological and environmental modelling [J]. Boundary-Layer Meteorol, 2008, 126(1): 73-102.
[13] Zhang Qiang, L? Shi-hua. The determination of roughness length over city surface [J]. Plateau Meteorology, 2003, 22(1): 24-32. (in Chinese)
[14] Hamlyn D, Hilderman T, Britter R. A simple network approach to modeling dispersion among large groups of obstacles [J]. Atmospheric Environment, 2007, 41(28): 5848-5862.
[15] Gao Zhi-qiu, Bian Lin-gen, Lu Chang-gui, Lu Long-hua, Wang Jin-xing, Wang Ying. Estimation of aerodynamic parameters in urban areas [J]. Quarterly Journal of Applied Meteorlolgy, 2002, 13(1): 26-33. (in Chinese)
(Edited by YANG Bing)
Foundation item: Project(50808083) supported by the National Natural Science Foundation of China
Received date: 2011-07-26; Accepted date: 2011-11-14
Corresponding author: ZHANG Lei, PhD; Tel: +86-13642691580; E-mail: arzhang@scut.edu.cn
Abstract: In order to calculate the air temperature of the near surface layer in urban environment, the surface layer air was divided into several sections in the vertical direction, and some energy balance equations were developed for each air layer, in which the heat exchange due to vertical turbulence and horizontal air flow was taken into account. Then, the vertical temperature distribution of the surface layer air was obtained through the coupled calculation using the energy balance equations of underlying surfaces and building walls. Moreover, the measured air temperatures in a small area (with a horizontal scale of less than 500 m) and a large area (with a horizontal scale of more than 1 000 m) in Guangzhou in summer were used to validate the proposed model. The calculated results accord well with the measured ones, with a maximum relative error of 4.18%. It is thus concluded that the proposed model is a high-accuracy method to theoretically analyze the urban heat island and the thermal environment.
