
Trans. Nonferrous Met. Soc. China 30(2020) 2980-2993
Solid-solid phase transition of tungsten induced by high pressure: A molecular dynamics simulation
Xiao-zhen DENG1*, Lin LANG2*, Yun-fei MO3, Ke-jun DONG4, Ze-an TIAN1, Wang-yu HU5
1. College of Computer Science and Electronic Engineering, Hunan University, Changsha 410082, China;
2. College of Physics and Electronics, Hunan Institute of Science and Technology, Yueyang 414000, China;
3. School of Electronic Information and Electrical Engineering, Changsha University, Changsha 410022, China;
4. Centre for Infrastructure Engineering, School of Engineering, University of Western Sydney, Penrith NSW 2751, Australia;
5. College of Materials Science and Engineering, Hunan University, Changsha 410082, China
Received 6 February 2020; accepted 11 August 2020
Abstract:
The phase transition of tungsten (W) under high pressures was investigated with molecular dynamics simulation. The structure was characterized in terms of the pair distribution function and the largest standard cluster analysis (LSCA). It is found that under 40-100 GPa at a cooling rate of 0.1 K/ps a pure W melt first crystallizes into the body-centred cubic (BCC) crystal, and then transfers into the hexagonal close-packed (HCP) crystal through a series of BCC-HCP coexisting states. The dynamic factors may induce intermediate stages during the liquid-solid transition and the criss-cross grain boundaries cause lots of indistinguishable intermediate states, making the first-order BCC-HCP transition appear to be continuous. Furthermore, LSCA is shown to be a parameter-free method that can effectively analyze both ordered and disordered structures. Therefore, LSCA can detect more details about the evolution of the structure in such structure transition processes with rich intermediate structures.
Key words:
molecular dynamics (MD) simulation; rapid solidification; solid-solid phase transition; largest standard cluster analysis; topologically close-packed cluster;
1 Introduction
An important goal of condensed matter science is to design and prepare materials with excellent properties. Pressure or cooling rate may have a profound effect on chemical and physical reactivity (such as electronic structure and atom size) and their different combinations could result in new phases or states [1]. For example, under the high pressures different crystals have been found for Ba [2], Na [3], Ca [4] and Mg [5]; and the irreversible evolution of superconductivity in PdBi2 can be induced by pressure [6]. The diamond anvil cell (DAC) is a unique device that produces ultra-high static pressure; and the maximum compressive strength of diamond limits the highest achievable pressure. Due to the huge pressure enhancement, the maximum compressive strength of the DAC is theoretically predicted to be 900 GPa in an early study [7]. Three decades ago, it was reported that the static high pressure determined by ruby pressure calibration scale was 0.55 TPa [8]. Recently, in the carefully prepared DAC for observing solid metal hydrogen, the static high pressure is also as high as 495 GPa [9]. To date, the more generally accepted pressure range obtained in DAC is 350-400 GPa [10].
With high hardness and density, tungsten (W) is usually used under dynamic pressure, such as hard materials, kinetic energy penetrators, cannon shells and missiles to create supersonic shrapnel. W is recently believed to be a promising candidate for plasma-facing materials for future fusion reactors and is planned to be used for diverter armour of the international thermonuclear experimental reactor (ITER) [11], where the W surface could be melted repeatedly under high thermal stress. Thus, it is of great significance to investigate the property of W under high pressure and temperature. It is reported that the relative electrical resistance of W decreases with increase of pressure from 0 to 30.8 GPa [12]. For pure W sintered body, high-pressure torsional deformation improves the room temperature fracture strength by 2-3 times [13].
However, the mechanism for the changes of these properties associated with high pressure has not been fully understood, due to the difficulty in obtaining the structural details of the disordered systems in the experiment, such as liquids, super-cooled liquids and amorphous solids. Computer simulation is an effective tool [14-16] to overcome this difficulty. Molecular dynamics (MD) [17-19] and first-principles simulations [20-23] are both effective methods for high-pressure research. Comparing with the first-principles calculations, MD simulation can be applied to a large number of atoms enough for studying phase transitions between ordered and disordered systems. However, limited by the capability of current computers, solid melting or melt solidification is usually investigated under extremely high heating or cooling rates. With the development of cooling technology and computational science, the cooling rate gap between simulation and experiment is gradually decreased. In fact, for example, the A15 phase of Zr has been found at high pressure (>60 GPa) by classic MD simulations [18].
In order to investigate the effect of pressure on structure evolution during rapid solidification and to search possible high-pressure phases of W, rapid solidifications of liquid metal W under the pressure of 40-100 GPa have been conducted with MD simulation. The structures of the simulated systems were characterized by the pair distribution function and the largest standard cluster analysis (LSCA) [24-26], and the results revealed that the ambient-condition stable BCC (body-centred cubic) phase of W becomes a high-temperature metastable phase under high pressure during rapid cooling at 0.1 K/ps, and finally transforms into a hexagonal close-packed (HCP) phase. The liquid-BCC transformation may experience intermediate stages, similar to some alloys [27,28]. While the first-order BCC-HCP transformation looks like a continuous process because there are lots of intermediate states. In addition, as a parameter-free structural analysis method for both ordered and disordered systems, LSCA can probe more structural details by calculating new indexes, such as the mean cut-off distance.
2 Methods
2.1 Computational methods
The MD simulation of the rapid solidification of liquid W was conducted using a large atomic and molecular parallel simulator (LAMMPS) software package [29]. The W-W interaction potential used here was proposed by WANG et al [30], and the calculation formulas are as follows:
 (1)
(1)
where the embedding energy F(��) is given by
 (2)
(2)
And
 (3)
(3)
The pairwise potential function and electronic density function are respectively represented by a series of polynomial functions:
 +Bnr+Cnr2+Dnr3+Enr4+Fnr5+Gnr6+Hnr7)��(rn-r)��(r-rn+1), r1<>n+1 (4)
and
 +B��nr+C��nr2+D��nr3+E��nr4+F��nr5+G��nr6+H��nr7)��(r��n-r)��(r-r��n+1), r��1<>n+1 (5)
where ��(x) is a Heaviside step function, defined as ��(x)=1 for x 20 and ��(x)=0 for x <0.
The effect of pressure was not specifically considered in the development of this potential function [30]; therefore, before it was used to simulate the rapid cooling of melts under high pressures, we verified the applicability of this force field under different pressures by the pressure- specific volume (p-V/V0) curve (see Fig. 1). Our calculation revealed that at 0 K, the calculated p-V/V0 curves are in good agreement with the experimental and DFT calculated data. Furthermore, at p<30 GPa the calculation based on the BCC crystal is slightly better than that based on the HCP crystal; while at p>30 GPa the result based on the HCP crystal is much better than that based on the BCC crystal. This change is consistent with our simulation: at 40-100 GPa the final state is HCP rather than BCC that is stable at ambient conditions. Thus, this potential has sufficient accuracy under the high pressure.
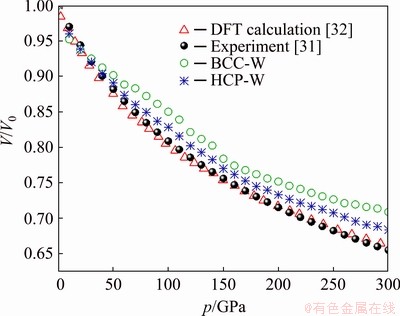
Fig. 1 Pressure dependence of specific volume of pure W at 2.5 K, compared with experiment at 293 K [31] and DFT calculation at 0 K [32] (V0 is zero-pressure volume)
The simulation was subjected to the three- dimensional periodic boundary conditions and a constant time step of 1 fs. After randomly generating the positions and velocities of 16000 atoms in a cubic box, the equilibrium liquid was firstly obtained by relaxing the system for 2��106 time steps (2 ns) at 6000 K (well above the melting point of this potential, Tm=(4100��50) K [30]). The system was then quenched to 300 K at a cooling rate of 0.1 K/ps. The quenching simulation was performed at the pressures of 40, 60 and 100 GPa with NPT ensemble [33]. The Nose-Hoover thermostat method [34,35] for controlling temperature and the Parrinello-Rahman algorithm [36] for pressure were adopted in the simulation. The atom velocity, position and other necessary information were recorded every Kelvin for further analysis.
2.2 Structural analysis methods
For MD simulation, characterization methods are necessary to identify local structures in ordered or disordered systems. In the past, many methods have been proposed to quantify local structures, most of which require a pre-set cut-off distance (rc) to determine neighbourhood between atoms, such as the Honeycutt-Andersen pair (HA-pair), the common neighbours analysis (CNA) [37], the bond orientation order (BOO) [38], the Voronoi tessellation [39], the atomic cluster alignment [40], the core-shell geometric analysis [41,42] and the SPRPG(a topological technique combining the Shortest-Path ring and planar graph) [43,44]. However, in a heterogeneous system rc depends on individual environments; and then a certain rc cannot accurately identify all local structures, especially during phase transitions [45,46] where various structures coexist and change remarkably.
The difficulties caused by a fixed rc have been recently overcome in the largest standard cluster analysis (LSCA) by introducing a topological criterion [24-26]. In LSCA, a pair of atoms are bonded if their distance is less than rc, and the local structure is composed of a central atom and all neighbours are called a cluster. An example is shown in Fig. 2(a), where the atom 9800 is the centre and other 14 atoms are neighbours. A part of such cluster is called a common neighbour sub-cluster (CNS) that comprises of a reference pair (RP, composed of the centre and one neighbour) and their common near neighbours (CNNs). In Figs. 2(b) and (c), the RPs are respectively the atom pair 9800-8914 and 9800-2788; and the atoms in Figs. 2(d) and (e) are the corresponding CNNs. The topology of a CNS can be systematically described by a CNS-index Sijk, where ��S�� is just a prefix (the first letter of ��sub-cluster��), i is the number of CNNs, j is the number of all bonds between CNNs, and k is the number of bonds in the longest CNN string formed by part or all of the j bonds.
Therefore, the CNS in Fig. 2(b) is indexed as S444 and that in Fig. 2(c) is S666. In the cluster shown in Fig. 2(a) there are six S444 and eight S666, so the cluster is denoted as [6/444, 8/666]. The cluster shown in Fig. 2(a) is a standard cluster (SC), because the topology of each CNS in this cluster can be uniquely characterized by a CNS-index. With the increase of rc, the number of neighbours around a certain atom increases and the bond between neighbours becomes complex rapidly; when rc exceeds a certain critical value, there will be too many bonds between neighbours, resulting in the failure of the topological uniqueness denoted by the CNS-index (such as S566).
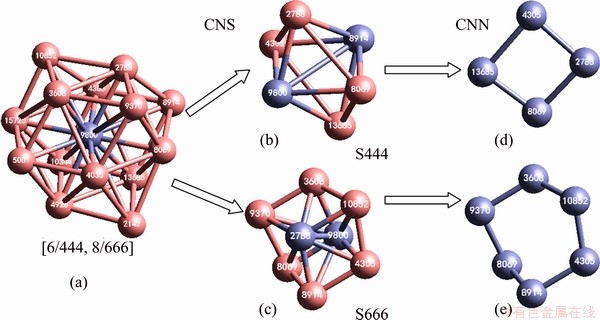
Fig. 2 Topology of BCC LSC [6/444, 8/666] cantered at atom 9800 (a) and its two CNSs of S666 (b) and S444 (c), as well as their topologies (d) and (e), respectively
In practice, a pre-set initial rs is large enough to invalidate at least one CNS-index in a cluster. In this case, the longest bond in the cluster will be removed and the previously bonded atom will be removed from the cluster. Then rs decreases also. If all CNS-indexes in a cluster are valid, the critical rs (assigned as rc) is obtained and the resulting cluster is the largest standard cluster (LSC) [24]; otherwise, the longest bond in the remaining cluster will be removed again to check the validity of all CNS-indexes, till the rc is obtained. Obviously, rc varies and is determined by the individual local environment of atoms. But for each atom, the validity of CNS-indexes in the LSC around it can be guaranteed. Therefore, all atoms in a system can be classified according to LSC type based on a closed set of CNS-indexes. For example, the atom 9800 shown in Fig. 2(a) is identified as a [6/444, 8/666] atom, while on the other hand it can also be linked to BCC as such a cluster is the building block of the BCC crystal [24].
In supercooled metallic liquids, the primary CNSs are usually S421, S422, S433, S444, S544, S555 and S666 [18,25,26], among which S433 and S544 can be considered as the deformed S444, S555 and S666. S555 has good rotational symmetry, which is one of the densest 3D structural units [47] and the building block of icosahedron (ICO [12/555]) and other polyhedrons. S421, S422, S444 and S666 all have both transitional and rotational symmetries, therefore they can form a variety of crystal structures, such as HCP [6/421, 6/422], FCC [12/421] and BCC [6/444, 8/666] LSCs. Composed of ten S421 and two S555, the truncated decahedron (tDH), identified as [10/421, 2/555], usually acts as the five-fold twinned crystalline boundary [48,49].
Together with other Frank-Kasper clusters [49], ICO structures can form complex topologically close-packed (TCP) crystals, such as ��-Ta [45] and A15 Zr [48,50]. Recently, we proposed the TCP LSC (or cluster) that consists of S444 (��n4), S555 (��n5) and S666 (��n6), where n5��1 [45]. Based on the Euler theorem (V+F-E=2, where V, F and E are respectively the number of vertexes, faces and edges of a polyhedron.), it is easy to prove that a TCP LSC satisfies the equation of 2n4+n5=12, and n6 is free, just confined by the total coordination number (CN) of the centre atom. Thus, we have n4��5 (due to n5��1). Therefore, each TCP LSC can be simply, clearly and uniquely denoted by a TCP-index that is composed of a letter followed by an integer, standing as ��Ln��, where the letter ��L�� is Z if n4=0, or A-E if n4=1-5, respectively, and the integer n is the CN of the central atom. For example, the TCP LSC of [1/444, 10/555, 2/666] is labelled as A13, because there is only one S444 (n4=1), and there are 13 neighbours in total.
All TCP LSCs are close-packed, because they only include tetrahedral interstitials. The ICO and Frank-Kasper clusters are TCP LSCs, while [6/444, 8/666] are not. Our study revealed that the TCP LSCs are ubiquitous in metal melts and metallic glasses [45,48], and the evolution of TCP cluster is crucial for phase transition: during liquid-solid transition if the number of TCP clusters rapidly changes, the resulting solid will be crystals, otherwise glasses.
3 Results and discussion
Figure 3 shows the average potential energy dependence of temperature (E-T curve) at the three pressures (40, 60 and 100 GPa) examined here. First, consistent with basic thermodynamics theory, the higher the pressure is, the higher the system energy is. Second, before the temperature decreases to 4000 K, the liquid-solid phase transition occurs in all three cooling processes. They are typical first-order phase transitions and may contain intermediate states. Third, the onset temperatures of the liquid-solid transition (Ts) under 40, 60, and 100 GPa are 4418, 5245 and 5018 K, respectively. Therefore, the pressure has a nonlinear relationship with Ts, which is consistent with the fact that the nucleation is a statistic process, and the transition temperature varies significantly in different runs of such brute-force MD simulations. The melting point under pressure should be higher than Ts because in MD simulation nucleation can only occur in the supercooled regime. All these Ts are higher than 4100 K, the melting point of this potential under ambient conditions; thus, pressure increases the melting point of metal W. In addition, the end temperatures (Te) of the liquid-solid transition under 40, 60 and 100 GPa are 4410, 5090 and 4815 K, respectively. Fourth, at T<>e, the slope of the E-T curve is constant over a rather wide temperature range, and the accelerated decrease in potential energy in the low-temperature section should indicate another phase transition.
The most interesting observation is the shape of the E-T curves at the low-temperature end, where the system potential energy accelerates down as the temperature decreases. What happened during this stage? To answer this question, the rest of this work will focus on the structural evolution during rapid cooling under 100 GPa, because it includes a distinct intermediate state that may provide more information about phase transition. In fact, our analysis revealed that as shown by the E-T curves, structural evolution is similar at the low-temperature end under different pressures.
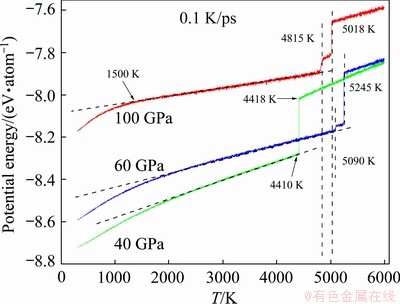
Fig. 3 Evolution of average potential energy per atom during cooling process of liquid W at 0.1 K/s under 40, 60 and 100 GPa
3.1 Liquid-solid phase transition
As shown in Fig. 3, the slope of E-T curve under 100 GPa has two drop-offs at 5018 and 4816 K respectively and a smooth change at T<1500 K. Therefore, there may be at least two first-order phase transitions and one continuous phase transition. The pair distribution function (PDF or g(r)) for the sample at 5012 K (see Fig. 4) is very similar to that at 5019 K for the supercooled liquid, indicating the order degree of the system at 5012 K is rather low even if crystallization has started. The typical characteristics of the crystal become distinct at 3800 K, where in addition to the primary peak there are many small peaks.
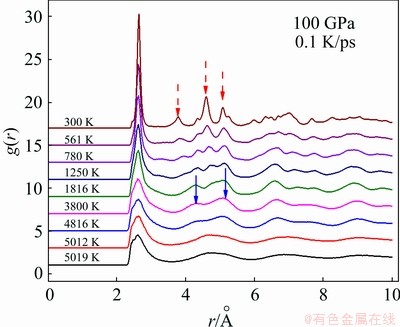
Fig. 4 g(r) curves at several temperatures during cooling process of liquid W
With the further decrease of temperature, the peaks become sharper and narrower; thus, the degree of order is increasing. However, both the shape and the position of the peaks of the g(r) curve at 300 K are much different from those at 3800 K (highlighted by arrows in Fig. 4(b)), thus the W crystal at 300 K is different from that at 3800 K.
In order to quantify the key structural characteristics of the system in the vicinity of the first phase transition, we studied the 8 LSCs that have the highest number in each sample of the system. From 1501 samples (one every degree from 5500 to 4000 K), there were 27 LSCs which consisted of only 7 CNSs, as listed in Table 1. As shown in the compact denotation in the rightmost column of Table 1, there are 3 crystal LSCs and 9 TCP LSCs, and the others are slightly deformed TCP LSCs. Therefore, the topological close-packed structure is the essential characteristic of metals whether in liquids and supercooled liquids. For more details about this denotation, please refer to the text and supplementary of Refs. [45,48].
According to the evolution pattern of the number of LSCs, the 27 LSCs are divided into 4 groups: 7 FCC-, 5 BCC-, 3 HCP-, and 12 TCP- types (see Table 1), and their amount as a function of temperature is plotted in Fig. 5. One can find that from 5400 to 4000 K there are two critical temperatures (5018 and 4815 K) and four evolution patterns.
Table 1 Structural details of 27 LSCs
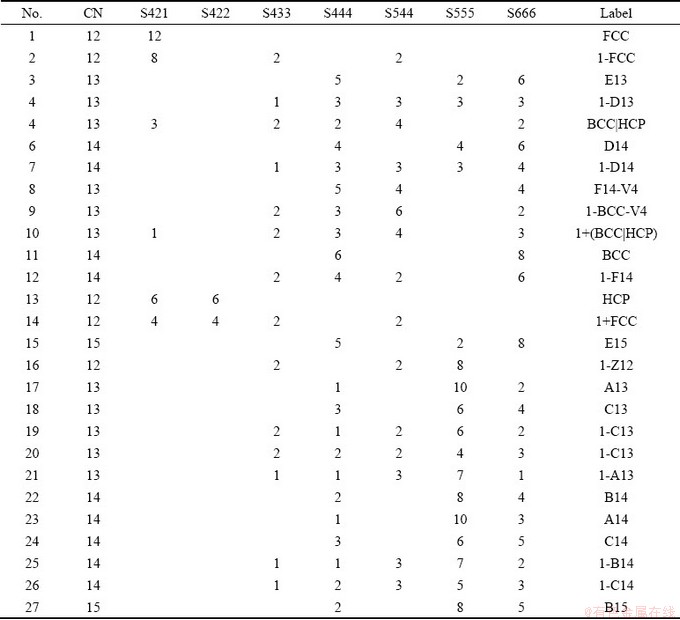
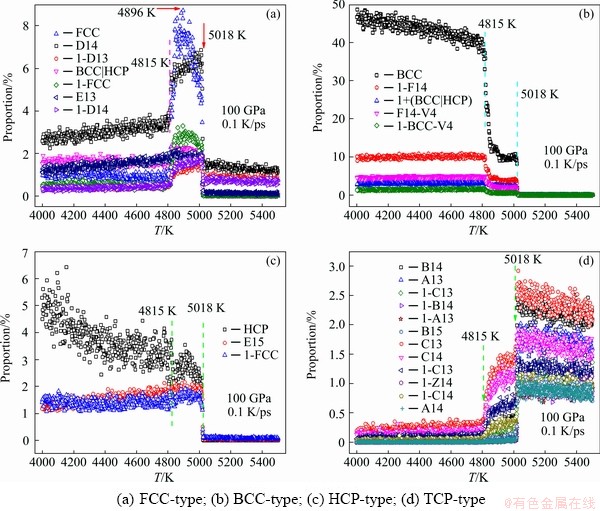
Fig. 5 Temperature dependence of number percentage of 27 LSCs in vicinity of liquid-solid transition
(1) The number of FCC-type LSC increased rapidly at about 5018 K, then kept unchanged for about 200 K (5018 to 4815 K), and finally decreased to a rather low level (Fig. 5(a)). The number of FCC atoms increased linearly from 5108 to 4896 K, accounting for about 8% of all the atoms in the system, and then decreased remarkably to about 4% at 4815 K.
(2) The number of BCC-type LSC increased rapidly at two critical points and then increased linearly (see Fig. 5(b)). As a stable structure under ambient conditions, BCC atoms only increased to about 10% from 5018 to 4815 K and then levelled off for about 200 K. By 4815 K the percentage of BCC atoms burst up to about 40%.
(3) At 5018 K the HCP LSC rapidly increased to about 3%, then slowly increased; while other two HCP-type LSCs increased to about 2%, then slowly decreased (Fig. 5(c)).
(4) The TCP-type LSC experienced two sudden drops at 5018 and 4815 K respectively. It decreased to almost zero at 4815 K, and then slowly decreased (Fig. 5(d)).
In brief, in the range of 4815-5018 K, the number of FCC-type atoms reached the maximum and then decreased; the HCP-type atoms continued to grow slowly; the evolution of the number of BCC-type atoms was opposite to that of TCP-type ones: the BCC-type atoms experienced two jump-ups, while the TCP-type atoms had two drop-offs. At 4000 K < T < 4815 K, BCC atoms dominated the system, and this liquid-solid phase transition can be called BCC-crystallization.
Phase transition is a dynamic process under certain thermodynamic conditions, such as temperature, pressure and energy. Generally, thermodynamic conditions determine whether liquid-solid crystallization occurs, and dynamic factors determine the location, time and manner of nucleation. The classical nucleation theory argues that the formation of crystal nucleus must overcome a certain energy barrier that is jointly affected by the volume-free energy and interface-free energy. In rapid cooling the system could be non-equilibrium, and the local environments of different atoms could be rather different, so various crystallizations with similar energy barriers may occur simultaneously. Crystal nuclei may disintegrate under thermodynamic fluctuations. In general, unless the nucleation rates of various crystals are very different, with lower potential energy, there will be more nuclei and the nuclei will also be more stable.
In the present simulation, under 100 GPa when temperature decreases to 5018 K, BCC, FCC and HCP nuclei appear in the system almost at the same time, which is consistent with the fact that they have almost equal potential energy (less than that of the system, see Fig. 6(a)). When the temperature is between 4850 and 5018 K, the potential of FCC and BCC atoms is basically equal, but the percentage of BCC atoms is 10% which is a bit higher than that of FCC (8%), as shown in Figs. 5(a) and (b). This may be linked with the potential fluctuation: the smaller the potential fluctuation, the more stable the structure. With the maximal potential fluctuation, the number of HCP nuclei is the smallest (~3%, see Fig. 5(c)). When the temperature decreases further, another smaller energy decrease of the system occurs between 4850 and 4815 K. Around 4815 K the potential energy of FCC atoms is sometimes more than the system, and correspondingly the number of FCC atoms decreases (Fig. 5(a)); while the BCC atoms increase rapidly (Fig. 5(b)), due to the fact that the potential energy of BCC atoms is distinct less than the system, and fluctuates slightly.
The position and distribution of the nucleus are usually determined by dynamic factors, such as the fluctuation in structure and energy, the atomic velocity and distribution. Visualization is the most direct and effective way to present such effects with a series of snapshots. As shown in Fig. 7, at the initial stage of BCC crystallization at 5012 K, BCC, FCC and HCP atoms were evenly distributed in the system, and many small crystal regions with rough edges were formed (see Figs. 7(a)-(c)). Between 5012 and 4896 K, there was almost no change in the number and distribution of HCP and BCC atoms (Fig. 7(b) vs Fig. 7 (e) and Fig. 7(c) vs Fig. 7(f)); while between 4896 and 4700 K, the amount of BCC atoms increased rapidly. The number of FCC atoms reached the maximum at 4896 K (see Figs. 7(a), (d) and (g)). Figures 7(g)-(i) show that at 4700 K BCC atoms dominated the system, and the nuclei composed of HCP atoms were heterogeneous (Fig. 7(h)).
3.2 Solid-solid phase transition
As shown in Fig. 8(a), at 2100 K < T < 4815 K the number of BCC, FCC and HCP atoms increased monotonically, where the number of BCC atoms was much higher than those of the other two kinds of atoms. At 2100 K the amount of BCC atoms reaches a maximum of 60%, and those of HCP and FCC atoms are 3% and 10%, respectively. Obviously from 4815 to 2100 K BCC atoms dominated, and the system should be basically a BCC crystal. When T<2100 K the evolution of the number of FCC, HCP and BCC atoms changed remarkably. BCC atoms decreased rapidly; oppositely HCP and FCC atoms increased exponentially. Finally, at 300 K, the percentages of HCP, FCC and BCC atoms are respectively about 60%, 12% and 12%. Therefore, the final solid should be mainly an HCP crystal. In fact, under 40 and 60 GPa, the evolution of the numbers of HCP, BCC and FCC atoms is similar. As the temperature decreased, the number of BCC atoms decreased, and that of HCP atoms increased. The higher the pressure, the more the HCP and FCC atoms (see Figs. 8(d) and (e)).
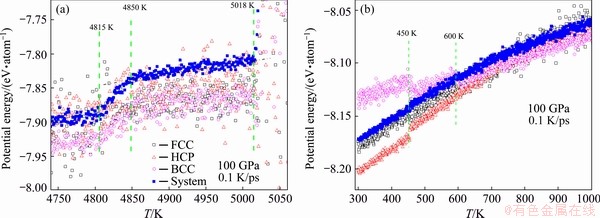
Fig. 6 Energy evolution of FCC, HCP and BCC atoms, compared with system energy from 5050 to 4750 K (a) and from 1000 to 300 K (b)
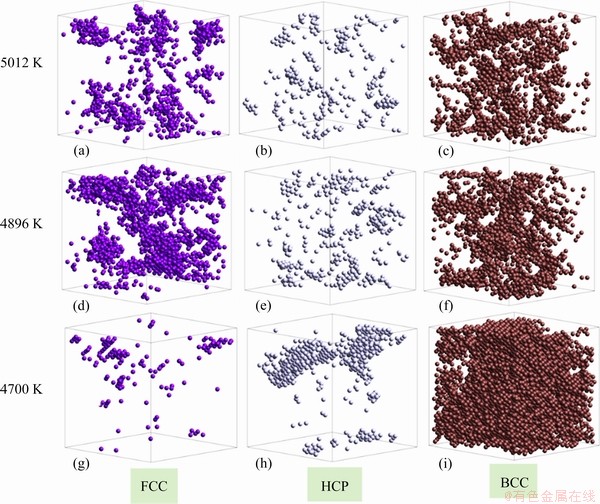
Fig. 7 Distribution of FCC, HCP and BCC atoms at the first stage of BCC-crystallization at 5012 K (a-c), 4896 K (d-f) and 4700 K (g-i)
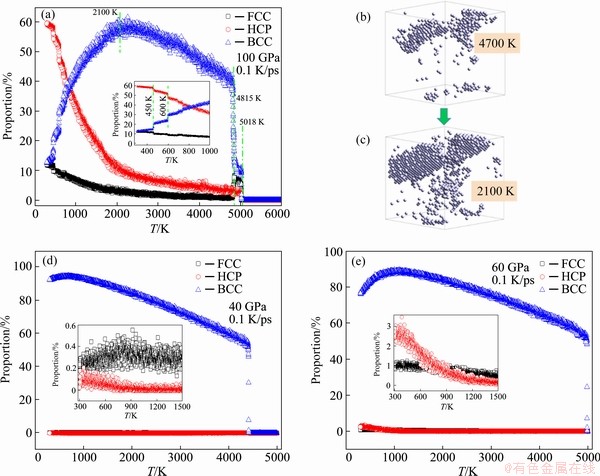
Fig. 8 Evolution of number percentage of BCC, FCC and HCP atoms during rapid cooling of liquid W under 100 GPa (a), 40 GPa (d) and 60 GPa (e) at cooling rate of 0.1 K/ps, and spacious distribution of HCP atoms at 4700 K (b) and 2100 K (c)
Under ambient conditions, the stable phase of W is a BCC crystal when T<3695 K. In our present simulation the amount of BCC atoms reached up to 60% at 2100 K. But is it stable under high pressure? For simple metals that have two stable phases at high and low temperatures respectively, our previous work revealed that the stable phase at high temperature is very difficult to capture to room temperature [6]. For example, pure ��-Zr will transform to ��-Zr (the stable phase at low temperature) rapidly when the temperature is less than T�� ~1136 K, even if the cooling rate is as high as 1014 K/s that can vitrify almost all pure metals.
In order to quantify the stability of the BCC phase at high temperature, the sample was relaxed for 2000 ps at 3000 K (HCP and FCC atoms are about 7.4% and 2.0%, respectively), and the evolution of the number of three crystal atoms over time is shown in Fig. 9. One can find that at the beginning of this isothermal relaxation, the number of BCC atoms increased instantly, while that of FCC and HCP atoms decreased. Then their amount becomes very stable: BCC atoms are about 60%, and FCC and HCP atoms are less than 0.1% (see the inset of Fig. 9).
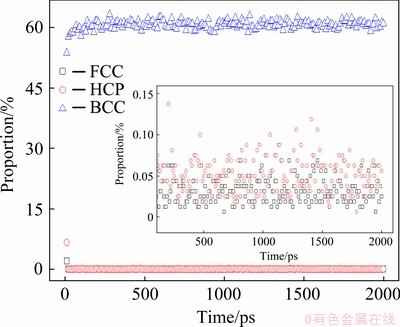
Fig. 9 Number percentage of FCC, HCP and BCC atoms as function of time in system during 2000 ps isothermal relaxation at 3000 K
Therefore, this BCC state of W should be a stable phase around 3000 K under 100 GPa, and the equilibrium transforming temperature from BCC to HCP phase should be higher than 2100 K that is the onset temperature of such transition under rapid cooling. Therefore, BCC crystal is the stable phase of W at high temperature under 100 GPa, and there exists a BCC��HCP solid-solid transition beginning at around 2100 K at a cooling rate of 0.1 K/ps. Previous work has discussed the link between the distribution of new phase and the transition pathway upon a solid-solid phase transition under high pressures [18], and pointed out that near the end of the parent solid phase, if the new-phase atoms are randomly distributed, or the boundaries of the new-phase clusters are irregular, a single-intermediate-state crystallization (SisC) will happen; otherwise, it will be a multiple- intermediate-state crystallization (MisC). In the present work, the new phase was HCP crystal. HCP atoms aggregated together to form two crystal regions at 4700 K (see Fig. 7(h) and Fig. 8(b)). They gradually grew up and became more regular as shown in Fig. 8(c). Therefore, this BCC-HCP transition should be a MisC that undergoes a series of first-order phase transitions, which is shown in the inset of Fig. 8(a). Such a process includes a series of indistinguishable intermediate states, making it appear to be continuous (see Fig. 8(a)).
Certainly, a significant change in potential energy is accompanied by a remarkable change in the number of primary crystalline atoms. Figure 6(b) shows that at 600 K the average potential energy of BCC atoms becomes higher than that of the system, and another increase occurs at 540 K. Oppositely, the average potential energy of HCP atoms had a distinct decrease at 540 K. Therefore, the number of BCC atoms dropped off at 600 and 540 K, and correspondingly that of HCP atoms jumped up at the two temperatures (see Fig. 8(a) and the inset). These two discontinuous changes in the number of crystal atoms unveil that the BCC-HCP solid-solid transition is still a first-order phase transition.
What role does the FCC atom play in this solid-solid phase transition? It is found that the number of FCC atoms increased slowly (Fig. 8(a)), and most of them lay on several planes, as can be found in Figs. 10(b), (f) and (j)). These FCC planes are the boundaries of HCP grains (Figs. 10(a), (e) and (i)). They are criss-cross in space. Therefore, it is difficult for these FCC atoms to be converted into HCP atoms by layer slip, because layers perpendicular to each other will hinder layer slip.
3.3 TCP structure and cut-off distance
It is believed that amorphous metals are frozen liquids, so the primary structural characteristics of supercooled metal liquids should be closely related to metallic glass. Recently, we proposed that the TCP structure is the essential structural characteristic of metallic glass. After the liquid- solid transition begins, if the number of TCP structures decreases rapidly, the liquid will solidify into a simple crystal; otherwise a complex TCP crystal or amorphous solid will be obtained. Does this mechanism still apply under high pressure?
Figure 11 shows the evolution of the number percentage of TCP atoms in the simulated system during rapid cooling. The number of TCP atoms gained the maximum percentage of 19% at 5075 K, which is 57 K higher than Ts of the liquid-solid transition. Thus, there is a strong competition between the vitrification and crystallization from 5075 to 5018 K. At 5018 K when the number of TCP atoms begins to avalanche, BCC crystallization begins.
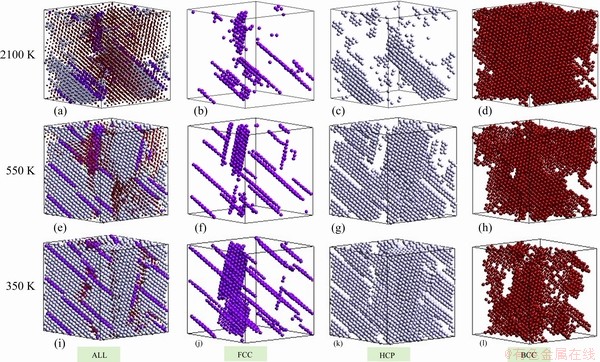
Fig. 10 Distribution of FCC, HCP and BCC atoms at three temperatures during solid-solid phase transition
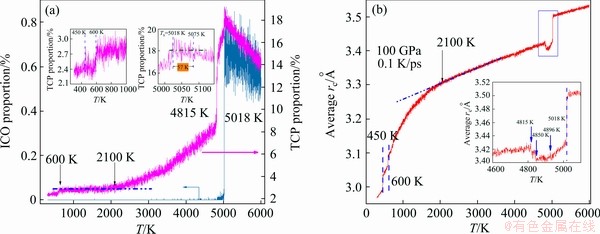
Fig. 11 Evolution of number percentage of ICO and TCP atoms (a) and average cut-off distance rc (b) as function of temperature during rapid cooling
The TCP atoms are usually located at the boundaries of crystal grains, and a remarkable structural change during crystallization will cause a distinct change in the type and amount of TCP structures. Therefore, as shown in Fig. 11(a) and the insets, at the critical points of 4815, 2100, 600 and 450 K, the decreasing rate of TCP atoms changed distinctly. Therefore, the evolution of the amount of TCP atoms can not only reflect the competition between disordered and ordered structures at the beginning of crystallization, but also show more details during the crystallization process. In a word, TCP atoms are a good indicator of phase transition. On the contrary, ICO atoms cannot play this role. As shown in Fig. 11(a) the number of ICO atoms also reached the maximum at 5028 K, but it was less than 1% of all atoms in the system, and even dropped to zero immediately after crystallization began. Therefore, the structural evolutions at T< 5018 K cannot be detected from the perspective of ICO atoms.
One of the advantages of LSCA is that the local structure around atoms can be determined without setting the cut-off distance rc in advance. In addition, LSCA can provide a statistical parameter (the average of rc,) over all atoms. Figure 11(b) shows that the average rc changed remarkably at all critical temperatures (including 5018, 4815, 2100, 600 and 450 K) during rapid cooling. It is worth pointing out that more details about phase transition can be detected by the average rc. For example, as shown in the inset of Fig. 11(b) when the FCC atoms reached the maximum number at 4896 K (see Fig. 5(a)), the average rc decreased to the minimum; at 4850 K, when the system potential energy decreased faster (see Fig. 7(a)), the average rc increased again; and at 4815 K, when the system potential energy slowly decreased again, the evolution of average rc also reversed.
At around 5018 K, the average rc suddenly decreased because the average distance between neighbouring atoms decreased remarkably when the crystal structure was rapidly formed in the liquid. However, why is there a deep valley between 4815 and 5018 K? If the atom is regarded as hard spheres, the FCC and HCP structures will occupy the smallest volume, followed by BCC and amorphous ones. Therefore, when the FCC/HCP atom number reaches the maximum, the average rc reaches the minimum. When some FCC/HCP atoms are converted to BCC atoms, the average rc increases accordingly [23]. Therefore, the average rc is also a good indicator to quantify the local structure evolution during vitrification and crystallization.
4 Conclusions
(1) Several solidifications of pure W liquid metal at 40-100 GPa and a rapid cooling rate of 0.1 K/ps have been simulated with LAMMPS. The analysis of local structures reveals that it is a crystallization with the pathway of the super-cooled liquid (SCL) through the BCC phase to the HCP crystal.
(2) The BCC phase, which is stable under ambient conditions, becomes a high-temperature metastable phase under high pressure, and finally transforms into an HCP crystal. Due to the dynamic factor, the SCL��BCC transition may include intermediate stages, and the first-order BCC��HCP transition includes many intermediate stages.
(3) The evolution of the number of TCP structures and the average rc exported by LSCA can provide more details about phase transitions, such as the competition between crystalline and amorphous structures before the start of crystallization, the abrupt change of the distance between the neighbouring atoms during the phase transition.
(4) These findings provide a clear physical picture at the atomic level of the crystallization pathway of W under rapid cooling and high pressures. It can improve the fundamental understanding of phase transition of pure W as well as other related metals and alloys, especially for those having different stable phases at high temperature and low temperature, respectively.
Acknowledgments
The authors also thank the National Supercomputer Center in Changsha for the computational resource.
References
[1] YANG Yang, WANG Jun-liang, CHEN Ya-dong, Hu Hai-bo. Effect of strain rate on microstructural evolution and thermal stability of 1050 commercial pure aluminum [J]. Transactions of Nonferrous Metals Society of China, 2018, 28(1): 1-8.
[2] KENICHI T. High-pressure structural study of barium to 90 GPa [J]. Physical Review B, 2019, 50(22): 16238-16246.
[3] MA Yan-ming, OGANOV A R, XIE Yu, TROJAN I, MEDVEDEV S, LYAKHOV A O, VALLE M, PRAKAPENK A V. Transparent dense sodium [J]. Nature, 2009, 458(7235): 182-185.
[4] OGANOV A R, MA Yan-ming, XU Ying, ERREA I, BERGARA A, LYAKHOV A O. Exotic behavior and crystal structures of calcium under pressure [J]. Proceedings of the National Academy of Sciences of the United States of America, 2010, 107(17): 7646-7651.
[5] OLIJNYK H, HOLZAPFEL W B. High-pressure structural phase transition in Mg [J]. Physical Review B, 1985, 31(7): 4682-4683.
[6] LI Pei-fang, GAO Guo-ying, WANG Yan-chao, MA Yan-ming. Crystal structures and exotic behavior of magnesium under pressure [J]. Journal of Physical Chemistry C, 2010, 114(49): 21745-21749.
[7] LIN Chong, WU Shu-sen, LU Shu-lin, WU He-bao, CHEN Han-xin. Influence of high pressure and manganese addition on Fe-rich phases and mechanical properties of hypereutectic Al-Si alloy with rheo-squeeze casting [J]. Transactions of Nonferrous Metals Society of China, 2019, 29(2): 253-262.
[8] XU Jiang-ao, MAO Ho-kwang, BELL P M. High-pressure ruby and diamond fluorescence: Observations at 0.21 to 0.55 Tera-pascal [J]. Science, 1986, 232(4756): 1404-1406.
[9] DIAS R P, SILVERA I F. Observation of the Wigner- Huntington transition to metallic hydrogen [J]. Science, 2017, 358(6361): 715-718.
[10] LIU Xiao-di, DALLADAY-SIMPSON P, HOWIE R T, LI Bing, GREGORYANZ E. Comment on observation of the Wigner-Huntington transition to metallic hydrogen [J]. Science, 2017, 357(6353): 2286-2287.
[11] FALESCHINI M, KREUZER H, KIENER D, PIPPAN R. Fracture toughness investigations of tungsten alloy and SPD tungsten alloys [J]. Journal of Nuclear Materials, 2007, 367: 800-805.
[12] PU Feng-nian, BI Xiao-qun, DING Yu-zhen, GOU Qing-quan. Relative electrical resistance of tungsten under high pressure [J]. Chinese Journal of High Pressure Physics, 1991, 5: 288-290.
[13] ZHANG Yue, GANEEV A V, GAO X, SHARAFUTDINOV A V, WANG Jing-tao, ALEXANDROV I V. Influence of HPT deformation temperature on microstructures and thermal stability of ultrafine-grained tungsten [J]. Materials Science Forum, 2008, 584-586: 1000-1005.
[14] HE Ye-zang, LI Hui, JIANG Yan-yan, LI Xiong-ying, BIAN Xiu-fang. Liquid-liquid phase transition and structure inheritance in carbon films [J]. Scientific Reports, 2014, 4: 3635-3640.
[15] WU Wei-kang, ZHANG Lei-ning, LIU Si-du, REN Hong-ru, ZHOU Xu-yan, LI Hui. Liquid-liquid phase transition in nanocon-fined silicon carbide [J]. Journal of the American Chemical Society, 2016, 138(8): 2815-2822.
[16] CELIK F A. Cooling rate dependence of the icosahedral order of amorphous CuNi alloy: A molecular dynamics simulation [J]. Vacuum, 2013, 97: 30-35.
[17] GAUTAM S, LIU Ting-ting, COLE D. Structure and dynamics of CO2 and ethane in silicalite at high pressure: A combined Monte Carlo and molecular dynamics simulation study [J]. Molecules, 2019, 24(1): 99-112.
[18] ZHANG Hai-tao, MO Yun-fei, TIAN Ze-an, LIU Rang-su, ZHOU Li-li, HOU Zhao-yang. The effect of pressure upon crystallization of rapidly supercooled zirconium melts [J]. Physical Chemistry Chemical Physics, 2017, 19: 12310-12320.
[19] CELIK F A, KAZANC S. The local order and structural evolution of amorphous PdAg alloy during isothermal annealing under high pressure: A molecular dynamics study [J]. Canadian Journal of Physics, 2015, 93(1): 7-13.
[20] WANG Si-han, LI Hai-jun, SUN Xiu-ping, XU Ying. Novel structure of AgInS2 compound under high pressure: First principles calculations [J]. Solid State Communications, 2018, 284: 20-24.
[21] ZHANG Chun-yi, ZHANG Cui, CHEN Mo-han, KANG Wei, GU Zhou-wei, ZHAO Jian-heng, LIU Cang-li, SUN Cheng-wei, ZHANG Ping. Finite-temperature infrared and Raman spectra of high-pressure hydrogen from first-principles molecular dynamics [J]. Physical Review B, 2018, 98(14): 144301.
[22] KISHORE N, NAGARAJAN V, CHANDIRAMOULI R. First-principles studies on mechanical properties and band structures of TMO2 (TM=Zr or Hf) nanostructures under high pressure [J]. Physica B: Condensed Matter, 2019, 559: 1-7.
[23] GIRARD A, STEKIEL M, MORGENROTH W, TANIGUCHI H, MILMAN V, BOSAK A, WINKLER B. High-pressure compressibility and electronic properties of bismuth silicate Bi2SiO5 from synchrotron experiments and first-principles calculations [J]. Physical Review B, 2019, 99(6): 064116.
[24] TIAN Ze-an, LIU Rang-Sui, DONG Ke-jun, YU Ai-bing. A new method for analysing the local structures of disordered systems [J]. Europhys Lett, 2011, 96(3): 36001-36006.
[25] TIAN Ze-an, DONG Ke-jun, YU Ai-bing. Structural evolution in the packing of uniform spheres [J]. Physical Review E, 2014, 89(3): 032202.
[26] TIAN Ze-an, DONG Ke-jun, YU Ai-bing. Structure evolution in the crystallization of rapid cooling silver melt [J]. Annals of Physics, 2015, 354: 499-510.
[27] WANG Jun-song, TIAN Bing, TONG Yun-Xiang, CHEN Feng, LI Li. Effect of thermal treatment and ball milling on microstructure and phase transformation of Ni-Mn-Nb alloys [J]. Transactions of Nonferrous Metals Society of China, 2019, 29(10): 2117-2127.
[28] GAO Shuang, HOU Jie-shan, GUO Yang-an, ZHOU Lan-zhang. Phase precipitation behavior and tensile properties of as-cast Ni-based superalloy during heart treatment [J]. Transactions of Nonferrous Metals Society of China, 2018, 28(9): 1735-1744.
[29] PLIMPTON S. Fast parallel algorithms for short-range molecular dynamics [J]. Journal of Computational Physics, 1995, 117(1): 1-19.
[30] WANG Jun, ZHOU Yu-lu, LI Min, HOU Qing. A modified W-W interatomic potential based on ab initio Calculations [J]. Modelling and Simulation in Materials and Engineering, 2014, 22(1): 015004.
[31] HIXSON R S, FRITZ J N. Shock compression of tungsten and molybdenum [J]. Journal of Applied Physics, 1992, 71: 1721-1726.
[32] WANG Y, CHEN D Q, ZHANG X W. Calculated equation of state of Al, Cu, Ta, Mo and W to 1000 GPa [J]. Physical Review Letters, 2000, 84(15): 3220-3223.
[33] MARTYNA G J, TOBIAS D J, KIEIN M L. Constant pressure molecular dynamics algorithms [J]. Journal of Chemical Physics, 1994, 101(5): 4177-4189.
[34] HOOVER W G. Canonical dynamics: Equilibrium phase-space distributions [J]. Physical Review A, 1985, 31(3): 1695-1697.
[35] NOSE S. A unified formulation of the constant temperature molecular dynamics methods [J]. Journal of Chemical Physics, 1984, 81(1): 511-519.
[36] PARRINELLO M, RAHMAN A. Polymorphic transitions in single crystal: A new molecular dynamics method [J]. Journal of Applied Physics, 1981, 52(12): 7182-7190.
[37] CLARKE A S, JONSSON H. Structural changes accompanying densification of random hard-sphere packing [J]. Physical Review E, 1993, 47(6): 3975-3984.
[38] STEINHARDT P J, NELSON D R, RONCHETTI M. Bond-orientational order in liquids and glasses [J]. Physical Review B, 2019, 28(2): 784-805.
[39] FINNEY J L. Modelling structures of amorphous metals and alloys [J]. Nature, 1977, 266(5600): 309-314.
[40] WANG Chao, YAO Yong-xin, HO Kai-ming, DING Z J. Atomistic cluster alignment method for local order mining in liquids and glasses [J]. Physical Review B, 2010, 82(18): 184204.
[41] FERRANDO R. Symmetry breaking and Morphological instabilities in core-shell metallic nanoparticles [J]. Journal of Physics: Condensed Matter, 2015, 27(1): 013003.
[42] BOCHICCHIO D, FERRANDO R. Morphological instability of core-shell metallic nanoparticles [J]. Physical Review B, 2013, 87(16): 165435.
[43] FRANZBLAU D S. Computation of ring statistics for network models of solids [J]. Physical Review B, 1991, 44(10): 4925-4960.
[44] CHUI Yu-hang, REES R J, SNOOK I K, O'MALLEY B, RUSSO S P. Topological characterization of crystallization of gold nanoclusters [J]. Journal of Chemical Physics, 2006, 125(11): 114703.
[45] WU Zhi-zhou, MO Yun-fei, LANG Lin, YU Ai-bing, XIE Quan, LIU Rang-su, TIAN Ze-an. Topologically close- packed characteristic of amorphous Tantalum [J]. Physical Chemistry Chemical Physics, 2018, 20(44): 28088-28104.
[46] JONSSON H, ANDERSEN H C. Icosahedral ordering in the Lennard-Jones liquid and glass [J]. Physical Review Letters, 1988, 60(22): 2295-2298.
[47] TIAN Ze-an, DONG K J, YU A B. Local rotational symmetry in the packing of uniform spheres [J]. Physics Chemistry Chemical Physics, 2017, 19(22): 14588-14595.
[48] MO Yun-Fei, TIAN Ze-an, LANG Lin, LIU Rang-su, ZHOU Li-li, HOU Zhao-yang, PENG Ping, ZHANG Tian-yi. The short-range order in liquid and A15 crystal of zirconium [J]. Journal of Non-Crystalline Solids, 2019, 513: 111-119.
[49] FRANK F C, KASPER J S. Complex alloy structures regarded as sphere packings (I): Definitions and basic principles [J]. Acta Crystal, 1985, 11(3): 184-190.
[50] MO Yun-fei, TIAN Ze-an, LIU Rang-su, HOU Zhao-yang, ZHOU Li-li, PENG Ping, ZHANG Hai-tao, LIANG Yong-chao. Molecular dynamics study on microstructural evolution during crystallization of rapidly supercooled Zirconium melts [J]. Journal of Alloy and Compounds, 2016, 688: 654-665.
��ѹ�½����ٹ�-�����ķ��Ӷ���ѧģ��
������1*���� ��2*��Ī�Ʒ�3�����ƾ�4������1��������5
1. ���ϴ�ѧ ��Ϣ��ѧ�빤��ѧԺ����ɳ 410082��
2. ��������ѧԺ ��������ӿ�ѧѧԺ������ 414000��
3. ��ɳѧԺ ������Ϣ���������ѧԺ����ɳ 410022��
4. Centre for Infrastructure Engineering, School of Engineering, University of Western Sydney, Penrith NSW 2751, Australia;
5. ���ϴ�ѧ ���Ͽ�ѧ�빤��ѧԺ����ɳ 410082
ժ Ҫ�����÷��Ӷ���ѧģ���о���ѹ�½����ٿ������̹����е���䣬����˫��ֲ������������Ŵط�����(LSCA)����ṹ���з���������ȴ����Ϊ0.1 K/ps��ѹǿ40~100 GPa�´����������Ƚᾧ����������(BCC)���壬Ȼ��һϵ��BCC-HCP������м�̬��ת�����������(HCP)���塣����ѧ���ؿ��ܵ���Һ-�������̰����м�̬������BCC��HCPת���Ĺ����У��ݺύ���ľ��絼�ºܶ��������ֵ��м��࣬�Ӷ�ʹ��Ϊһ�����Ĺ�-��ת�俴��������������䡣��Ϊһ��������صĽṹ����������LSCA��ʶ�������ܶѽṹ�ͼ�����ƽ����ֹ����Ȳ�����̽��������ϵ�еĹؼ��ṹ�ݱ䡣
�ؼ��ʣ����Ӷ���ѧģ�⣻�������̣���-����䣻�����Ŵط������������ܶ��Ŵ�
(Edited by Xiang-qun LI)
Foundation item: Projects (51661005, U1612442) supported by the National Natural Science Foundation of China; Project (QKHJC[2017]1025) supported by the Natural Science Foundation of Guizhou Province, China; Project (2018JJ3560) supported by the Natural Science Foundation of Hunan Province, China
Corresponding author: Ze-an TIAN; Tel: +86-13974843579; E-mail: tianzean@hnu.edu.cn
*Xiao-zhen DENG and Lin LANG contributed equally to this work.
DOI: 10.1016/S1003-6326(20)65436-X
Abstract: The phase transition of tungsten (W) under high pressures was investigated with molecular dynamics simulation. The structure was characterized in terms of the pair distribution function and the largest standard cluster analysis (LSCA). It is found that under 40-100 GPa at a cooling rate of 0.1 K/ps a pure W melt first crystallizes into the body-centred cubic (BCC) crystal, and then transfers into the hexagonal close-packed (HCP) crystal through a series of BCC-HCP coexisting states. The dynamic factors may induce intermediate stages during the liquid-solid transition and the criss-cross grain boundaries cause lots of indistinguishable intermediate states, making the first-order BCC-HCP transition appear to be continuous. Furthermore, LSCA is shown to be a parameter-free method that can effectively analyze both ordered and disordered structures. Therefore, LSCA can detect more details about the evolution of the structure in such structure transition processes with rich intermediate structures.
