
Trans. Nonferrous Met. Soc. China 22(2012) s343-s349
Comparative analysis between stress- and strain-based forming limit diagrams for aluminum alloy sheet 1060
FANG Gang, LIU Qing-jun, LEI Li-ping, ZENG Pan
Department of Mechanical Engineering, Tsinghua University, Beijing 100084, China
Received 28 August 2012; accepted 25 October 2012
Abstract:
The forming limit diagram (FLD) and forming limit stress diagram (FLSD) of aluminium alloy 1060 under linear and nonlinear strain paths are investigated. The calculation of FLSD is based on experimental FLD using the method proposed by Stoughton. Different from the FLD that varies with the strain path, the FLSD is not sensitive to the strain path. Therefore, FLSD is convenient as a forming limit criterion for multi-stage sheet forming. The influences of the material��s yield criteria on FLSD are also discussed by comparison of the Hill��s 48, Hill��s 79 and Hosford non-quadratic criterion. The impacts of material hardening laws (Voce and Swift models) on translation of FLD and FLSD are analyzed. The Voce hardening law and the Hosford yield criterion are appropriate for the FLSD calculation of the aluminium alloy 1060. The stress calculation program and display interfaces of FLD and FLSD are developed on MATLAB, where the strain data can be input from experiment measurement or FEM calculations.
Key words:
aluminium alloy 1060; sheet metal; forming limit diagram (FLD); forming limit stress diagram (FLSD); hardening laws; yield criterion;
1 Introduction
Fracture and wrinkle are common defects of sheet metal forming. The researchers devote their attentions to predict and resolve these problems by experimental and numerical simulation. Fracture occurs when a sheet metal blank is subjected to stretching or shearing (drawing) forces that exceed the failure limit of the material for a given loading history. Most of current formability tests are concerned with fracture occurring in stretching operations. In stretching, the sheet initially thins uniformly, at least in a local area, and necking induces ultimately fractures. Due to the complex stress and strain state on the sheet, the simple criteria based on stress or strain cannot be applied in fracture prediction of sheet metal forming.
The forming limit diagram (FLD) was discovered and developed by Keeler and Goodwin, which has been widely applied in analysis of sheet metal forming. Forming limit curve (FLC), the key feature of the FLD, records some pairs of in-plane limit strains (minor and major) and defines the boundary between safe zone (no necking) and dangerous zone (necking and splitting). The FLD of a formed part characterizes the degree of safety during the forming, which was also applied in analysis of a warm [1] or a hot [2] sheet metal forming.
FLD is usually determined by a serial of experiments. Initially, it is supposed to give a general criterion to predict the forming fracture or necking defects of a sheet metal part. Otherwise, for some complex forming or multi-stage forming, the loading path dependence of FLD makes it inappropriate for local necking prediction of deformed sheet [3].
KLEEMOLA and DELKKIKANGAS [4] investigated the limitations of the FLD by flanging operations following a draw forming operation. A forming limit stress diagram (FLSD) as an alternative was proposed, and some of their experimental results proved strain path independence of the forming limit in stress space for these materials. ARRIEUX et al [5] also proposed a stress-based criterion for all secondary forming operations. STOUGHTON [6] pointed out that it is necessary to use the stress-based criterion in all forming operations. Theory analysis and numerical simulation were also used to compute FLD. By the crystal plasticity theory in conjunction with the M-K approach, WU et al [7] examined and confirmed the path-dependency of FLSDs based on different non-proportional loading histories. ZHOU et al [8] determinated the FLSD in aluminium 3A12 and applied it to tube hydroforming analysis on LS-DYNA finite element simulations to predict the material fracture. HE et al [9] used the FLSD to predict the ductile fracture of aluminium alloy 5052, and verified it with the experimental Nakazima test and uniaxial tensile. WANG et al [10] calculated FLDs of magnesium alloy AZ31B based on the classical Taylor model of crystal plasticity and proved the strain path dependency of FLD. ZHALEHFAR et al [11] compared the FLD and FLSD of aluminium alloy 5083, and the conclusion was that the equal biaxial pre-straining decreased and shifted the FLC, but had no effect on FLSD. JIE et al [12] developed damage-coupled FLD models for warm forming and non-proportional loading, where the stress was fully considered during the FLD prediction of sheet metals.
Compared with strain, stress is difficult to measure from formed sheet metal, so FLSD is often translated from FLD. Constitutive relationship and yield criterion of material has significant influences on the stress calculation [13]. For a specified material, the proper model of constitutive and yield models should be determined to get stress with a high accuracy.
The objective of the present research is to determine FLD and FLSD of aluminium alloy 1060, and compare their dependencies on strain path (loading history). Some bulging and tension tests of aluminium alloy 1060 sheet are carried out. The nonlinear strain path is designed by combination of two linear strain paths, and the path-dependency of FLD and path-independency of FLSD are shown. The influences of constitutive model (hardening law) and yield criterion on the FLSD calculation from FLD are discussed.
2 Experimental
The chemical compositions (mass fraction) of the aluminium alloy 1060 used in the present investigation is as follows: 0.05% Cu, 0.25% Si, 0.35% Fe, 0.03% Mn, 0.03% Mg, 0.05% Zn, 0.03% Ti, and aluminium. Sheet specimens of cold-rolled and annealed aluminium alloy 1060 with 1.2 mm in thickness were prepared.
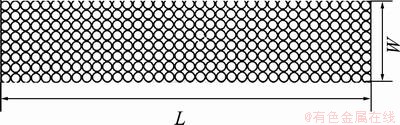
Fig. 1 Sheet specimen printed with grid circles
The circular grids were printed on the surface of sheet (Fig. 1). After deformation, a circle on the deformation area will be transferred into an ellipse. The direction of the strains is indicated by the major and minor axis of the ellipse. The diameter of printed circle grid is 4 mm, and there are no gaps between them. The length of specimen is constant 180 mm, and the width ranges from 40 mm to 160 mm.
The tests of bulging and tension were set to get the linear and nonlinear strain paths. The hemispherical punch used to the bulging test is shown in Fig. 2, which is mounted on the hydraulic press. Tension tests were performed on the tension machine. The dimension of tension sample is shown in Fig. 3.
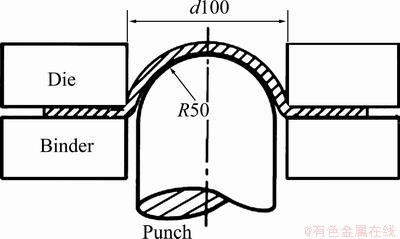
Fig. 2 Bulging test dies set (unit: mm)
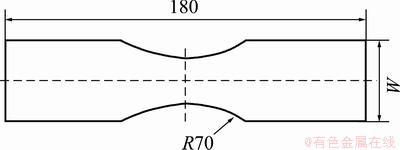
Fig. 3 Dimension of tension specimen (unit: mm)
The strain was measured by a vision-based surface strain measurement system. This system can determine three-dimensional (3D) coordinates of grid pattern printed on the surface of a deformed sheet-metal part. The surface strains on the selected area are calculated based on these measured coordinate data. To measure the coordinates of 3D surface, two video photographs are taken over the measurement area. The FLDs are generated by the measured straining. If the first local necking point is found, the punch movement should be stopped in time during the bulging test. At the large plastic deformation area, the circular grid becomes ellipses, and the major and the minor axis of ellipse were measured for calculation of strain.
The fractured grids should be avoided as possible as we can. Otherwise, it is hard to control the punch stroke during bulging test of aluminium alloy sheet. Figure 4 shows the fractured sheet after the punch is stopped. The sheet is necked or fractured at some points. For the fractured grid, the crack gap should be neglected when its major axis length is measured. It is relatively easy to measure deformed grids when the necking occurs. So, the bulging tests were repeated for getting the ideal state (only one local necking).
To analyze the effects of strain path on FLD and FLSD, the tension or bulging tests and the combination of tension and bulging tests were carried out.
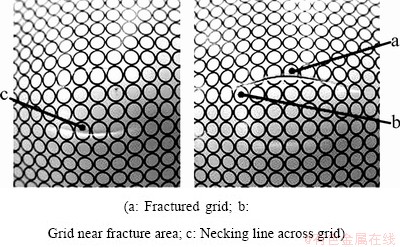
Fig. 4 Deformed grids on sheet surface
3 FLDs analysis
The grids on the deformation area of sheet metal are classified into three types: 1) homogeneous deformation and no obvious defects; 2) deformation localization and necking; and 3) fracture. The specimens with necking defects after the bulging tests are shown in Fig. 5. The FLD is generated and plotted after the measurement of the strains in deformed area (Fig. 6), where the three distinct zones are shown, i.e. fracture zone, critical zone and safe zone. This is typical FLD of sheet metal forming.
The combinations of tension and bulging test were carried out to get the FLD of nonlinear strain path. Considering the influences of strain path on the FLD, the two different loading paths were set, that is tension-bulging and bulging-tension (conversed forming sequence). Both pre-strains by tension and bulging are 0.17, and the necking specimens corresponding to two strain paths are shown in Fig. 7.
Figure 8 shows the positions of necking in FLD corresponding three strain paths. The position of FLC is influenced by the strain path. The FLC of a tension-bulging test is higher than that of a bulging-tension test. The FLC of linear strain path (single bulging) is between them. The observations from the tests are agreed with the statement of Ref. [14]. Therefore, the FLD at linear strain path is improper to predict the deformation defects at non-linear strain path.
4 FLSD calculation and analysis
4.1 Material characterization
The selection of material hardening criterion is essential to the stress calculation accuracy from measured strain. Uniaxial tension tests were performed for getting the stress-strain curves of aluminium alloy 1060 sheet. The true stress��true strain (s��e) data measured in each test were fitted to the Voce equation (Eq. (1)) and Swift equation (Eq. (2)). Comparison between Swift and Voce hardening criterion shows that Voce criterion has a better agreement with the experimental data of the aluminium alloy 1060 (Fig. 9).
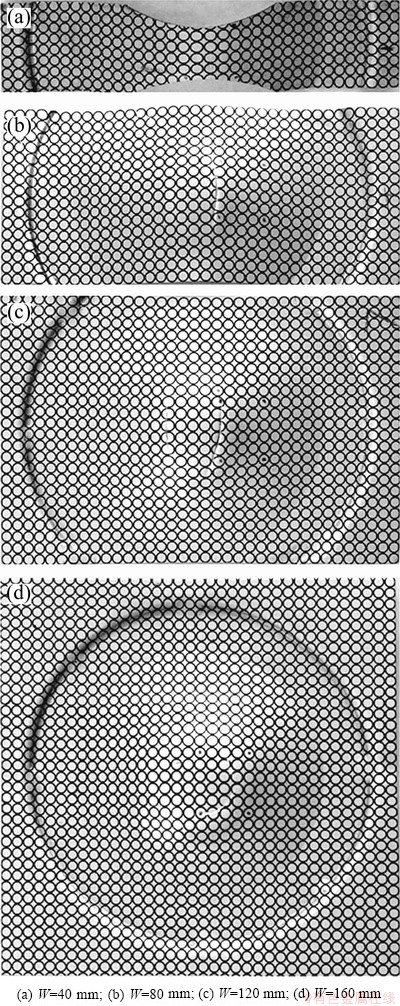
Fig. 5 Specimens after bulging tests
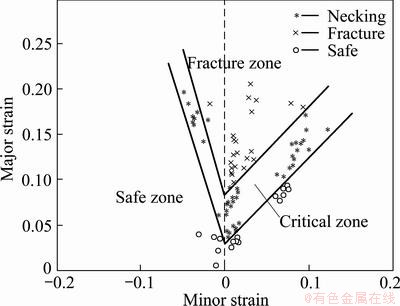
Fig. 6 FLD of aluminium alloy 1060 sheet by single bulging tests FLD of nonlinear strain path
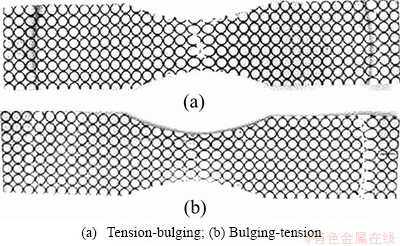
Fig. 7 Fractured sheets at different strain paths

Fig. 8 FLD at different strain paths
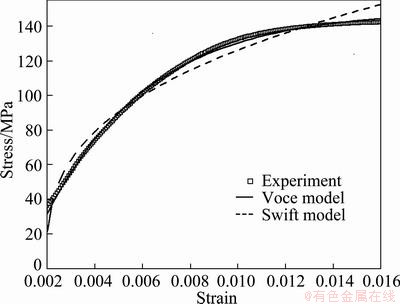
Fig. 9 Stress��strain curves from uniaxial tension test of Al 1060
For most of the aluminium alloys (AA6061 [15], AA3105, AA8011 [13]), the Voce model has a better agreement with the experimental points than other models.
 (1)
(1)
where and
and  are effective stress and strain, respectively; k, n and e 0 are the material constants.
 (2)
(2)
where A, B and C are the material constants that are calculated by fitting experimental stress/strain data.
The fitted parameters of Voce model are as Eq. (3). Therefore, the subsequent stress calculation from measured strain is based on Voce hardening criterion.
 (3)
(3)
The anisotropic is characterized by the r-value of sheet. The uniaxial tension test was carried out at 0��, 45�� and 90�� to the rolling direction of sheet. In the present research, the averaged r-value of 0.715 from three r-values is used.
4.2 FLSD calculation procedures
To generate the FLSD, the measured strain data need to be converted firstly into stress form. The conversion process from strain to stress adopts the method proposed by STOUGHTON [6]. The assumption is that the normal stresses act along the principal axes directions, and the stress in sheet thickness direction is ignored. The strain path is described by the strain ratio and the stress ratio (Eq. (4)). The in-plane major and minor stresses are calculated as Eq. (3).
 ,
,  (4)
(4)
 (5)
(5)
where  is equivalent stress calculated according to the flow and hardening law; s 1 and s 2 are the major stress and the minor stress, respectively;
  is a material parameter derived from the material yield criterion, and the Hill�� 48 (quadric) yield criterion is adopted.
 (6)
(6)
 (7)
(7)
 (8)
(8)
where r is anisotropic parameter; when the non-linear strain path is applied, if the pre-strains is  , the equivalent strain in this step is
 (9)
(9)
It is also the initial strain of the next loading step. The final strain of next load step is  , and the increasing strain in this step is
  . Therefore, the equivalent strain in this step is

 (10)
(10)
The in-plane major and minor stress can be calculated according to equations listed above.
 (11)
(11)
 (12)
(12)
If other yield criteria are adopted, the equivalent strain calculation (Eq. (6)) needed to be changed. For example, the equivalent strain calculated from the Hill��s 79 non-quadric criterion and the Hosford non-quadric criterion are expressed as Eq. (13) and Eq. (14), respectively.

 (13)
(13)
where the exponent m is set as 1.8 [6].


 (14)
(14)
where a is a coefficient equal to 6 for BCC and 8 for FCC material, so for the aluminium alloy sheet in the present investigation, a=8.
The calculation procedure is drawn out in Fig. 10, which is implemented by MATLAB program. The measured strains are input data, and the major and minor stress can be calculated according to the equations described above.
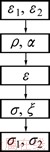
Fig. 10 Flow chart of FLSD calculation
4.3 FLSD analysis
The measured strains of necking points on the deformed sheet at the various loading paths are input into the stress calculation program (Fig 10), and the major and minor stresses are generated. Figure 11 shows the FLSD of aluminium alloy 1060 at various strain paths. The limit points at the linear strain path (bulging) are fitted as a forming limit stress curve (FLSC). The limit points under non-linear strain paths are almost on this fitted FLSC. Compared with FLD shown in Fig. 8, the calculated FLSD in Fig. 11 is not sensitive to loading (strain) path.
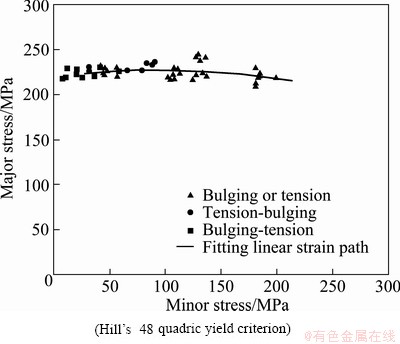
Fig. 11 Calculated FLSD at various stain paths
The FLSDs calculated by the Hill��s 48 and Hill��s 79 yield criteria are similar for tension or bulging tests (Fig. 11 and Fig. 12). But, the difference between FLSDs based on Hill��s 48 and Hill��s 79 yield criteria at the non-linear strain path is larger than that at the linear strain path.
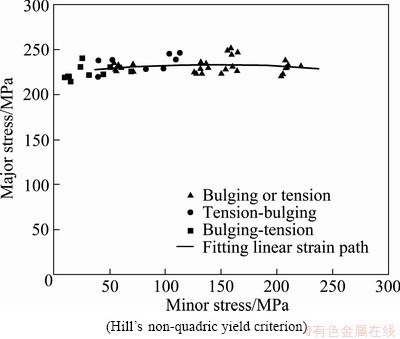
Fig. 12 Calculated FLSD at various stain paths
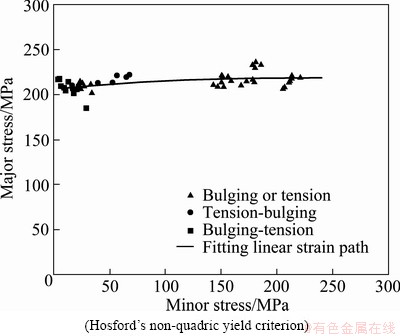
Fig. 13 Calculated FLSD at various stain paths
Figures 12 and 13 show the calculated FLSD with the Hill��s 79 and Hosford non-quadric yield criterion, respectively. It can also be found that the FLSD is influenced by the yield criterion. The Hosford��s non-quadric yield criterion has distinct FLSD from that of Hill��s yield criterion. The magnitude of stresses at the Hosford��s yield criterion is lower than others.
For the bulging, the main deformation area was in balanced biaxial stretching, and the calculated stress coordinate points in FLSD should have almost the same minor and major stresses. The stress calculations by three yield criteria have same tendencies for the balanced biaxial stretching, which reflects the actual state of stress.
The tension is uniaxial stress, and the coordinate points in FLSD should be near or on the vertical axis. However, these calculated points by Hill��s 48 and Hill��s 79 yield criteria (Fig. 11 and Fig. 12) are not on or close to vertical axis. Otherwise, the FLSD by Hosford��s yield criterion (Fig. 13) is in agreement with this point. So, the Hosford��s yield criterion is appropriate for the present experiment material.
5 Conclusions
1) The FLD and FLSD of aluminium alloy 1060 were investigated by the sheet forming tests. The influences of strain path on forming limits were studied by considering linear and non-proportional strain path, which was implemented by combinations of tension and bulging tests.
2) The present investigation confirms that the FLSD is not sensitive to strain paths of aluminium alloy 1060. Therefore, the FLSD should be considered to apply in the forming limit analysis for the complex or multi-stage sheet metal forming.
3) During the calculation of stress for FLSD from measured strain, both the hardening law and yield criterion are essential influence factors. The Voce hardening law and the Hosford non-quadric yield criterion are appropriate for the FLSD description of aluminium alloy 1060.
References
[1] WANG Hui, LUO Ying-bin, FRIEDMAN P, CHEN Ming-he, GAO Lin. Warm forming behaviour high strength aluminium alloy 7075 [J]. Transactions of Nonferrous Metals Society of China, 2012, 22(1): 1-7.
[2] HUANG Guang-sheng, ZHANG Hua, GAO Xiao-yun, SONG Bo, ZHANG Lei. Forming limit of texture AZ31B magnesium alloy sheet at different temperatures [J]. Transactions of Nonferrous Metals Society of China, 2011, 21(4): 836-843.
[3] STOUGHTON T B, ZHU X. Review of theoretical models of the strains-based FLD and their relevance to the stress-based FLD [J]. International Journal of Plasticity, 2004, 20: 1463-1486.
[4] KLEEMOLA H J, PELKKIKANGAS M T. Effect of pre-deformation and strain path on the forming limits of steel, copper and brass [J]. Sheet Metal Industry, 1977, 63(6): 591-599.
[5] ARRIEUX R, BEDRIN C, BOIVIN M. Determination of an intrinsic forming limit stress diagram for isotropic metal sheets [C]//Proceedings of the 12th Biennial Congress IDDRG. Santa Margherita, Italy, 1982: 61-71.
[6] STOUGHTON T B. A general forming limit criterion for sheet metal forming [J]. International Journal of Mechanical Sciences, 2000, 42(1): 1-27.
[7] WU P D, GRAF A, MACEWEN S R, LLOYD D J, JAIN M, NEALE K W. On forming limit stress diagram analysis [J]. International Journal of Solids and Structures, 2005, 42: 2225-2241.
[8] ZHOU Lin, XUE Ke-min, LI Ping. Determination and application of stress-based forming limit diagram in aluminium tube hydroforming [J]. Transactions of Nonferrous Metals Society of China, 2007, 17, s21-s26.
[9] HE Min, LI Fu-guo, WANG Zhi-gang. Forming limit stress diagram prediction of aluminium alloy 5052 based on GTN model parameters determined by in situ tensile test [J]. Chinese Journal of Aeronautics, 2011, 22: 378-386.
[10] WANG H, WU P D, BOYLE K P, NEALE K W. On crystal plasticity formability analysis for magnesium alloy sheets [J]. International Journal of Solids and Structures, 2011, 48: 1000-1010.
[11] ZHALEHFAR F, HOSSEINIPOUR S J, NOUROUZI S, GORJI A H. Effect of equal biaxial pre-strain on forming limit diagram of AA5083 [C]// Proceedings of International Conference on Advances in Materials and Processing Technology (AMPT2010). Paris, France, 2010: 24-27.
[12] JIE M, CHOW C L, WU X. Damage-coupled FLD of sheet metal for warm forming and nonproportional loading [J]. International Journal of Damage Mechanics, 2011, 20: 1243-1262.
[13] AGHAIE-KHAFRI M, MAHMUDI R, PISHBIN H. Role of yield criteria and hardening laws in the prediction of forming limit diagrams [J]. Metallurgical and Materials Transactions A, 2002, 33: 1363-1371.
[14] LIANG Bin-wen, CHEN Xiao-dai, WANG Zhi-heng. Formability of metal forming [M]. Beijing: China Machine Press, 1999. (in Chinese)
[15] BUTUC M C, GRACIO J J, ROCHA A B D. A theoretical study on forming limit diagram prediction [J]. Material Processing Technology, 2003, 142: 714-724.
����Ӧ���Ӧ����1060���Ͻ����μ��ޱȽϷ���
�� �գ����忡������Ƽ���� ��
�廪��ѧ ��е����ϵ������ 100084
ժ Ҫ��ͨ�����Ժͷ�����Ӧ��·���İ��ϳ���ʵ�飬�о�1060���Ͻ�ij��μ���ͼ(FLD)�ͳ���Ӧ������ͼ(FLSD)������Stoughton���������ڰ��ϳ���ʵ���в�õ�Ӧ�����ݣ�����õ���FLSD���������������1060���Ͻ���ϣ�FLD��Ӧ��·������صģ���FLSD��Ӧ��·��ȴ�����У�����FLSD���Ժܷ������Ϊ����ΰ��ϳ��εļ�����ͨ���Ա�Hill��s 48, Hill��s 79 ��Hosford�Ƕ���ʽ3�ֲ����������������Ǵ�FLD��FLSDת����Ӧ�������Ӱ�죬Hosford�Ƕ���ʽ��������ʺ�1060���Ͻ��FLSD���㡣 ͨ���뵥������ʵ�����ݵıȽϣ�����Ӳ������VoceӲ�����Swift����ʺϸò��ϡ���MATLAB�Ͽ�������Ӧ�䵽Ӧ���ļ����Լ�FLD��FLSD��ʾ�ij���ͨ������ʵ���в�õ�Ӧ�����ݿ��Եó�FLD��FLSD��
�ؼ��ʣ����Ͻ� 1060�����ϳ��Σ����μ���ͼ(FLD)������Ӧ������ͼ(FLSD)��Ӳ����������
(Edited by HE Yun-bin)
Foundation item: Project (NSFC 50205013) is supported by the National Natural Science Foundation of China
Corresponding author: FANG Gang; Tel: +86-10-62782694; E-mail: fangg@tsinghua.edu.cn
DOI: 10.1016/S1003-6326(12)61729-4
Abstract: The forming limit diagram (FLD) and forming limit stress diagram (FLSD) of aluminium alloy 1060 under linear and nonlinear strain paths are investigated. The calculation of FLSD is based on experimental FLD using the method proposed by Stoughton. Different from the FLD that varies with the strain path, the FLSD is not sensitive to the strain path. Therefore, FLSD is convenient as a forming limit criterion for multi-stage sheet forming. The influences of the material��s yield criteria on FLSD are also discussed by comparison of the Hill��s 48, Hill��s 79 and Hosford non-quadratic criterion. The impacts of material hardening laws (Voce and Swift models) on translation of FLD and FLSD are analyzed. The Voce hardening law and the Hosford yield criterion are appropriate for the FLSD calculation of the aluminium alloy 1060. The stress calculation program and display interfaces of FLD and FLSD are developed on MATLAB, where the strain data can be input from experiment measurement or FEM calculations.
