
J. Cent. South Univ. Technol. (2011) 18: 1293-1298
DOI: 10.1007/s11771-011-0835-y![]()
Embodied coefficient of energy carriers and its calculation method
LIU Meng(����)1, 2, LI Bai-zhan(���ս)1, 2, YAO Run-ming(Ҧ����)3
1. Faculty of Urban Construction and Environmental Engineering, Chongqing University,
Chongqing 400030, China;
2. Key Laboratory of the Three Gorges Reservoir Region��s Eco-environment, Ministry of Education,
Chongqing University, Chongqing 400030, China;
3. Department of Construction Management and Engineering, University of Reading, RG6 6AW, Reading, UK
? Central South University Press and Springer-Verlag Berlin Heidelberg 2011
Abstract:
To quantify the energy consumption in the process of production, transportation and processing of energy carriers, the life cycle of building energy used can be divided into two phases: on-site phase and embodied phase. As for the embodied phase, with the data in existing statistic yearbook, the consumption items of energy production and transportation were investigated. And based on the life cycle theory, an embodied coefficient of energy carriers was proposed to quantify the embodied energy consumption. Moreover, a calculation method for the embodied coefficient of energy carriers was deduced using Leontief inverse matrix based on the existing data sources. With relevant data of 2005-2007 in China, the embodied coefficients in 2005-2007 were obtained, in which the values for natural gas and thermal power are around 1.3 and 3.1, respectively; while they are 1.03-1.08 for other selected energy carriers. In addition, it is also found that the consumption in the production and processing accounts for more than 75%.
Key words:
life cycle; embodied energy; energy efficiency; sustainable development��
1 Introduction
Building is the pivot consumer of natural resource and energy, and its sustainability has attracted worldwide attention. Many scholars apply the life cycle theory, a basic method to analyze the sustainability [1-4], to building field in order to establish life cycle environmental performance evaluation or to analyze the life cycle consumption of building materials [5-6]. The total life cycle of building includes mining and transportation of raw materials, construction of building, operation and maintenance of building and demolition of building [6-9]. From the point of view of material flow of its end product, the flow of life cycle of building is actually divided into two kinds: energy flow and building material flow [10]. Moreover, from the point of view of life cycle, consumption of energy and building material includes not only on-site consumption but also off-site consumption which occurs in the process of production and transportation. The existing life cycle study is focused on embodied energy analysis for certain building material or facility [11-13], or for certain typical building [14-16]. In fact, all the previous studies just take the embodied energy of building materials into consideration, while the study of embodied energy of energy itself is rarely reported. For a national scale, this part will be accounted into relevant industries. While for an individual project, according to the principle of ��who consumes, who bears��, off-site consumption should also be taken into account when the total life cycle theory is used to analyze the building development, so as to provide effective data for building life cycle analysis. To facilitate the practical assessment, based on the existing statistical data, an embodied coefficient of energy carriers was put forward to figure out the embodied coefficient of energy carriers for life cycle analysis practice in China.
2 Embodied coefficient of energy carriers
2.1 Scope
The phase concerning with the mining, processing and transportation of energy and another phase related with the energy use and pollutant treatment constitute the life cycle of building energy use [10, 17-18]. As the pollutant treatment process is always realized in the energy production and process, the life cycle of building energy use can be divided into two phases: on-site phase (embodied phase) and off-site phase, which is illustrated in Fig.1.
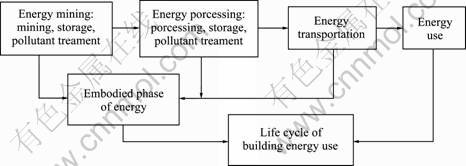
Fig.1 Life cycle of building energy use
The energy consumption in the embodied phase for study has the following boundaries:
1) The energy consumption in the embodied phase only includes the one-time consumption and corresponding indirect consumption. For instance, when a kJ energy is consumed directly, b kJ energy is consumed to produce a kJ energy, and furthermore, the b2/a kJ energy is consumed to produce b kJ energy, etc.
2) The consumption of producing the facilities is not considered because it is not put into certain energy produce in one time. And at the same time, its production consumption is accounted in its life cycle analysis.
3) Fossil energy consumption occurring in the period of energy production, processing and transportation is emphasized. The mining mainly reflects the first energy consumption, and the second one is produced in energy processing. The study will not take other recycle energy consumptions into consideration temporarily.
4) The energy categories in the study include the commercial energies listed in ��Chinese Energy Statistic Yearbook�� (Energy Yearbook in short). And the calorific value of energy is the average lower calorific value in attached list with premise that the calorific value will not change in processing.
2.2 Energy production and processing
According to relevant data in energy yearbook, there are ten kinds of commercial energies in our country, including raw coal, cleaned coal, gas, natural gas, electricity and so on [19]. It is difficult to analyze the life cycle of energy in detail because we have to find out the output of energy and the corresponding production and processing consumption as well as the detailed production craft and data. So, in order to analyze the data easily, the energy categories are incorporated according to the statistic items in Energy Yearbook with the consideration of integrality and security of data. For instance, the washed coal includes clean coal, other washed coal and briquette which can be converted into cleaned coal according to calorific value (See Table 1).
1) Coal mining and production
Table 1 Energy category and calorific values of representing energy [19]
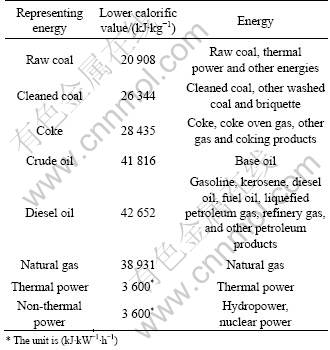
The representing energies of coal are raw coal, cleaned coal and coke. The consumption of base coal mining can be confirmed according to the data from ��Coal Mining and Dressing�� and ��China��s Energy Balance Sheet��Coal Washing�� illustrated in the Energy Yearbook. The output of raw coal is confirmed by the data in ��One-time Energy Production Capacity��; the productions of cleaned coal and energy consumption in processing are decided by the data in ��China��s Energy Balance Sheet��Coal Washing��; the productions of coke and energy consumption in processing are determined by data in ��China��s Energy Balance Sheet��Coke��. For the production of washed coal, the majority consumption of raw coal is input as raw material. But for the production of coke, the consumption of coal acts as raw material. According to the law of conservation of energy, extra consumption converted into raw coal capacity is regarded as net energy consumption.
2) Mining and production of petroleum product
The representatives of petroleum product are crude oil, diesel oil and natural gas.
The drilling process of crude oil and natural gas is usually performed at the same time. As the natural gas is the associated product of petroleum exploiting, the mining energy consumption is defined according to ��Oil and Gas Mining Industry�� with the principle of equal distribution between crude oil and natural gas. The outputs of diesel oil and processing consumption are confirmed by the data in ��China��s Energy Balance Sheet��Refining��. In the energy balance sheet of China, as refining craft, the majority consumption of crude oil is input as raw material. According to the law of conservation of energy, extra consumption converted into relevant crude oil capacity is regarded as net energy consumption.
3) Production of electrical products
The representatives of electrical products are thermal power and non-thermal power which includes hydropower and nuclear power. In the production and processing of hydropower and nuclear power, energy consumption exists. The electrical power generated in production and processing is non-fossil energy power while the study only takes fossil energy consumption in embodied phase into consideration. Considering the uncertainty of traditional hydropower and the impact of nuclear power on environment, the study takes electric heating value as fossil energy consumption value. The outputs of thermal power and processing consumption are confirmed by the data in ��China��s Energy Balance Sheet��Coal-fired Power��. According to the law of conservation of energy, extra consumption converted into raw coal capacity is regarded as net energy consumption.
2.3 Energy transportation
Transportation distance and mode are the main factors affecting the transportation energy consumption. The distance differs, so its influence on transportation energy consumption is different [20]. Equally, as the transportation modes diversify, such as air, sea, inland waterway, railway, highway and pipeline, their influence is different. Although the transportation mode of certain energies is limited, for instance, the natural gas is transported through pipeline, the transportation modes of majority energies are diverse, and the transportation consumption is restricted by the transportation facility and economy of a certain country or area. The transportation mode of certain energy is stable in certain period at specific place [21].
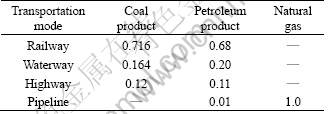
The coal is transported mainly by railway. Waterway transport and highway transport are also adopted. The transportation of petroleum products relies on railway, waterway, highway and pipeline. And the natural gas is mainly transported by pipeline. The transport distances of raw coal, cleaned coal, coke, crude oil and diesel oil are determined by the data in ��Transportation and Post��Classification of National Railway Freight Volume�� which is illustrated in the Statistics Yearbook of China. The transport distances of raw coal and cleaned coal, coke, crude oil and diesel oil are determined by the freight volume of ��coal��, ��coke�� and ��oil��, respectively. Transportation distance of natural gas is calculated according to the length of pipelines with 4 000 km in ��West-east Gas Transmission Project��. Proportion of different transport modes is not available in the Statistics Yearbook, so the study takes the data from Refs.[22-23] (See Table 2).
Table 2 Proportions of energy transportation mode
Gas engine, electric engine and steam engine are traction powers used in our railway. Because of its huge consumption, the steam engine is cut down, and the gas engine and electric engine are increased. For instance, there were about 5 000 steam engines in 1995, more than 1 000 in 2000, and about 100 in 2005; while the gas engine and the electric engine increase to 10 000 and 5 000, respectively [21]. Thus, it is possible to neglect the steam engine in railway transportation after 2005. The proportion of traction power used in transportation is close to the amount of the used engine which is decided by the data in ��Railway Engine Possession�� illustrated in the Energy Yearbook. Moreover, the energy consumption of engine can be confirmed according to the data in ��Railway Transportation Technological and Economic Index�� illustrated in the Energy Yearbook.
Waterway transportation is realized by seagoing vessel which focuses on international freight transport and inland waterway transport. Suppose that the inland waterway transport is the only mode for energy transport. According to the references, the energy consumption is 81.4 kg diesel oil per 10 000 t?km [17].
Highway transportation consumption is related to the factors such as the freight structure of auto, energy structure, freight rate and transport management. Supposing that bulk cargo transportation is considered and 20 t heavy-load trucks are adopted with diesel oil as power, the standard for energy consumption is secondary. And the density of diesel oil is 0.84 kg/L [17].
Based on the references, pipeline transport consumption is 256.26 kJ/(t?km). As for the energy constitution, electric power holds 42% and the natural gas holds 58% [17].
Electrical transport consumption is confirmed by the data of transport consumption and supply in ��The Electrical Balance Sheet�� illustrated in Energy Yearbook. And the transport consumption will not be taken into account for non-thermal power.
2.4 Embodied coefficient of energy carriers
The embodied coefficient of energy carriers is defined as
![]() (1)
(1)
where a is the embodied coefficient of energy carriers; Ef is the energy lower calorific value; Ep is the energy lower calorific value in the process of production and transportation.
The relationship of iteration exists in energy consumption in the process of mining, production, and transportation, as shown in Table 3.
Table 3 Relationship of iteration
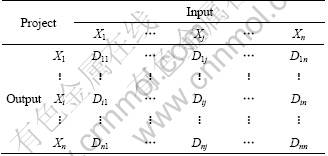
Suppose that D is the direct consumption coefficient matrix:

The embodied coefficient of energy is defined by
![]() (2)
(2)
where

![]()
and I is the unitary matrix.
3 Embodied coefficient of energy carriers in China
Based on the relevant data in 2005-2007 [24-27], the application analysis is conducted, and the embodied coefficient of energy carriers in China in 2005-2007 is calculated, as illustrated in Table 4.
Table 4 Embodied coefficients of energy carriers in China in 2005-2007
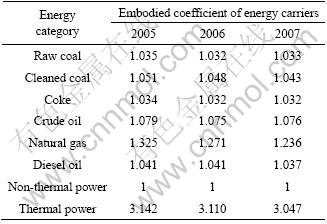
Figure 2 illustrates the direct consumption coefficient of energy carriers and full consumption coefficient (��T=��-1). Figure 3 illustrates the direct energy consumption ratio of processing and transportation in the embodied phase.
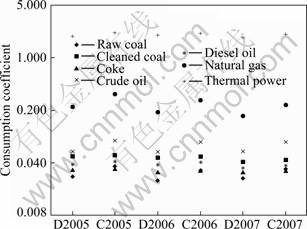
Fig.2 Direct consumption coefficient and full consumption coefficient of certain energies in embodied phase (C: Full consumption coefficient; D: Direct consumption coefficient)
Based on Figs.2 and 3, it is concluded:
1) The embodied coefficient of energy carriers shows downtrend. Among them, the natural gas decreases by 3%-4%, the thermal power decreases by 1%-2% and the other energies keep stable in 2%-4%. The mining of natural gas and crude oil is conducted simultaneously. The stabilization of embodied consumption of crude oil explains the relative increasing productivity of natural gas. And the electric production increases fast.
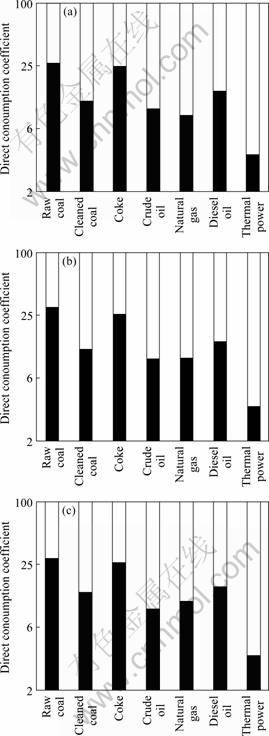
Fig.3 Direct consumption coefficients of energies in transportation, production and processing (�� Transportation; �� Production and processing): (a) 2005; (b) 2006; (c) 2007
2) From the view-point of embodied coefficient, the consumption of thermal power is two times, around 210% as large as its own energy value. The consumptions of natural gas and other energy categories are 30% and 3%-8%, respectively. As for other energies, the consumption is nearly the same as the embodied coefficient of representing energy carriers.
3) As for the transportation and processing periods, processing consumption is the largest one in the total consumption. The processing consumption for thermal power holds 96% of the total consumption, raw coal and coke hold 75%, and other energy categories hold 85%- 90%.
4) As for the energy carriers, such as cleaned coal, the coke and diesel oil, by comparing direct consumption coefficients with full consumption coefficients, it is well-known that the majority consumption in the embodied phase is equal to the unit heat value that is less than its heat value. Accordingly, their full consumption coefficients are slightly (4%-8%) higher than the direct consumption coefficients. For natural gas, raw coal, crude oil, etc, the majority consumption in the embodied phase is equal to the unit heat value that is larger than or equal to its heat value, and their full consumption coefficients are 40%-60% higher than the direct consumption coefficients.
4 Conclusions
1) According to the analysis of data in 2005-2007, the energy consumption in embodied phase is 3%-8% of the energy heat value. The consumptions of natural gas and thermal power in the embodied phase are about 30% and 210%, respectively.
2) The changing rates of the coefficients are decreased by about 2%-4% annually.
3) By comparing the yearly data, the embodied coefficient of energy carrier decreases, which implies that the embodied phase is optimized and the energy consumption is reduced.
4) The consumption in the process of production and processing accounts for more than 75% of the consumption produced in the embodied phase.
5) With relevant data of 2005-2007 in China, the embodied coefficients for natural gas and thermal power are around 1.3 and 3.1, respectively; while they are 1.03-1.08 for other selected energy carriers.
References
[1] PENNINGTON D W, POTTING J, FINNVEDEN G Life cycle assessment. Part 2: Current impact assessment practice [J]. Environment International, 2004, 30(5), 721-739.
[2] CURRAN M A. Life-Cycle assessment [J]. Encyclopedia of Ecology, 2008, 32(2): 2168-2174.
[3] FINNVEDEN G, HAUSCHILD M Z, EKVALL T. Recent developments in life cycle assessment [J]. Journal of Environmental Management, 2009, 91(1): 1-21.
[4] TALENS PEIR? A, LOMBARDI L, VILLALBA M?NDEZ G. Life cycle assessment (LCA) and energetic life cycle assessment (ELCA) of the production of biodiesel from used cooking oil (UCO) [J]. Energy, 2010, 35(2): 889-893.
[5] ALEJANDRO J, ANTONIO A, ARNALDO C. Comparative analysis of the life cycle impact assessment of available cement inventories in the EU [J]. Cement and Concrete Research, 2007, 37(5): 781-788.
[6] ZHANG Zhi-hui, WU Xing, YANG Xiao-min. BEPAS��A life cycle building environmental performance assessment model [J]. Building and Environment, 2006, 41(5): 669-675.
[7] LI Zhu-guo. A new life cycle impact assessment approach for buildings [J]. Building and Environment, 2006, 41(10): 1414-1422.
[8] VERBEECK G, HENS H. Life cycle inventory of buildings: A contribution analysis [J]. Building and Environment, 2010, 45(4): 964-967.
[9] VERBEECK G, HENS H. Life cycle inventory of buildings: A calculation method [J]. Building and Environment, 2010, 45(4): 1037-1041.
[10] LIU Meng. Generic model and application of environmental impacts energy analysis for building life cycle [J]. Journal of Civil, Architectural & Environmental Engineering, 2008, 31(3): 114-118. (in Chinese)
[11] CATARINA T. A low energy building in a life cycle��Its embodied energy, energy need for operation and recycling potential [J]. Building and Environment, 2002, 37(4): 429-435.
[12] GREG B, JAVIER G, FERNANDEZ V. Materials, operational energy inputs, and net energy ratio for photobiological hydrogen production [J]. International Journal of Hydrogen Energy, 2007, 32(9): 1225- 1234.
[13] YOHANIS Y G, NORTON B. Life-cycle operational and embodied energy for a generic single-storey office building in the UK [J]. Energy, 2002, 27(1): 77-92.
[14] WANG Ren-ping, CAI Zhen-yu. An ecological assessment of the vernacular architecture and of its embodied energy in Yunnan, China [J]. Building and Environment, 2006, 41(5): 687-697.
[15] CHEN T Y, BURNMETT J, CHAU C K. Analysis of embodied energy use in the residential building of Hong Kong [J]. Energy, 2001, 26(4): 323-340.
[16] ASHISH S, TIWARI G N, SODHA M S. Embodied energy analysis of adobe house [J]. Renewable Energy, 2009, 34(3): 755-761.
[17] HUANG Zhi-jia. Assessment model for building energy system and case study [D]. Shanghai: Tongji University, 2003: 115-134. (in Chinese)
[18] WANG Shou-bing. Life cycle analysis of complex products in China [D]. Shanghai: Fudan University, 2000: 98-114. (in Chinese)
[19] China Statistical Bureau, China Reform & Development Commission. China energy yearbook [M]. Beijing: China Statistical Press, 2006: 168-189. (in Chinese)
[20] LI Xia-miao, XIE Ru-he. The relationship of transportation and energy consumption [J]. Comprehensive Transportation, 1999, 21(10): 23-27. (in Chinese)
[21] China Statistical Bureau. China statistical yearbook [M]. Beijing: China Statistical Press, 2006: 178-211. (in Chinese)
[22] ZHOU Feng-qi, WANG Qing-yi. The fifty years of China��s energy [M]. Beijing: China Power Press, 2002: 115-127. (in Chinese)
[23] LI Fa-zhi, FANG Shu-fen. Transportation means of oil products in northeast area [J]. Storage and Transportation of Oil and Gas, 1993, 17(6): 8-10, 32-28. (in Chinese)
[24] China Statistical Bureau, China Reform & Development Commission. China energy yearbook (2007) [M]. Beijing: China Statistical Press, 2007: 224-248. (in Chinese)
[25] China Statistical Bureau, China Reform & Development Commission. China energy yearbook (2008) [M]. Beijing: China Statistical Press, 2008: 236-251. (in Chinese)
[26] China Statistical Bureau. China statistical yearbook (2007) [M]. Beijing: China Statistical Press, 2007: 245-258. (in Chinese)
[27] China Statistical Bureau. China statistical yearbook (2008) [M]. Beijing: China Statistical Press, 2008: 256-274. (in Chinese)
(Edited by YANG Bing)
Foundation item: Project(CDJZR10210009) supported by Central College General Fund for Natural Science of Chongqing City, China
Received date: 2010-05-11; Accepted date: 2010-10-29
Corresponding author: LIU Meng, Associate Professor, PhD; Tel: +81-23-65128079; E-mail: liumeng2033@126.com
