

J. Cent. South Univ. (2021) 28: 2451-2462
DOI: https://doi.org/10.1007/s11771-021-4779-6

Application of signal processing and support vector machine to transverse cracking detection in asphalt pavement
YANG Qun(��Ⱥ)1, ZHOU Shi-shi(��ʦʦ)1, WANG Ping(����)1, ZHANG Jun(�ſ�)2
1. Key Laboratory of Road and Traffic Engineering (Ministry of Education), Tongji University,Shanghai 201804, China;
2. Shanghai Municipal Engineering Design Institute (Group) Co., Ltd., Shanghai 200092, China
 Central South University Press and Springer-Verlag GmbH Germany, part of Springer Nature 2021
Abstract:
Vibration-based pavement condition (roughness and obvious anomalies) monitoring has been expanding in road engineering. However, the indistinctive transverse cracking has hardly been considered. Therefore, a vehicle-based novel method is proposed for detecting the transverse cracking through signal processing techniques and support vector machine (SVM). The vibration signals of the car traveling on the transverse-cracked and the crack-free sections were subjected to signal processing in time domain, frequency domain and wavelet domain, aiming to find indices that can discriminate vibration signal between the cracked and uncracked section. These indices were used to form 8 SVM models. The model with the highest accuracy and F1-measure was preferred, consisting of features including vehicle speed, range, relative standard deviation, maximum Fourier coefficient, and wavelet coefficient. Therefore, a crack and crack-free classifier was developed. Then its feasibility was investigated by 2292 pavement sections. The detection accuracy and F1-measure are 97.25% and 85.25%, respectively. The cracking detection approach proposed in this paper and the smartphone-based detection method for IRI and other distress may form a comprehensive pavement condition survey system.
Key words:
Cite this article as:
YANG Qun, ZHOU Shi-shi, WANG Ping, ZHANG Jun. Application of signal processing and support vector machine to transverse cracking detection in asphalt pavement [J]. Journal of Central South University, 2021, 28(8): 2451-2462.
DOI:https://dx.doi.org/https://doi.org/10.1007/s11771-021-4779-61 Introduction
Pavement structures would be susceptible to various kinds of distresses (cracking, rutting, pothole, etc.) during their service life, mainly due to traffic loading and environmental effect. Transverse cracking is a dominating pavement distress of asphalt pavement with a semi-rigid base in China [1]. Crack detection is essential for pavement maintenance and performance evaluation. Due to the large number of transverse cracks, an economic and frequent detection method for transverse cracks is preferred for routine maintenance. The detection results can be utilized to enable the monitoring of the transverse crack��s development and the evaluation of pavement performance. At present, visual inspection methods like conventional manual field inspection and innovative image recognition are standard methods for investigating pavement cracks. The artificial investigation generally is considered to be time-consuming, tedious, subjective and unsafe [2]. In recent years, the automatic identification and classification of pavement crack images (2D or 3D) have received increasing attention [3, 4]. However, due to the complexity of the road surface conditions (such as poor illumination or oil pollution), the challenges associated with this method still exist. It needs human intervention, and the accuracy and real-time performance are not that satisfactory considering large road networks.
Vibration-based pavement condition survey has achieved significant development [5, 6]. This kind of method is mainly implemented in two ways, through the vibration sensor or through the smartphone (embedded with an accelerometer), both of which are installed in the moving vehicle. YU et al [7] proposed that the road surface distress can be detected by the mechanical response of automobile vibration. The vibration signal at the distress has large fluctuations; the amplitude and frequency of the vibration response depend on distress severity. In 2008, MIT��s Computer Science and Artificial Intelligence Laboratory proposed a P2 (pothole patrol) detection method for potholes [8]. Due to the development and popularization of smartphones, PERTTUNEN et al [9] proposed that vehicle vibration signal can be acquired through the built-in acceleration sensor and GPS of the smartphone. For more information on smartphone-based road surface monitoring, one can refer to the review done by SATTAR et al [10]. The studies mentioned above have proved the feasibility of detecting road conditions using vehicle vibration, but there are still some limitations.
1) The detection objects are mostly obvious pavement surface anomalies, such as potholes, speed bumps and bumps, yet the indistinctive transverse cracking has hardly been considered.
2) The pavement surface anomalies are normally detected in the time domain by observing the shape of vehicle vibration signals or by setting the threshold of acceleration. Consequently, only time-domain parameters are used, which is unable to reveal the intrinsic characteristics of the signal.
3) The use of low-cost smartphones to detect pavement conditions cannot perform well as expected [11]. This may be caused by two reasons: the accuracy and sampling frequency of the three-axis accelerometer that comes with the smartphone are not high; the smartphone is usually placed in the dashboard or seat of the testing car, making it less sensitive to pavement condition compared with the vibration sensor (smaller than a phone) mounted on the control arms, axles or suspension knuckle.
The vibration signal of the vehicle would become non-stationary when the transverse crack exists. Thus some parameters in time domain (mean, variance) and frequency domain (frequency, amplitude) may change. Many researchers have attempted to detect road conditions through the time domain analysis of vehicle vibration signals, using acceleration amplitude and standard deviation as evaluation indicators [12, 13]. However, this method may not be applicable to transverse cracking because they have less impact on vehicle vibration. In fact, Fourier transform (FT) and wavelet analysis have been applied to structural damage detection by many researchers [14, 15]. Therefore, this paper attempts to identify the transverse crack of asphalt pavement based on the comprehensive analysis of the vehicle vibration signal. Time domain analysis, FFT frequency domain analysis and wavelet analysis were performed to extract the features needed for the classification model.
This paper proposes a detection method for the transverse crack of asphalt pavement through the vibration sensor mounted on the vehicle. A comprehensive analysis of the vehicle vibration signal was conducted. The innovation of this method lies in the comprehensive signal processing and SVM classifier. Note that the purpose of this paper is not to replace the current cracking detection method like artificial detection and image recognition, but to act as an alternative to them. More importantly, it can supplement the existing vibration-based pavement condition detection system.
The remainder of this paper is structured as follows: Section 2 introduces the experimental scheme; the vibration signal at cracked sections and uncracked sections is analyzed in Section 3 to extract several features; Section 4 describes the generation process of the optimal SVM classification model; the feasibility of the proposed method is investigated by 2292 pavement sections in Section 5; finally, the conclusions and discussions of this study are given in Section 6. The system architecture of the proposed crack detection method is shown in Figure 1.
2 Testing system
2.1 Background
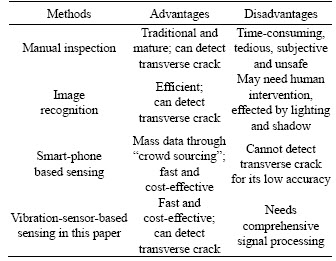
The comparison of four pavement condition survey methods and the vehicle-based sensing method proposed in this paper is shown in Table 1.
This paper focuses on transverse cracks of asphalt pavement. The purpose is to identify inconspicuous transverse cracks through comprehensive vibration signal analysis and SVM,so as to supplement the existing vibration-based road detection system.

Figure 1 System architecture of proposed crack detection method
Table 1 Comparison of pavement condition survey methods
2.2 System components
The vibration sensing system (shown in Figure 2) is constituted by a sedan, a piezoelectric accelerometer, a constant current adapter, a data acquisition card, a laptop, and a motion camera. The total price of the sensing system is about 1000 $, which is more expensive than an ordinary smartphone embedded with an accelerometer. However, the accuracy and sampling frequency are much higher. More importantly, the vibration sensor can be mounted on more places for its small size (the diameter is 17 mm, the height is 22 mm). The acceleration sensor was installed on the right front suspension knuckle. Therefore, the accelerometer is not subject to the vibration isolation system, making the sensor more sensitive to the road excitation.
2.3 Testing plan
The test was conducted on three roads in Shanghai, China by the same vehicle. During the test, the road surface images were collected by the motion camera simultaneously. The test sections are asphalt pavements with a semi-rigid base, and only the transverse cracks exist in the selected sections to avoid the influence of other pavement distresses.
There are 109 transverse cracks within three roads according to the video data. After all, the transverse cracks only occupy a small portion in these sections, and most sections are uncracked. To circumvent the influence of unbalanced sample data, under-sampling the category with a large proportion (uncracked section) is a common way [16]. Besides, enough data should be used to train the classifier. Hence, the number of selected uncracked segments is 2 times of the cracked segments, namely 218.
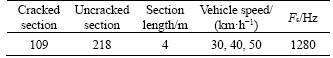
The section length cannot be long since the crack may not affect the signal on a long profile. The length should not be too small as it would result in fewer sampling points, which is not conducive to signal analysis such as Fourier transform. Hence, the length of the vibration signal at one section is selected as 4 m. The number of sampling points in one section can be determined by the driving speed and sampling frequency (Fs). The sampling frequency is supposed to be high in case of high vehicle speed. Fs is therefore set to 1280 Hz. The key parameters in the testing are shown in Table 2.
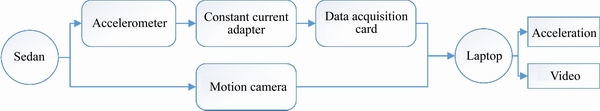
Figure 2 Diagram of sensing system
Table 2 Key parameters of testing
3 Vibration signal processing
According to the experimental scheme, the signal of 109 transverse-cracked sections and 218 crack-free sections were obtained. The length of each signal section is 4 m. The purpose of processing the vibration signal is to extract the indicators that can discriminate the transverse-cracked pavement and the uncracked pavement.
3.1 Signal preprocessing
3.1.1 Zero mean
Since the signal would be processed by the FFT, its mean value should be zero, aiming to avert the influence of the direct current (DC) component. Therefore, the signal is zero-averaged by Eq. (1):
 (1)
(1)
where yij is the j-th data of the i-th signal after zero-mean; xij is the j-th data of the original i-th signal; ni is the number of data points in i-th signal.
3.1.2 Signal de-noising
De-noising on the vehicle vibration data is required before the subsequent signal analysis since it is non-stationary signal contaminated with noise. Wavelet analysis can eliminate high-frequency noise while retaining useful high-frequency signals [17]. In this article, the signal is processed by the wavelet soft threshold de-noising method, which has been widely used in engineering.
Considering the characteristics of the signal itself and the sampling frequency, we used Symlet3 wavelet base to decompose the vibration signal into four layers for signal de-noising. A pair of the original vibration and that after de-noising are plotted in Figure 3. After de-noising by wavelet decomposition, the high-frequency noise caused by the pavement texture has been effectively eliminated, and thus the cracking part is more detectable.
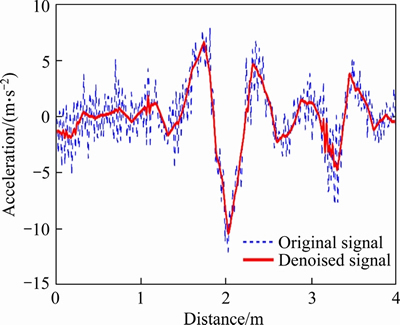
Figure 3 A pair of original signal and denoised signal
3.2 Time domain analysis
The vibration waveforms of a typical cracked section and its adjacent crack-free section at three vehicle speeds are plotted in Figure 4. The vehicle speeds are 30, 40 and 50 km/h, respectively. Crack30 and Uncrack30 refer to the vehicle vibration signal with the driving speed of 30 km/h on the cracked section and the uncracked section, respectively.
According to Figure 4, 1) when the vehicle speed increases from 30 to 50 km/h, the vehicle vibration becomes more severe; 2) the acceleration value of the vehicle passing through the transverse crack changes significantly, compared with that of the crack-free section; 3) the shape of the vibration acceleration in the transverse cracking is approximately V-shaped.
The vibration signal is velocity-dependent based on the above analysis. Hence vehicle speed should be considered as a feature of the crack and crack-free classification model. Range is proposed as another feature, and the formula for the range of the i-th signal is:
 (2)
(2)
Although the test sections are asphalt pavements with semi-rigid base, pavement stiffness difference due to the variance in pavement age and structure combination may result in different vehicle vibration. For instance, small transverse cracks on stiffer roads may have a higher amplitude of vehicle vibration than larger transverse cracks on less rigid roads. Therefore, the relative standard deviation is proposed as a feature, and the formula is defined as:
 (3)
(3)
where Restdk,i denotes the relative standard deviation of the vibration signal of the i-th section at the k-th test road. Stdk,i is the standard deviation of the vibration signal of the i-th section of the k-th test road. Stdk is the standard deviation of the k-th test road. In this article, the vibration data were collected in 3 test roads. Namely, k equals 3.

Figure 4 Waveform of vibration signal at (a) Crack30, (b) Uncrack30, (c) Crack40, (d) Uncrack40, (e) Crack50,(f) Uncrack50
3.3 Fourier analysis
Fourier transform can be used to perform spectrum analysis on the vibration signals to distill the frequency domain features. Signal analysis can be extended to the frequency domain through Fourier transform. Fast Fourier transform (FFT) has been widely used in signal analysis for its higher efficiency.
FFT was performed to comparatively analyze the de-noised vibration signals at cracked and uncracked sections. The acceleration spectrums of one pair of the signal are determined, as shown in Figure 5, where A stands for amplitude.
According to Figure 5, 1) because of the interaction of the uneven road surface, engine, drive train and wheel, the frequency composition of the vibration acceleration signal is complicated, and there is no single peak; 2) the frequency distribution of the vibration signal is mainly distributed below 40 Hz (especially between 10 and 20 Hz);3) compared with the crack-free section, the amplitude at the spectrum of the cracked section is larger in the frequency band of 0-40 Hz, but almost remains the same after 40 Hz; 4) a higher speed (v=50 km/h) may have higher amplitude at frequency domain compared with a lower speed (v=30 km/h).
It can be concluded that the existence of the transverse crack magnifies the amplitude at the band of 0-40 Hz, so the maximum amplitude of the FFT can be used as a feature of the classification model.
One peak acceleration may correspond to a plurality of frequencies, or the peak acceleration and the second large acceleration are very close. However, the corresponding frequencies are quite different, as illustrated in the box in Figure 5. Therefore, the equivalent frequency (EF) is chosen as a feature, which is defined as the frequency corresponding to the centroid of amplitude-spectrum [18]:

Figure 5 Vehicle acceleration spectrum at (a) Crack30, (b) Uncrack30, (c) Crack40, (d) Uncrack40, (e) Crack50, (f) Uncrack50
 (4)
(4)
where fi represents the i-th frequency; F(fi) is the amplitude corresponding to frequency fi; fm and fn denote the minimum and maximum frequency, respectively. Here fm is 0, and fn is 40 Hz.
3.4 Wavelet analysis
Continuous wavelet transform (CWT) is a potent time-frequency analysis tool. Let ��(t)��L2(R) be a mother wavelet, and the continuous wavelet transform of x(t) is defined as:
 (5)
(5)
where a is the scaling parameter; b is the translating parameter; * is the complex conjugate; and a is inversely proportional to the frequency of the wavelet base [19].
The wavelet transform can highlight the signal similar to the wavelet base through amplifying its wavelet coefficient. Continuous wavelet transform was performed on the vehicle vibration signal, and Figure 6 shows the distance-frequency diagram of one pair of the signal. A transverse crack occurs at 2 m of the cracked section, and the color-bar represents the wavelet coefficient. The existence of the transverse crack makes the wavelet coefficient at 10-20 Hz prominent. Also, a higher speed (v=50 km/h) may have a larger wavelet coefficient and wider scope of influence compared with a lower speed (v=30 km/h).
Therefore, the maximum wavelet coefficient may be another crack-sensitive feature in the classification model.
4 Classification model
Support vector machine (SVM) has been widely applied to damage detection in structural health monitoring, which has a solid theoretical foundation and generalization ability [20]. The essence of SVM is to map the low-dimensional linear inseparable feature space into the high-dimensional feature space, and find the optimal hyperplane in the new space [21]. In this paper, the SVM binary classification model is used to classify the transverse-cracked section and the crack-free section.
4.1 Feature extraction
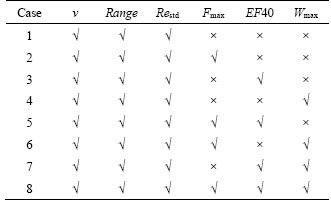
Features represent the distinguishing information retrieved from the data, and the selection of feature subsets is critical to the performance of the classification model [22]. Several features have been selected from the analysis in Section 3, including vehicle speed (v), range and relative standard deviation (Restd) at time domain, maximum amplitude of Fourier transform (Fmax), equivalent frequency at 0-40 Hz (EF40), and maximum wavelet coefficient (Wmax). Merely increasing the number of features not only reduces the efficiency of the model, but does not necessarily improve the model performance. Therefore, eight feature subsets are selected, as shown in Table 3. Among them, the vehicle speed, range, and relative standard deviation are considered to be relatively essential factors (SATTAR et al [10]), so they are included in all eight feature subsets.
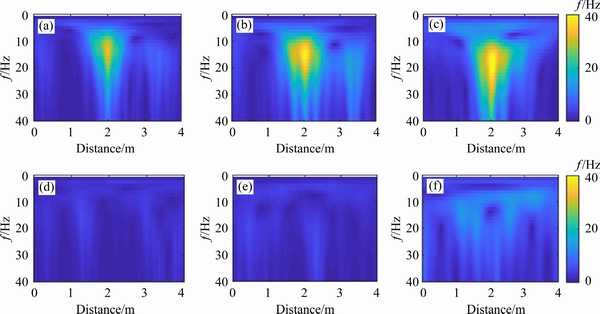
Figure 6 Wavelet analysis of vibration signal at (a) Crack30, (b) Crack40, (c) Crack50, (d) Uncrack30, (e) Uncrack40, (f) Uncrack50
Table 3 Feature subsets
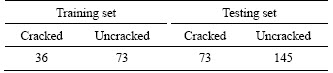
For the collected 327-segment signals, their features and labels (cracked or uncracked) were determined. The numerical values of features are normalized in [0, 1] according to Eq. (6) to avoid the feature with greater numerical range dominating that with smaller numerical range and to alleviate calculation difficulties. 327 data sets were divided into 218 training sets and 109 test sets. The details of the labels are shown in Table 4.
 (6)
(6)
where p is the number of data set, namely 327, q is the number of the feature, namely 1, 2, ��, 6, x��p,q is the normalized data, and xp,q is the data before normalization.
The sample data in case 8 are shown in matrix (7) and the labels are [y1, ��, y327]T.
 (7)
(7)
Table 4 Data classification
4.2 Parameter optimization
The radial basis kernel function is widely applied in support vector machine since it is commonly believed to have good results [23]. Therefore, the radial basis kernel function was employed in this study, as shown in Eq. (8).
 (8)
(8)
where x is the instance, and l is the center of the kernel function.
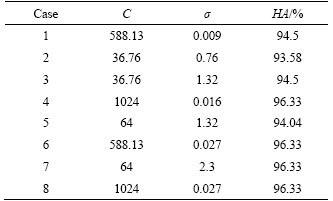
The classification performance of the SVM is affected by the error penalty parameter C and the kernel parameter ��, consequently, parameter selection must be done [24]. In this study, the grid search method is employed to obtain the optimal parameters C and ��. C and �� were tuned from 2-10 to 210, with a step size of 20.8. Various pairs of parameters (C, ��) were tried, and the one with the highest accuracy in cross-validation would be selected as the model parameters. For the 218 training sets of 8 cases, the LibSVM3.2 Toolbox in MATLAB was used to obtain the model accuracy under various C and ��. The optimal C, �� and the highest accuracy (HA) are shown in Table 5.
Table 5 Optimal C, �� and HA of each case
4.3 Model optimization
Once the model parameters C and �� of each case are determined, 8 crack and crack-free classification models can be generated in MATLAB using 218 training sets, and 109 data sets were used as the test set. The training accuracy (At) by 5-fold cross-validation of the training set and the generalization accuracy (Ag) of the testing set for 8 cases are determined, thereby obtaining the overall accuracy (Ao):
Ao=0.5At+0.5Ag (9)
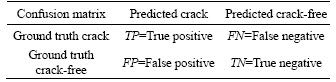
The confusion matrix is often used to judge the pros and cons of the classifier, as shown in Table 6. Then, precision (P) and recall (R) can be determined by Eqs. (10) and (11). Considering that P and R could be ambivalent sometimes, F1-measure is generally used as a comprehensive evaluation index, which is the harmonic mean of P and R, shown in Eq. (12).
Table 6 Confusion matrix
 (10)
(10)
 (11)
(11)
 (12)
(12)
The training accuracy (At), generalization accuracy (Ag), overall accuracy (Ao), precision (P), recall (R), and F1-measure for the eight classification models are plotted in Figure 7.
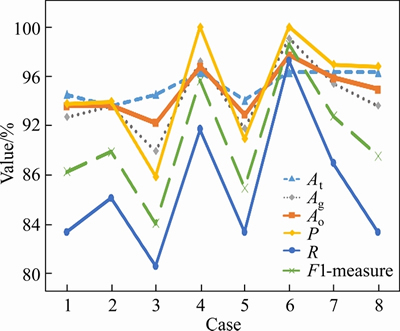
Figure 7 Evaluation indices of classification model
As can be seen from Figure 7, the precision (P) of the eight models is higher than the recall (R), indicating that in all detected transverse cracks, the proportion of accurately detected is higher. However, some real transverse cracks have not been detected successfully.
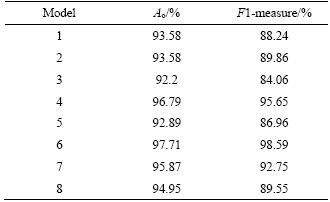
Finally, the overall accuracy (Ao) and F1-measure are selected as the evaluation indices for the classification model, which are listed in Table 7.
According to Table 7, the lowest accuracy and F1-measure of the 8 models is 92.20% and 84.06%, respectively, implying that the selection of feature subsets is reasonable. Model 6 achieves the highest accuracy and F1-measure concurrently, namely 97.71% and 98.59%, leading to the optimal overall performance. Besides, the training accuracy (96.33%) and generalization accuracy (99.08%) are similar, indicating a robust classification model. Finally, the selected feature set in Case 6 includes vehicle speed, range, relative standard deviation, maximum amplitude of FFT, and maximum wavelet coefficient, while the equivalent frequency is discarded. The transverse crack has less influence on the frequency of vibration signal within 4 m, and hence EF may not be a reasonable feature in this case.
Table 7 Comprehensive evaluation indices of classification model
A total of 327 sets of training sets and test sets in model 6 are now used as the new training sets to generate the crack and crack-free binary-classification model. The cross-validation accuracy of new training sets is 96.94%.
5 Experiment validations
To further investigate the feasibility and effectiveness of the crack detection method proposed in this study, the vehicle vibration signals of 7 roads were collected, where 204 transverse cracks exist, and the rest are uncracked pavement. A total of 2292 segments are obtained when the section length is 4 m. Then the corresponding features can be determined, including vehicle speed, range, relative standard deviation, maximum amplitude of FFT, and maximum wavelet coefficient. Based on these features, 2292 test sets were classified by the SVM classification model developed in Section 4.3, and the results are shown in Table 8. The evaluation parameters of the classification results are shown in Table 9.
Table 8 Classification results

Table 9 Test results evaluation of classification model
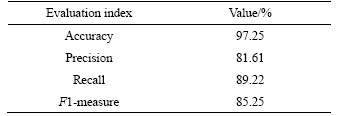
As can be seen from Table 9, the accuracy of the test result is 97.25%, which is desirable. The precision value is relatively low, indicating that some of the uncracked sections are misidentified as cracked sections (FP=41). This may be caused by the presence of debris on the road, such as small stones. FN=22 implies that some cracks are misidentified as non-crack because they are too tiny and the vibration signal shows little difference with the signal of uncracked pavement. In general, Table 9 shows that the proposed method demonstrates robust performance; hence such a method may be used as a fast detection method for transverse cracks in asphalt pavement.
6 Conclusions
In this paper, a novel detection method for the transverse cracking of asphalt pavement through vehicle vibration is proposed. The vehicle vibration response is processed to extract several indicators (features) that may be sensitive to transverse cracking. Then the support vector machine is used to generate the classifier. The optimal parameters of the classifier are determined by the grid search method, and the feature set with the highest overall performance is preferred. Finally, the classification model generated by the optimal feature subset is applied to the 2292-section signal for further validations. The following conclusions can be drawn from this article:
1) By performing FFT on the signal of the cracked and uncracked section, it is found that the frequency distribution is mainly between 0 and 40 Hz. Compared with the uncracked section, the FFT amplitude of the cracked section is larger. The existence of the transverse crack can highlight the wavelet coefficient of 10-20 Hz.
2) 8 SVM classification models were generated by 8 feature subsets, and the overall accuracy and F1-measure are used as the evaluation indices. The crack-sensitive feature subset of vehicle speed, range, relative standard deviation, maximum amplitude of FFT and maximum wavelet coefficient yields optimal model performance.
3) The established SVM model was verified by the vibration signal at 2292 sections on 7 roads. The accuracy and the F1-measure of the classification result is 97.25% and 85.25%, respectively, which demonstrates the effectiveness of the proposed method.
4) Note that the purpose of this paper is not to replace the current cracking detection method like artificial detection and image recognition, but to supplement the existing vibration-based pavement condition detection system. The detection of pavement roughness and other distress can be achieved through previous vibration-based approaches by many studies.
5) When detecting pavement conditions, sections with higher acceleration amplitudes (i.e.>1.5g) may be considered as potholes or bumps. But this is an immature idea and will continue to be studied in our follow-up research. To address the problem of distinguishing transverse cracks from other distresses, applying the existing smartphone-based method may be an effective way. The smartphone-based approach can be used for pavement roughness and obvious distress. The vehicle-based approach proposed in this study can be applied to transverse cracking. Together they can serve as a comprehensive pavement survey system, yet is more cost-effective compared with traditional ones.
The vibration-based detection method of transverse cracks in asphalt pavement through SVM is efficient, effective and economical. This approach shows the possibility of quick and low-cost inspection for pavement transverse cracking in view of large road networks, thus may facilitate a reasonable allocation of the detection resources for transportation agencies. The generated SVM classifier is not universal. Nevertheless, this identification method can apply to different roads if some model parameters are modified accordingly. This paper provides an analytical framework for road distress identification through vehicle vibration signals. Based on this, other pavement distress would be detected through multiple classifiers by support vector machine or neural network in further research. Moreover, a GPS device can be fused with the vibration sensor and motion camera through time-stamps in our future research for accurate localization.
Contributors
YANG Qun provided the concept and edited the draft of manuscript. ZHOU Shi-shi analyzed the measured data and wrote the first draft of the manuscript. WANG Ping conducted the literature review. ZHANG Jun conducted the experiment.
Conflict of interest
YANG Qun, ZHOU Shi-shi, WANG Ping and ZHANG Jun declare that they have no conflict of interest.
References
[1] YANG Qun, DENG Ying-jie. Evaluation of cracking in asphalt pavement with stabilized base course based on statistical pattern recognition [J]. International Journal of Pavement Engineering, 2019, 20(4): 417-424. DOI: 10.1080/10298436.2017.1299528.[LinkOut]
[2] NHAT-DUC H, NGUYEN Q L, TRAN V D. Automatic recognition of asphalt pavement cracks using metaheuristic optimized edge detection algorithms and convolution neural network [J]. Automation in Construction, 2018, 94: 203-213. DOI: 10.1016/j.autcon.2018.07.008.[LinkOut]
[3] MEI Qi-pei, GUL M. A cost effective solution for pavement crack inspection using cameras and deep neural networks [J]. Construction and Building Materials, 2020, 256: 119397. DOI: 10.1016/j.conbuildmat.2020.119397.
[4] INKOOM S, SOBANJO J, BARBU A, NIU Xu-feng. Pavement crack rating using machine learning frameworks: Partitioning, bootstrap forest, boosted trees, na1ve Bayes, and K-nearest neighbors [J]. Journal of Transportation Engineering, Part B: Pavements, 2019, 145(3): 04019031. DOI: 10.1061/jpeodx.0000126.
[5] DU Yu-chuan, LIU Cheng-long, WU Di-fei, LI Si-yu. Application of vehicle mounted accelerometers to measure pavement roughness [J]. International Journal of Distributed Sensor Networks, 2016, 12(6): 8413146. DOI: 10.1155/2016/ 8413146.
[6] SINGH G, BANSAL D, SOFAT S, AGGARWAL N. Smart patrolling: An efficient road surface monitoring using smartphone sensors and crowdsourcing [J]. Pervasive and Mobile Computing, 2017, 40: 71-88. DOI: 10.1016/ j.pmcj.2017.06.002.
[7] YU B X, YU X B. Vibration-based system for pavement condition evaluation [C]//Ninth International Conference on Applications of Advanced Technology in Transportation (AATT). Reston, VA, USA: American Society of Civil Engineers, 2006: 183-189. DOI: 10.1061/40799(213)31.
[8] ERIKSSON J, GIROD L, HULL B, NEWTON R, MADDEN S, BALAKRISHNAN H. The pothole patrol: Using a mobile sensor network for road surface monitoring [C]// Proceeding of the 6th International Conference on Mobile systems, Applications, and Services-MobiSys '08. Breckenridge, CO, USA. New York: ACM Press, 2008. DOI: 10.1145/1378600. 1378605.
[9] PERTTUNEN M, MAZHELIS O, CONG Feng-yu, KAUPPILA M, LEPPANEN T, KANTOLA J, COLLIN J, PIRTTIKANGAS S, HAVERINEN J, RISTANIEMI T, RIEKKI J. Distributed road surface condition monitoring using mobile phones [C]// 8th International Conference on Ubiquitous Intelligence and Computing. UIC Banff, AB, Canada: Springer Verlag, 2011. DOI: 10.1007/978-3-642-23641-9_8.
[10] SATTAR S, LI SONGNIAN, CHAPMAN M. Road surface monitoring using smartphone sensors: A review [J]. Sensors (Basel, Switzerland), 2018, 18(11): E3845. DOI: 10.3390/ s18113845.
[11] BUTTLAT W G, ALAVI A, BROWN H, SILLS H, MESA A, OKENFUSS E. Pavement roughness measurement using android smartphones: Case study of Missouri roads and airports [R]. Rep. CMR18-010. Jefferson City, MO: Missouri DOT. 2018.
[12] HARIKRISHNAN P M, GOPI V P. Vehicle vibration signal processing for road surface monitoring [J]. IEEE Sensors Journal, 2017, 17(16): 5192-5197. DOI: 10.1109/JSEN.2017. 2719865.
[13] WANG Hsiu-wen, CHEN Chi-hua, CHENG Ding-yuan, LIN Chun-hao, LO Chi-chun. A real-time pothole detection approach for intelligent transportation system [J]. Mathematical Problems in Engineering, 2015: 869627. DOI: 10.1155/2015/ 869627.
[14] MELHEM H, KIM H. Damage detection in concrete by Fourier and wavelet analyses [J]. Journal of Engineering Mechanics, 2003, 129(5): 571-577. DOI: 10.1061/(asce) 0733-9399(2003)129: 5(571).
[15] PAWAR P M, VENKATESULU REDDY K, GANGULI R. Damage detection in beams using spatial Fourier analysis and neural networks [J]. Journal of Intelligent Material Systems and Structures, 2007, 18(4): 347-359. DOI: 10.1177/ 1045389x06066292.
[16] GUO Hua-ping, DIAO Xiao-yu, LIU Hong-bing. Embedding undersampling rotation forest for imbalanced problem [J]. Computational Intelligence and Neuroscience, 2018: 1-15. DOI: 10.1155/2018/6798042.
[17] CHEN Bing-quan, CUI Jin-ge, XU Qing, SHU Ting, LIU Hong-li. Coupling denoising algorithm based on discrete wavelet transform and modified median filter for medical image [J]. Journal of Central South University, 2019, 26(1): 120-131. DOI: 10.1007/s11771-019-3987-9.
[18] GHANIZADEH A R, FAKHRI M. Quasi-static analysis of flexible pavements based on predicted frequencies using fast fourier transform and artificial neural network [J]. International Journal of Pavement Research and Technology, 2018, 11(1): 47-57. DOI: 10.1016/j.ijprt.2017.09.002.
[19] ADDISON P S. The illustrated wavelet transform handbook: introductory theory and applications in science, engineering, medicine and finance [M]. Edinburgh, UK: Institute of Physics Publishing. 2002.
[20] YING Yu-jie, GARRETT J H Jr, OPPENHEIM I J, SOIBELMAN L, HARLEY J B, SHI Jun, JIN Yuan-wei. Toward data-driven structural health monitoring: Application of machine learning and signal processing to damage detection [J]. Journal of Computing in Civil Engineering, 2013, 27(6): 667-680. DOI: 10.1061/(asce)cp.1943-5487. 0000258.
[21] LI Zhong-mei, GUI Wei-hua, ZHU Jian-yong. Fault detection in flotation processes based on deep learning and support vector machine [J]. Journal of Central South University, 2019, 26(9): 2504-2515. DOI: 10.1007/s11771-019-4190-8.
[22] KARTHIKEYAN R, ALLI P. Feature selection and parameters optimization of support vector machines based on hybrid glowworm swarm optimization for classification of diabetic retinopathy [J]. Journal of Medical Systems, 2018, 42(10): 1-11. DOI: 10.1007/s10916-018-1055-x.
[23] ZHANG Yan-yi, LI Rui. Selection of the parameter in Gaussian kernels in support vector machine [C]//2017 IEEE 2nd International Conference on Cloud Computing and Big Data Analysis (ICCCBDA). Chengdu, China: IEEE, 2017: 430-433. DOI: 10.1109/ICCCBDA.2017. 7951952.
[24] ELBISY M S. Support vector machine and regression analysis to predict the field hydraulic conductivity of sandy soil [J]. KSCE Journal of Civil Engineering, 2015, 19(7): 2307-2316. DOI: 10.1007/s12205-015-0210-x.
(Edited by HE Yun-bin)
���ĵ���
�źŴ�����֧��������������·�������е�Ӧ��
ժҪ��������·��״�����Ӧ��Խ��Խ�㷺��Ȼ������������עƽ���ȼ������쳣��ȱ����Բ������ĺ����ѷ���о�����ˣ����Ľ����źŴ���������֧��������(SVM)�����һ����ӱ�Ļ��ڳ����ĺ����ѷ�ʶ�����Ժ�����·�κ����ѷ�·�εij������ź���ʱ��Ƶ���С��������˷�����ּ���ҵ���������·�濪���������źŲ�������Щ�������γ���8��SVM����ģ�ͣ������������ȷ�Ⱥ�F1�����ķ���ģ�ͣ���ģ�Ϳ��ǵ������������������ٶȡ����ٶȼ����Ա�������Ҷϵ����С��ϵ�����ݴ˽�����һ������-δ���ѵķ�������Ȼ����2292��·����Ӧ���˸÷������������ʾ��ʶ��ȷ�Ⱥ�F1�����ֱ�Ϊ97.25%��85.25%����������ĺ��ʶ�������еĻ��������ֻ�ʶ��IRI������·�没���ķ������γ�һ���ۺ�·��״��ʶ��ϵͳ��
�ؼ��ʣ�����·�棻�����ѷ�ʶ�𣻳�����֧��������������ģ��
Foundation item: Project(51778482) supported by the National Natural Science Foundation of China
Received date: 2020-07-29; Accepted date: 2021-04-06
Corresponding author: ZHOU Shi-shi, PhD candidate; Tel: +86-18019160056; E-mail: 1710932@tongji.edu.cn; ORCID: 0000-0001-9195-5686
Abstract: Vibration-based pavement condition (roughness and obvious anomalies) monitoring has been expanding in road engineering. However, the indistinctive transverse cracking has hardly been considered. Therefore, a vehicle-based novel method is proposed for detecting the transverse cracking through signal processing techniques and support vector machine (SVM). The vibration signals of the car traveling on the transverse-cracked and the crack-free sections were subjected to signal processing in time domain, frequency domain and wavelet domain, aiming to find indices that can discriminate vibration signal between the cracked and uncracked section. These indices were used to form 8 SVM models. The model with the highest accuracy and F1-measure was preferred, consisting of features including vehicle speed, range, relative standard deviation, maximum Fourier coefficient, and wavelet coefficient. Therefore, a crack and crack-free classifier was developed. Then its feasibility was investigated by 2292 pavement sections. The detection accuracy and F1-measure are 97.25% and 85.25%, respectively. The cracking detection approach proposed in this paper and the smartphone-based detection method for IRI and other distress may form a comprehensive pavement condition survey system.
