

Quantitative calculation of local shear deformation in adiabatic shear band for Ti-6Al-4V
WANG Xue-bin(��ѧ��)
Department of Mechanics and Engineering Science, Liaoning Technical University, Fuxin 123000, China
Received 13 October 2006; accepted 31 December 2006
Abstract:
JOHNSON-COOK(J-C) model was used to calculate flow shear stress��shear strain curve for Ti-6Al-4V in dynamic torsion test. The predicted curve was compared with experimental result. Gradient-dependent plasticity(GDP) was introduced into J-C model and GDP was involved in the measured flow shear stress��shear strain curve, respectively, to calculate the distribution of local total shear deformation(LTSD) in adiabatic shear band(ASB). The predicted LTSDs at different flow shear stresses were compared with experimental measurements. J-C model can well predict the flow shear stress��shear strain curve in strain-hardening stage and in strain-softening stage where flow shear stress slowly decreases. Beyond the occurrence of ASB, with a decrease of flow shear stress, the increase of local plastic shear deformation in ASB is faster than the decrease of elastic shear deformation, leading to more and more apparent shear localization. According to the measured flow shear stress��shear strain curve and GDP, the calculated LTSDs in ASB are lower than experimental results. At earlier stage of ASB, though J-C model overestimates the flow shear stress at the same shear strain, the model can reasonably assess the LTSDs in ASB. According to the measured flow shear stress��shear strain curve and GDP, the calculated local plastic shear strains in ASB agree with experimental results except for the vicinity of shear fracture surface. In the strain-softening stage where flow shear stress sharply decreases, J-C model cannot be used. When flow shear stress decreases to a certain value, shear fracture takes place so that GDP cannot be used.
Key words:
adiabatic shear band; Ti-6Al-4V; shear localization; JOHNSON-COOK model; shear stress; shear strain; gradient- dependent plasticity;
1 Introduction
Many of experimental investigations on the localized shear deformation in adiabatic shear band (ASB) rely on the post-mortem examination of specimens after subjecting them to loading at high strain rates[1-8]. Because the duration of the deformation process is very short and the instant of ASB initiation depends on numerous factors including material properties, loading condition and the magnitude of preexisting defects in the specimen, the observations of the localized shear deformation in ASB are difficult [9-10]. High speed photography was used to measure the local strain during the deformation process for Ti-6Al-4V specimens deformed dynamically in a torsional split Hopkinson bar[2]. The measured flow shear stress��shear strain curve can be divided into four stages: linearly elastic stage, strain-hardening stage, strain softening stage, in which flow shear stress slowly decreases, and strain softening stage, in which flow shear stress rapidly decreases, as seen in Fig.1(g). The plastic straining process might be divided into three consecutive stages[2]. In the first stage, the homogeneous deformation is observed; in the second one, the deformation is inhomogeneous, as seen in Figs.1(a)-(e); in the third stage, the distributions of strain and deformation across ASB are discontinuous, as seen in Fig.1(f), indicating the formation of a shear fracture.

Fig.1 Complete failure process for Ti-6Al-4V specimen using high-speed photography (a)-(f) and measured shear stress��shear strain curve (g) in dynamic torsion test [2]
On the aspect of theoretical analysis, using linear strain-softening constitutive relation and second-order gradient-dependent plasticity(GDP)[11-12], where an internal length parameter was included in the yield function to describe the interactions and interplay among microstructures in ductile metals, Wang and coworkers studied the distributions of local shear strain[13-14], local shear deformation[13-14], local temperature rise [15] and local damage variable [16] in ASB.
Considering the effects of strain-hardening, strain- rate sensitivity, thermal-softening and microstructures, JOHNSON-COOK(J-C) model and second-order GDP were used to calculate the distributions and evolutions of the local plastic shear strain and deformation in ASB for steel [17], the local temperature rise and its evolution in ASB for Ti-6Al-4V at different strain rates [18], the thickness and evolution of transformation ASB for Ti-6Al-4V at different strain rates [19].
ZERILLI-ARMSTRONG model based on the framework of thermally activated dislocation motion and second-order GDP were adopted to investigate the effect of initial temperature on the distributions of the local plastic shear strain and deformation in ASB for Al-Li alloy[20].
In the present paper, J-C model was used to calculate flow shear stress��shear strain curve for Ti-6Al-4V in dynamic torsion test and the result was compared with the previous experimental result[2]. GDP is introduced into J-C model and the measured flow shear stress��shear strain curve, respectively, to calculate the distribution of local total shear deformation(LTSD) in ASB. The theoretical results were compared with the previously experimental measurements [2]. The applicability of J-C model was discussed through examples.
2 J-C model and onset of ASB[17-18, 21- 22]
In J-C Model, the flow shear stress �� and the temperature T are
 (1)
(1)
![]() (2)
(2)
where ![]() is the average plastic shear strain;
is the average plastic shear strain; ![]() is the reference shear strain rate;
is the reference shear strain rate; ![]() is the imposed shear strain rate; T0 is the initial temperature; Tm is the melting temperature; �� is the work to heat conversion factor; cp is the heat capacity; �� is the density; A, B, C, m and n are static shear strength, strain-hardening modulus, strain rate sensitive coefficient, thermal-softening exponent and strain-hardening exponent, respectively.
is the imposed shear strain rate; T0 is the initial temperature; Tm is the melting temperature; �� is the work to heat conversion factor; cp is the heat capacity; �� is the density; A, B, C, m and n are static shear strength, strain-hardening modulus, strain rate sensitive coefficient, thermal-softening exponent and strain-hardening exponent, respectively.
The occurrence of ASB is usually attributed to the thermal-plastic shear instability. The thermal softening is due to the fact that the dissipation of part of the mechanical work just overcomes the strain-hardening effect. Therefore, the condition for the onset of ASB is
d��=0 (3)
3 Distribution of local plastic shear deforma- tion in ASB based on GDP [17-18]
ASB is considered to be a one-dimensional simple shearing problem and has a finite thickness or width w, as seen in Fig.2, whereas it is infinite in the shear direction and in the out-off plane direction. At the top and base of ASB, the flow shear stress �� is uniform.

Fig.2 ASB subjected to shear stress and coordinate transforma- tion
The thickness w of ASB and the distribution ��p(y) of local plastic shear strain in ASB are derived as follows:
![]() (4)
(4)
![]() (5)
(5)
where l is an internal length parameter reflecting the heterogeneous extent of ductile metal material; y is the coordinate whose original point O is set at the center of ASB; ![]() is the plastic shear strain corresponding to the maximum flow shear stress, which is called critical plastic shear strain.
is the plastic shear strain corresponding to the maximum flow shear stress, which is called critical plastic shear strain.
Integrating Eqn.(5) with respect to the coordinate y leads to the local plastic shear deformation sp(y) in ASB:
![]() (6)
(6)
4 Distribution of LTSD in ASB and co- ordinate transformation
In Eqn.(1), ![]() can be expressed as
can be expressed as
![]() (7)
(7)
where G is the shear elastic modulus; ![]() is the elastic shear strain; �� is the average total shear strain.
is the elastic shear strain; �� is the average total shear strain.
In Eqn.(6), ![]() can be written as
can be written as
![]() (8)
(8)
where �� c is the critical shear strain. It is the shear strain corresponding to the maximum flow shear stress ��max.
If the parameters in Eqns.(1), (2) and (6) are known, then we can obtain the numerical flow shear stress��shear strain curve and the critical plastic shear strain ![]() . Thus, we can assess the distribution sp(y) of the local plastic shear deformation in ASB using J-C model and GDP.
. Thus, we can assess the distribution sp(y) of the local plastic shear deformation in ASB using J-C model and GDP.
The distribution s(y) of LTSD in ASB can be expressed as
![]() (9)
(9)
where se(y) is the distribution of elastic shear deformation in ASB:
![]() (10)
(10)
The critical plastic shear strain ![]() can also be obtained directly from the measured flow shear stress��shear strain curve. Thus, the distribution sp(y) in ASB can be obtained according to the measured flow shear stress��shear strain curve and GDP.
can also be obtained directly from the measured flow shear stress��shear strain curve. Thus, the distribution sp(y) in ASB can be obtained according to the measured flow shear stress��shear strain curve and GDP.
In this paper, we introduce the following coordinate transformation:
![]() (11)
(11)
![]() (12)
(12)
where ![]() . Thus, when y1=0, s1(0)=0; when y1=
. Thus, when y1=0, s1(0)=0; when y1=![]() ,
, ![]() =
=![]() ; when y1=w, s1(w)=
; when y1=w, s1(w)=![]() =�� w.
=�� w.
5 Numerical results and discussion 5.1 Predicted and experimental flow shear stress��shear strain curves
Fig.3 shows a comparison of the experimental result of flow shear stress��shear strain curve for Ti-6Al-4V in dynamic torsion experiment[2] and the predicted result by use of J-C model. In J-C model, we select the following parameters: A=263 MPa, B=268 MPa, C=0.048 8, m=0.5, n=0.19, Tm=1 932 K, ��=4 430 kg/m3, T0=300 K, ![]() = 10-5 s-1, cp=564 J/(kg?K),
= 10-5 s-1, cp=564 J/(kg?K), ![]() =1 100 s-1 and ��=0.9.
=1 100 s-1 and ��=0.9.
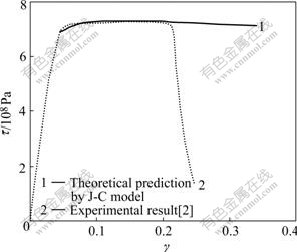
Fig.3 Comparison of experimental result [2] and theoretical prediction of flow shear stress��average shear strain curve for Ti-6Al-4V
J-C model is an empirical viscoplastic constitutive relation. It cannot predict the shear stress��shear strain curve in linear elastic stage. In this stage, the linearly elastic shear Hooke��s law is adopted. Moreover, the shear elastic modulus remains a constant: G=17 GPa. It is noted that in strain-hardening and strain-softening stages, the ratio of flow shear stress to elastic shear strain is always equal to that in elastic stage.
It is found from Fig.3 that J-C model can well predict the flow shear stress��shear strain curve for Ti-6Al-4V in strain-hardening stage and in strain- softening stage, where flow shear stress is slowly decreased.
In the fourth stage (in which flow shear stress rapidly decreases), J-C model cannot be used to approximate the experimental result. The predicted flow shear stress��shear strain curve is much more ductile, while the experimental measurement is much steeper. This means that J-C model can well describe the behavior of metal material in the earlier stage (higher flow shear stress) of ASB. In the later stage of ASB, J-C model is not applicable to the assessment of the behavior of metal material.
In the present J-C model, ��max=729 MPa, ��c=0.137 and ![]() =0.094. In the experimental test, ��max=728 MPa, ��c=0.143 and
=0.094. In the experimental test, ��max=728 MPa, ��c=0.143 and ![]() =0.1. Therefore, J-C model can well predict the values of ��max,
=0.1. Therefore, J-C model can well predict the values of ��max, ![]() and ��c.
and ��c.
5.2 Distributions of local plastic and total shear deformation in ASB
Fig.4 shows the predicted distributions of the local plastic and total shear deformation in ASB at different flow shear stresses. The predicted results are obtained through incorporating GDP in J-C model. Herein, we use the following parameters: ![]() =0.1, G=17 GPa and l=342 ?m.
=0.1, G=17 GPa and l=342 ?m.

Fig.4 Calculated local plastic shear deformation (a) and LTSD (b) in ASB at different flow shear stresses according to measured flow shear stress��average shear strain curve for Ti-6Al-4V and GDP
The curves 1-6 in Fig.4 correspond to the positions 1-6 in Figs.1(a)-(f), respectively. That is to say, the flow shear stress at the positions 1-6 are equal to 726, 725, 723, 716, 565 and 250 MPa, respectively.
The distributions s(y) of LTSD in ASB includes the distribution se(y) of the elastic shear deformation and the distribution sp(y) of the local plastic shear deformation, as seen in Eqn.(9). When flow shear stress slowly decreases from 726 MPa to 716 MPa, se(y) has no apparent change, while when it sharply decreases from 716 MPa to 250 MPa, the change in se(y) is more apparent.
It is found from Fig.4(a) that as flow shear stress decreases, the nonlinear distribution of sp(y) becomes more and more apparent and the relative plastic shear deformation between the top and base of ASB increases.
Fig.4(b) shows that with the decrease of flow shear stress, the nonlinear extent of s(y) becomes more and more apparent and the relative total shear deformation between the top and base of ASB increases.
The value of se(y) decreases and the value of s(y) increases as flow shear stress decreases, as seen in Eqn.(10) and Fig.4. Hence, in the process of decreasing flow shear stress, the increase of sp(y) is faster than the decrease of se(y).
5.3 Experimental and predicted LTSDs in ASB
Figs.5(a)-(d) show a comparison of the three kinds of results of LTSD in ASB. One is the experimental data [2] taken from the white points in Figs.1(a)-(f). The other two results are the predicted results according to the measured flow shear stress��shear strain curve and GDP with ![]() =0.1, G=17 GPa and l=342 ?m and the predicted results according to J-C model and GDP with
=0.1, G=17 GPa and l=342 ?m and the predicted results according to J-C model and GDP with ![]() =0.094, G=17 GPa and l=342 ?m. The values of the parameters in J-C model are identical to the values in Section 5.1.
=0.094, G=17 GPa and l=342 ?m. The values of the parameters in J-C model are identical to the values in Section 5.1.

Fig.5 Comparison of three kinds of results of LTSD in ASB for Ti-6Al-4V at different flow shear stresses: (a) ��=726 MPa; (b) ��=725 MPa; (c) ��=723 MPa; (d) ��=716 MPa; (e) ��=565 MPa; (f) ��=250 MPa
Figs.5(e)-(f) show a comparison of the results of LTSD in ASB according to the measured flow shear stress��shear strain curve and GDP with ![]() =0.1, G= 17 GPa and l=342 ?m and the experimental results[2] in the fourth stage of the shear stress��shear strain curve. In the stage, the flow shear stress drops suddenly and J-C model cannot accurately assess the flow shear stress��shear strain curve. In the stage, if J-C model is adopted, then the shear strain will be overestimated at the same flow shear stress, leading to an overestimation of LTSD in ASB.
=0.1, G= 17 GPa and l=342 ?m and the experimental results[2] in the fourth stage of the shear stress��shear strain curve. In the stage, the flow shear stress drops suddenly and J-C model cannot accurately assess the flow shear stress��shear strain curve. In the stage, if J-C model is adopted, then the shear strain will be overestimated at the same flow shear stress, leading to an overestimation of LTSD in ASB.
In Figs.5(a)-(c), the predicted LTSDs in ASB using J-C model and GDP are consistent with the experimental results. However, the predicted LTSDs in ASB using the measured flow shear stress��shear strain curve and GDP are lower than the experimental results.
In fact, when flow shear stress slowly drops from 726 MPa to 716 MPa, J-C model predicts a higher flow shear stress than the experimental measurement at the same shear strain. That is to say, the predicted flow shear stress��shear strain curve using J-C model in the later stage of the third stage is more ductile. Thus, at the same flow shear stress, shear strain will be overestimated.
It can be found from Fig.5(d) that when flow shear stress drops to 716 MPa, the predicted LTSD in ASB using J-C model and GDP exceeds the experimental result.
It is interesting to note that though shear strain is overestimated at the same flow shear stress, when flow shear stress drops slowly from 726 MPa to 723 MPa, the predicted LTSDs in ASB are still in agreement with the experimental results, as seen in Figs.5(a)-(c).
The predicted LTSDs in ASB using the measured flow shear stress��shear strain curve and GDP are always lower than the experimental results, as seen in Figs.5(a)- (f). This means that the present model should be further modified in the future investigations. The possible factors that need to be taken into account are damage and/or higher-order plastic shear strain gradients (such as the fourth-order gradient).
Fig.1(f) shows that when flow shear stress drops to 250 MPa, a shear fracture surface within ASB can be observed. Hence, the distributions of the local strain and deformation across ASB are discontinuous. When the Ti-6Al-4V specimen is fractured, the measured LTSDs in ASB are greatly higher than the predicted results using the measured flow shear stress��shear strain curve and GDP. For example, in Fig.5(f), the difference between the measured result and predicted one at the top of ASB approaches 200 ?m.
Though the predicted LTSDs in ASB using the measured flow shear stress��shear strain curve and GDP are lower than the measured values, the two kinds of results of the local shear strain (?s1(y1)/?y1) have no apparent difference above the shear fracture surface and below. Except for the vicinity of the fracture surface, the measured LTSDs are quantitatively consistent with the calculated values below the fracture surface. Above the surface, the measured LTSD profiles are parallel to the calculated results.
6 Conclusions
1) J-C model can well predict the flow shear stress��shear strain curve for Ti-6Al-4V in strain- hardening stage and in strain-softening stage, where flow shear stress slowly decreases.
2) Beyond the occurrence of ASB, with a decrease of flow shear stress, the increase of local plastic shear deformation in ASB is faster than the decrease of elastic shear deformation, leading to more and more apparent shear localization.
3) According to the measured flow shear stress��shear strain curve for Ti-6Al-4V and GDP, the calculated LTSDs in ASB are lower than experimental results. This means that several factors should be considered in the future investigations, such as damage and/or much higher-order plastic shear strain gradients.
4) At earlier stage of ASB in Ti-6Al-4V, though J-C model overestimates the flow shear stress at the same shear strain, the model can reasonably assess LTSDs in ASB.
5) According to the measured flow shear stress��shear strain curve for Ti-6Al-4V and GDP, the calculated local plastic shear strains in ASB agree with experimental results except for the vicinity of shear fracture surface.
6) In the strain-softening stage, where flow shear stress sharply decreases, J-C model cannot be used. When flow shear stress decreases to a certain value, shear fracture surface is observed so that GDP cannot be used since the distributions of strain and deformation across ASB are no longer continuous.
References
[1] BAI Y, BODD B. Adiabatic shear localization, occurrence, theories and applications [M]. Oxford: Pergamon Press, 1992.
[2] LIAO S C, DUFFY J. Adiabatic shear bands in a Ti-6Al-4V titanium alloy [J]. J Mech Phys Solids, 1998, 46(11): 2201-2231.
[3] TIMOTHY S P, HUTCHINGS I M. The structure of adiabatic shear bands in a titanium alloy [J]. Acta Metall, 1985, 33(4): 667-676.
[4] YANG Yang, XIONG Jun, YANG Xu-yue. Microstructure evolution mechanism in adiabatic shear band in TA2 [J]. Trans Nonferrous Met Soc China, 2004, 14(4): 670-674.
[5] BAYOUMI A E, XIE J Q. Some metallurgical aspects of chip formation in cutting Ti-6Al-4V alloy [J]. Mater Sci Eng A, 1995, 190(1/2): 173-180.
[6] ME-BAR Y, SHECHTMAN D. On the adiabatic shear of Ti-6Al-4V ballistic targets [J]. Mat Sci Eng, 1983, 58(2): 181-188.
[7] MOLINARI A, MUSQUAR C, SUTTER G. Adiabatic shear banding in high speed machining of Ti-6Al-4V: Experiments and modeling [J]. Int J Plast, 2002, 18(4): 443-459.
[8] XUE Q, MEYERS M A, NESTERENKO V F. Self-organization of shear bands in titanium and Ti-6Al-4V alloy [J]. Acta Mat, 2002, 50(3): 575-596.
[9] CLIFTON R J, DUFFY J, HARTEY K A, SHAWKI T G. On critical conditions for shear band formation at high strain rates [J]. Scripta Metall, 1984, 18(5): 443-448.
[10] GIOVANOLA J H. Adiabatic shear banding under pure shear loading(I): Direct observation of strain localization and energy dissipation measurements [J]. Mech Mat, 1988, 7(1): 59-72.
[11] DE BORST R, M?HLHAUS H B. Gradient-dependent plasticity: Formulation and algorithmic aspects [J]. Int J Numer Methods Eng, 1992, 35(3): 521-539.
[12] ASKES H, PAMIN J, DE BORST R. Dispersion analysis and element-free Galerkin solutions of second- and fourth-order gradient-enhanced damage models [J]. Int J Numer Methods Eng, 2000, 49(6): 811-832.
[13] WANG Xue-bin, DAI Shu-hong, HAI Long, PAN Yi-shan. Analysis of localized shear deformation of ductile metal based on gradient-dependent plasticity [J]. Trans Nonferrous Met Soc China, 2003, 13(6): 1348-1353.
[14] WANG Xue-bin, YANG Mei, YU Hai-jun, HAI Long, PAN Yi-shan. Localized shear deformation during shear band propagation in titanium considering interactions among microstructures [J]. Trans Nonferrous Met Soc China, 2004, 14(2): 335-339.
[15] WANG Xue-bin. Calculation of temperature distribution in adiabatic shear band based on gradient-dependent plasticity [J]. Trans Nonferrous Met Soc China, 2004, 14(6): 1062-1067.
[16] WANG Xue-bin. Analysis of damage localization for ductile metal in the process of shear band propagation [J]. Trans Nonferrous Met Soc China, 2006,16(1): 153-158.
[17] WANG Xue-bin. Adiabatic shear localization evolution for steel based on Johnson-Cook model and gradient-dependent plasticity [J]. J Univ Sci Technol Beijing, 2006, 13(4): 313-318.
[18] WANG Xue-bin. Temperature distribution in adiabatic shear band for ductile metal based on Johnson-Cook and gradient plasticity models [J]. Trans Nonferrous Met Soc China, 2006, 16(2): 333-338.
[19] WANG Xue-bin. Evolution of thickness of phase transformed adiabatic shear band for Ti-6Al-4V based on gradient-dependent plasticity [J]. Rare Met Mat Eng, 2006, 35(Suppl): 123-126.
[20] WANG X B. Temperature-dependent shear strain localization of aluminum-lithium alloy in uniaxial compression using Zerilli-Armstrong and gradient plasticity models [J]. Mat Sci Forum, 2006, 519/521: 789-794.
[21] DARIDON L, OUSSOUADDI O, AHZO S. Influence of the material constitutive models on the adiabatic shear band spacing: MTS, power law and Johnson-Cook models [J]. Int J Solids Struct, 2004, 41(11/12): 3109-3124.
[22] DILELLIO J A, OLMSTEAD W E. Numerical solution of shear localization in Johnson-Cook materials [J]. Mech Mat, 2003, 35(3/6): 571-580.
Foundation item: Project(2004F052) supported by the Educational Department of Liaoning Province, China
Corresponding author: WANG Xue-bin; Tel: +86-418-3351351; E-mail: wxbbb@263.net
