

J. Cent. South Univ. (2018) 25: 1786-1798
DOI: https://doi.org/10.1007/s11771-018-3869-6

Key factor analysis and model establishment of variation of rock face temperature in a deep open-pit mine
WANG Yuan(��Զ)1, 2, DU Cui-feng(�Ŵ��)1, 2, JIN Wen-bo(���IJ�)1, 2, WANG Pu-yu(������)1, 2
1. School of Civil and Resources Engineering, University of Science and Technology Beijing,Beijing 100083, China;
2. Key Laboratory of Ministry of Education for Efficient Mining and Safety of Metal Mine,University of Science and Technology Beijing, Beijing 100083, China
 Central South University Press and Springer-Verlag GmbH Germany, part of Springer Nature 2018
Abstract:
In recent years, with the increase of the depth of open-pit mining, the pollution level has been on the rise due to harmful gases and dust occurring in the process of mining. In order to accelerate the diffusion of these air pollutants, the distributed regularity of the rock face temperature which is directly related to the air ventilation in deep open-pit mines should be studied. Here, we establish the key factors influencing the rock face temperature in a deep open-pit mine. We also present an empirical model of the rock face temperature variation in the deep open-pit mine, of which the performance is interestingly high compared with that of the field test. This study lays a foundation to study the ventilation thermodynamic theory in the deep open-pit mine, which is of great importance for theoretical studies and engineering applications of solving air pollution problem in deep open-pit mines.
Key words:
Cite this article as:
WANG Yuan, DU Cui-feng, JIN Wen-bo, WANG Pu-yu. Key factor analysis and model establishment of variation of rock face temperature in a deep open-pit mine [J]. Journal of Central South University, 2018, 25(7): 1786-1798.
DOI:https://dx.doi.org/https://doi.org/10.1007/s11771-018-3869-61 Introduction
In recent years, with the increase of the depth of open-pit mining, the pollution level has been on the rise due to harmful gases and dust occurring in the process of mining [1�C3]. These pollutants not only endanger the safety and health of the miners, but also bring great economic losses to the mine for production halt due to low visibility [4�C6].
NIKITIN et al [7] thought the natural ventilation of the open-pit mine is imple mented by means of two natural powers, that is, heat and wind. During the day, the heat plays a leading role as the wind speed is small. The rock face gets heat from solar radiation and then changes its temperature. The temperature of the surrounding air will be warmed by the rock face due to heat convection mechanism. As a result, a temperature difference and airflow will be generated between the rock face and the air, which will help the diffusion of the pollutants in the mine [8].
On the cloudless night, it is easy to form the inversion layer with the effective radiation reducing dramatically. The inversion layer will hinder the vertical movement of airflow below, thus inhibit the spread of air pollution and water vapor condensation. Therefore, the study of the theoretical model and the regularity of the variation of rock face temperature especially in a deep open-pit mine can be of great significance in optimizing working environment, ensuring safety in production and enhancing productivity.
On the other hand, the stability of the open-pit slope is a prerequisite for ensuring the normal production of the mine [9]. Once landslide accident happens, it will cause great casualties and property losses [10, 11]. The stability of open-pit slope is affected by many factors, such as geological structure, rock-texture, blasting vibration, natural weathering, climatic conditions and so on [12, 13]. The change of rock face temperature in open-pit mines also affects the stability of slope. When the temperature distribution of the rock face is uneven, the open-pit slope is unstable due to uneven distribution of stress.
Taking a certain deep open-pit mine for experiment, the rock face temperatures were measured at several typical positions. In this study, the changing rules of the rock face temperature have been revealed, and possible factors to account for them were also analyzed. In combination with dimensional analysis method and multivariate nonlinear regression analysis method, an empirical model of the rock face temperature variation in the deep open-pit mine was developed, which fitted well with the field test. This temperature field theory can not only lay a theoretical foundation for the air pollution prevention in deep open-pit mines, such as the diffusion and settlement of the dust, but also do good for accurate evaluation of the quality of the atmosphere in the mines. All in all, the study will provide security for the production and the worker health.
2 Methods
2.1 Distribution of measured points and testing methods
The mine used in the experiment is mainly consisted with gneiss, which is located in Qian��an City, Hebei Province, at 118��32��C118��36��E east longitude and 40��6��C40��8��N north latitude, with the geological structure belonging to the subsidence zone of Yanshan Montain (Hebei Province, China). The mine is rich in coal, and famous for its splendid reserve, expensive distribution, shallow embedding and easy exploitation. The area locates at the warm temperate zone half moist monsoon climatic region. And the dominant wind direction throughout the year is northwest.
The entire mining area runs slightly from the southwest to northeast with �C184 m currently mining depth, whose long axis of south-to-northeast direction is 3395 m, and the longest vertical axis of south-to-northwest direction is 1318 m. The elevation of contourline passing the lowest point of topage in final pitlimit is 80 m. The bench heights of the mine is 15 m above elevation 190 m and below elevation 10 m, and 12 m from elevation 190 m to elevation 10 m (among them the bench height is 14 m from elevation 152 m to elevation 166 m, and 10 m from elevation 33 m to elevation 44 m). The angle of open-pit overall slope is 41��C46�� and the angle of bench slope is 75��. The field experiments were implemented from April 20 to 23, 2015. The continuous changes of the rock face temperature, the air temperature, the air relative humidity and the wind speed at four typical positions of the mine��s inside rock face.
Under the premise of ensuring mine production and testers��safety, we selected four points in four different directions of the mine. The four points were named No. 1, No. 2, No. 3 and No. 4, of which the absolute altitude were �C88 m, �C88 m, �C77 m and �C77 m, respectively, as shown in Figure 1. At each point, a Puxicoo RC-4 temperature recorder was used to measure the rock face temperature. At the same time, a Taiwan Hengxin AZ9671 apparatus which could simultaneously record wind, temperature and humidity of the ambient air was used in the normal direction of the surface of each measured point.
We also put the Puxicoo RC-4 temperature recorder in the mine command center with the absolute altitude of 0 m to measure the temperature of the local atmosphere outside the deep open-pit mine, which was named point No. 5. The recording time intervals were set to be 2 min, and the measuring time circle was set continuously to be 24 h.

Figure 1 Measuring point distribution
2.2 Parameters selection of temperature model
According to the thermal conduction theory, thermal radiation, thermal conduction and thermal convection are the three basic modes of heat transfer. Actually, these three basic modes would be affected firstly and essentially by the natural environment. Therefore, the key factors influencing the variation of the rock face temperature are in fact the factors that the natural environment influencing the thermal radiation, thermal conduction and thermal convection. The rock face temperature is affected by various natural factors due to long time exposing in air, which is vividly shown in Figure 2.

Figure 2 A schematic diagram showing influence of natural factors on rock face temperature
First, when the solar radiation reaches the rock face, most of the solar energy is absorbed by rocks and translated into heat, and the rest energy is reflected to the air. The proportion of absorption to reflection of the solar radiation energy is affected by several factors such as the clouds, the features of the rock face, the rain or the snow. Second, the difference of temperatures between the rock face and the air will also lead to heat transfer thanks to the thermal conduction and the thermal convection on the surface in contact with the rock face and the atmosphere. This heat transfer can be affected deeply by the wind.
The difference between the rock face radiation and atmospheric counter radiation is called the rock face effective radiation, which is affected by the tempera tures of the rock face and the surrounding air, the relative humidity of the atmosphere, and the condition of the clouds.
2.2.1 Thermal radiation
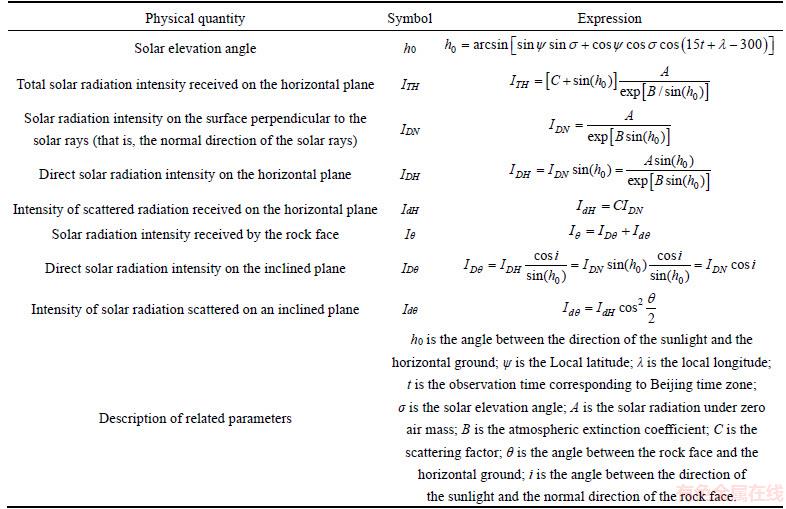
For the iron mine, the rock face obtains heat mainly through solar radiation, which is one of the factors that affect rock temperature. The rock face in the open-pit mine is usually inclined with respect to the horizontal ground (see Figure 3). The intensity of scattered radiation and direct solar radiation on the rock face could be deduced according to the solar radiation intensity obtained from the horizontal ground, as shown in Table 1 [14�C19]. The thermal radiation discussed below generally refers to the total solar radiation received on the slope plane of the rock face.
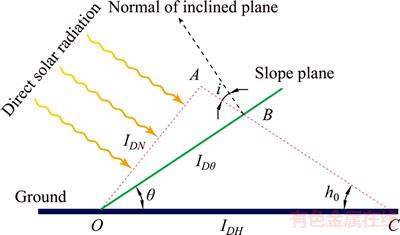
Figure 3 Calculation diagram of intensity of solar radiation on a slope surface
2.2.2 Thermal conduction
Thermal conduction follows the Fourier law:
 (1)
(1)
where q is the density of heat flux, W/m2; T is the thermodynamic temperature, K; x is the normal coordinate on the isothermal surface, m; �� is the thermal conductivity��W/(m��K), which is related to the type of material and the temperature. For the rock in a certain thermal conductivity, the main factor affecting the heat transfer is the temperature difference between the atmosphere and the rock face. Therefore, the atmospheric temperature is one of the factors that influence the rock face temperature [20�C22].
2.2.3 Thermal convection
The rock face exposed to the atmospheric environment is in contact with the atmosphere directly. A convective heat transfer system is formed between the atmosphere and the rock face. The density of heat flux due to the thermal convection follows the Newton cooling formula:
Table 1 Related physical quantities with respect to intensity of solar radiation on slope rock face
 (2)
(2)
where tw and tf are, respectively, the temperature of the rock face and the fluid (wind), K; h is the convective heat transfer coefficient, W/(m2��K), which plays an important role in the heat exchange.
The leading factor affecting the convective heat transfer is the wind speed, and the second one is the smooth degree of the rock face. According to Joergus�� proposal, if the wind speed is less than 5 m/s, the convective heat transfer coefficient can be calculated by h=1.161(5.8+4v) [23, 24]. Thus the wind speed is another factor that affects the rock face temperature.
2.2.4 Established main factors
The influences on the temperature of the rock face from cloud, precipitation, snowfall and other environmental factors can also be included into the factors of solar radiation and air temperature. From the above, we can see that the solar radiation, the air temperature, and the wind speed are three main factors affecting the temperature of the rock face. In this letter, an empirical model of the variation of the rock face temperature was established based on these factors.
3 Results and discussion
3.1 Measurement of three main factors
The typical diurnal variation process of the intensity of solar radiation (Figure 4(a)), the wind speed around the rock face at point No. 1(Figure 4(b)), the temperatures of each measuring point (Figure 4(c) and Figure 5), the local atmospheric temperatures outside the deep open-pit mine (Figure 4(c)), and the air temperatures about 20 m away from the rock face (Figure 5) were measured, which showed that the change of solar radiation could have an immediate effect on the temperatures of the rock face and the variation of the temperatures of rock face was similar to that of the local atmospheric temperature.
From Figure 4(a), the intensity of solar radiation increased gradually with the sunrise, and reached a peak value of 960 W/m2 at 12 o��clock. And then it decreased to 0 W / m2 gradually with the sunset. Usually, the wind speed was changed randomly, which depends on the detailed weather. Taking point No. 1 for example, the wind speed was measured to vary from 0 m/s to 4.5 m/s (see Figure 4(b)).Although the wind speed is not a dominate factor for the variation of the temperature of the rock face in general, it is vital for the instantaneous change of the temperature, which is important in the establishment of empirical model discussed below.
It can be seen from Figure 4(c) that the temperatures of each point changed between 15 ��C and 38 ��C, and the variation range of the local atmospheric temperature was the smallest. The time reaching the peak temperature was different for each point. Specifically speaking, the temperature at point No. 2 peaked ahead of the intensity peak of the solar radiation, while at points No. 1, No. 3,No. 4 and No. 5, the peaks were lagged behind the intensity peaks of the solar radiation. The point No.1 reached the maximum temperature of 37 ��C at 14:00, the point No. 2 reached the maximum temperature of 28 ��C at 9:30, while the points No. 3, No. 4 and No. 5, reached the peaks of 32 ��C, 25 ��C and 23 ��C, respectively, at 16:30. The point No. 1 was located in the sunny slope which would suffer from the most solar radiation, and the cumulative heat reached the peak at 2 with constant absorption of solar energy. The point No. 2, with the largest slope angle, was located in the western part of the open-pit mine, whose terrain was steeper than the other points. When the sunlight shined to the point No. 2, the rock face got limited heat due to the shelter from the steep slope. And the point No. 2 began to release heat after the saturation of energy absorption at 9:30. Although the solar radiation has been dropped after 12:00 for point No. 3 and point No. 4, the solar radiation was too weak to make the saturation of energy absorption of these two points, thus the temperatures would further increase until 16:00 just before the sunset, whose time reaching the peak temperatures were basically the same as the local atmospheric temperatures.
The comparison of the diurnal variation of the temperature of the rock face and the air 20 m away from the rock face were shown in Figure 5. The changing trends were similar for each point. As shown in Figure 5(a), the temperatures of the rock face were always higher than the air temperatures at point No. 1, and the peak time was almost the same. The temperature differences were 3�C4 ��C at night and 15 ��C in the daytime. As the specific heat capacity of the rocks was larger than that of the air,the rocks absorbed more heat under the solar radiation, thus the temperature of the rock face rose higher during the daytime. As a result, the rock face temperatures were higher than the air temperatures, and the temperature differences between them were larger during the daytime. As shown in Figure 5(b), the air temperatures at point No. 2 were slightly higher than the rock face temperatures except from 6:00 to 10:00, being different from point No. 1. The slope angle was larger and the terrain was steeper at the point No. 2, therefore it was hard to expose in the sunlight for a long time, and thus the heat absorption was limited. The rock face at the point No. 2 absorbed heat quickly with the direct sunlight in the morning. While after the temperatures exceeded the air temperatures, the rock face would be exothermic gradually until the temperatures decreased below the air temperatures when the sunlight could not irradiate directly in this place. Figure 5(c) shows the diurnal variation of the rock face temperatures and the air temperatures about 20 m away from the rock face at the point No. 3. The temperatures of the rock face were slightly higher than the air temperatures before sunrise. While after sunrise, the air temperatures and the rock face temperatures both increased, whose increasing speeds were the same and kept fast from 8:00 to 14:00. However, the time to reach the peak temperature of the rock face exhibited hysteresis relative to the air temperature, and the difference of the two peak temperatures was about 5 ��C. After reaching the peak temperature, the two temperatures decreased gradually, maintaining the temperature difference at about 5 ��C. It can be clearly seen that solar radiation had a certain impact on the rock face temperature at the point No. 3. What��s more, the sunlight could irradiate the point No. 3 for a long time, making the rock face temperature to rise to the peak and to decrease linearly after heat saturation. Therefore, the rock face temperatures were always higher than the air temperatures at night. Similar to the point No. 3, the rock face temperatures at night at the point No. 4 (see Figure 5(d)) were always higher than the air temperatures. The two temperatures began to rise with the sunrise, and the air temperatures rose quickly. During the daytime, the air temperatures were always higher than the rock face temperatures, with a temperature difference of 3 ��C. As the point No. 4 was located at the shady side, where the time of receiving sunlight was short, the time to reach the peak temperature for the rock face lagged behind in the air. As a result, the rock face temperatures rose slowly with smaller temperature variation range than the other three points, while the air temperatures increased faster by the surrounding environment.
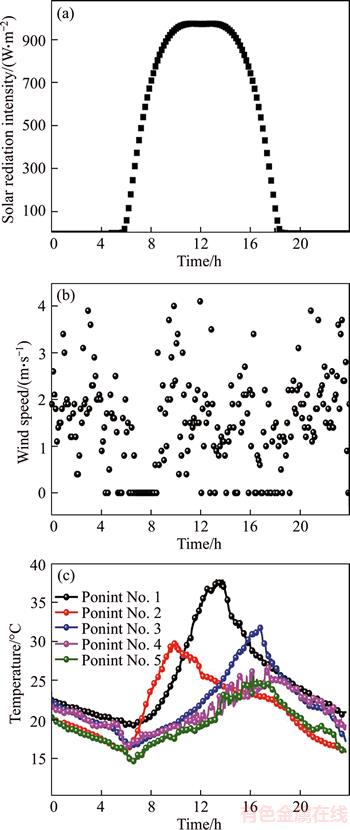
Figure 4 Diurnal variation of intensity of solar radiation (a), wind speed around the rock face at point No. 1 (b), rock face temperatures and local atmospheric temperatures at each measuring point (c)

Figure 5 Comparison of diurnal variation of temperature of rock face and air 20 m away from rock face:
During the daytime, the air temperatures and the rock face temperatures in Figures 5(a)�C(d) had small fluctuations, which were probably due to the influence of airflow. The airflow would bring the ambient air with low or high temperatures to the test points, affecting the temperature of the test points. From the above, the variation of the temperatures of the rock face was related not only to the temperature of the surrounding air and the solar radiation but also to the other environmental factors, such as the wind and relative humidity of the surrounding air.
3.2 Establishment of variation model of rock face temperature
3.2.1 Dimensional analysis method and theorem
Dimensional analysis is a method of building mathematical models in the physics domain. Based on the principle of the dimensional homogeneity in physical laws and the Buckingham �� theorem used for dimensional analysis modeling, the relationship of the corresponding physical variables can be established [25�C28]. This mathematical analysis method is a powerful tool for analyzing the rock face temperature of the iron open-pit mine. The basic theorem of dimensional analysis is the �� theorem: supposing that the number of physical quantities that affect a phenomenon is n, and the basic dimension number of these physical quantities is m, then the physical phenomenon can be expressed by N=n�Cm, which is independent of the dimensionless groups [29�C31].
3.2.2 Model establishment
The analysis shows that the change of the rock face temperature (ty) of the point No. 1 in the open-pit mine was mainly affected by the following factors, i.e., the velocity of airflow (v), the air temperature (ta) about 20 m away from the rock face, the local atmospheric temperature (tb), the relative humidity of the air (H), the density of the ores (��), the specific heat capacity of the ores (c), the thermal conductivity of the ores (��), the solar elevation angle (h0), the intensity of the solar radiation received by the rock face (I��), and so on. These physical quantities can be expressed by general functional relations as
 (3)
(3)
or  (4)
(4)
Although there are 10 variables in the above expressions, the basic dimension number involved is only four, namely the length (L), the mass (M), the time (T), and the temperature (��). Therefore, the above 10 physical quantities can be represented by L, M, T and ��, respectively, as shown in Table 2.
Table 2 Physical quantities and its dimensional representation

According to the �� theorem, the number N of the dimensionless groups is equal to the difference between the variables number n and the basic dimension number m, that is, N=n�Cm=10�C4=6. Since the relative humidity of the air and the solar elevation angle were dimensionless, we used four dimensionless parameters ��1, ��2, ��3 and ��4 to connect these two physical quantities. Therefore, they follow the relationship, ��1=f(��2, ��3, ��4, H, h0). Four physical quantities should be chosen as the core physical quantities, which should include all the basic dimensions. Finally, v, c, �� and �� were selected as the core physical quantities. The physical quantities ty, ty, tb and I�� were combined with the four dimensionless parameters ��1, ��2, ��3 and ��4 through the unknown indexes, respectively, as shown below:

Substituting the dimensions into the above physical quantities, then ��1, ��2, ��3 and ��4 can be expressed as

According to the �� theorem, we got
 (5)
(5)
 (6)
(6)
 (7)
(7)
The dimensionless relationships of various phenomena can be expressed in the form of the power exponent function in certain range. From the above analysis, we fitted the empirical criterion formula as
 (8)
(8)
Taking logarithm for both sides of the above equation, that is,

 (9)
(9)
The data of point No. 1 were analyzed by the multivariate non-linear regression method, and an empirical formula indicating the rock face temperature was obtained

 (10)
(10)
Similarly, the empirical formulas of the rock face temperature in the other three directions were:

 (11)
(11)

 (12)
(12)

 (13)
(13)
The rock faces were exothermic with the sunset, without being affected by the solar radiation and the solar elevation angle. According to the above process, the empirical formulas of the variation of the rock face temperature at night were obtained by fitting the measured data:

 (14)
(14)

 (15)
(15)
(16)

 (17)
(17)
The above eight empirical models of the rock face temperature could basically represent the changes of the rock face temperature on the four typical slopes. The exponential coefficients of each physical quantity were listed in Table 3.
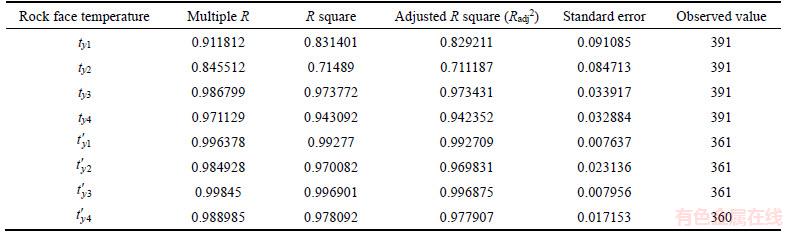
From Table 3, we can see the influences, with positive and negative coefficients for each physical quantity, of each physical quantity on the rock face temperature are different. The coefficient values of the wind velocity in the model are mostly positive. However, the value at point No. 3 in the daytime is negative. During the daytime, most values of the rock face temperature are negatively correlated with the wind speed, thus the coefficients of wind speed are negative. Similarly, the other physical quantities have different effects on the rock face temperature for each measuring point, and their coefficients are also different. The results of the regression analysis are shown in Table 4. Regarding to the amount of data in regression analysis, the complex correlation coefficient (R), the coefficient of determination (R2),the adjusted coefficient (Radj2), and the standard error all reach a fairly high level.
Table 3 Exponential coefficients of various physical quantities of rock face temperature for four points

Table 4 Result of regression analysis from empirical model
Therefore, the empirical model of the rock face temperature in deep open-pit mine can be obtained by the dimensional analysis method and the multivariate nonlinear regression analysis method, which shows the change of rock face temperature at different time.
3.2.3 Evaluation of effectiveness of empirical models
In order to evaluate the fitting, the fitting values with the measured values were compared. As shown in Figure 6, the comparison of the measured values and the fitting values at the points No. 1,No. 2, No. 3 and No. 4 in the daytime (5: 31�C17: 31) and at night (19: 01�C5: 31) were illustrated.
As a whole, the measured values and the fitted values for all the points have high fitting precision except for Figures 6(a) and (c). From Table 3, the temperature is strongly influenced by the wind speed and the local atmospheric temperature. In the daytime, the contrast at point No. 1 is shown in Figure 6(a). As the wind speed in the daytime was irregular, the temperature was not fitted well, but the overall trend was consistent. The rock face steadily absorbed heat and rose its temperature under the influence of different factors. The rock face temperature reached up to a peak and then gradually decreased. The difference between the fitted value and the measured value at the peak was about 5 ��C. The reason is that the specific heat capacity and thermal conductivity of the rock were changed by the solar radiation and the surrounding environment factors. The specific heat capacity and thermal conductivity used in the model were approximately constant, therefore the fitted value and the measured value is different.
From Table 3, it can be seen that the specific heat capacity and wind speed at point No. 2 were the main factors that influence the fitting value of the rock face temperature. Being different from the point No. 1, the fitting values and the measured values of point No. 2 were different in the magnitude of the peak temperature, and the time reaching to the peak. The fitting values and the measured values of point No. 2 were both gradually decreased with the rock face gradually heated up. With the special geographical position of point No. 2 (the larger slope angle and the steeper terrain), the rock face was illuminated by the sun only from 8:00 to 10:00 in the morning, during which the rock face absorbed more heat and quickly reached up to the peak. However, the topographic factors in the empirical model were not considered. That��s why the fitted temperatures were not exactly the same as the measured temperatures.
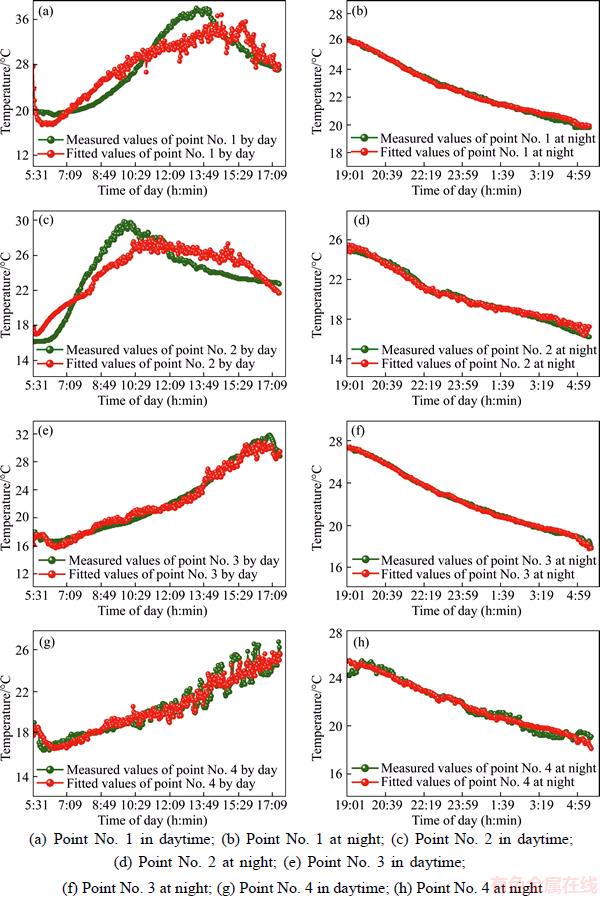
Figure 6 Contrast of measured temperatures and fitted temperatures for each measuring point:
As can be seen from Table 3, the measured rock face temperatures at point No. 3 and point No. 4 were little affected by the solar radiation, but obviously affected by the change of air temperatures at 20 m away from the rock face and the local atmospheric temperatures at 0. In the whole daytime, the air temperatures around the point No. 3 increased linearly, as a result the rock face temperatures at point No. 3 also showed a similar trend with a peak of 30 ��C. As the point No. 4 located in the shady side completely and the ambient air temperature was lower, the rock face temperatures gradually increased with a lower peak of 25 ��C.
From Figures 6(b)�C(h), the temperature of the four measuring points showed a similar downward trend, because the rock face was in an exothermic state throughout the night. The fitting values were in highly consistent with the measured values. The temperature ranges of point No. 1, point No. 3 and point No. 4 were basically maintained at 18�C27 ��C, while the temperature of point No. 2 dropped to 16 ��C at about 5:30 am. Because of the larger slope angle, the sharper terrain and the shorter sun exposure time, the rock face temperatures at point No. 2 reached its maximum and then began to decline at 9:30 am. The exothermic time was the longest one compared to that of the other 3 points and thus the heat loss was the most. Therefore, the amount of released heat at night was firmly related to the amount of heat absorbed during the daytime. The rock face would release the heat absorbed during the day into the air completely at night. After reaching the peak, the rock face began to release heat. The earlier the peak reached, the longer the exothermic time taken. The greater the solar radiation influenced during the day, the lower the temperature of the rock face reached at night.
In a word, the curves of the measured values were in highly consistent with the curves obtained from the empirical model for different points at different time. The empirical model of the rock face temperature can accurately predict the trend of rock face temperature at the corresponding point.
4 Conclusions
Based on the principle of heat transfer and field experiments, and taking the effects of thermal radiation, thermal conduction and thermal convection into consideration, an empirical model of the temperature variation of the rock face in four typical directions was established, where dimensional analysis and multivariate nonlinear regression analysis were adopted. These methods can effectively analyze the relationship between temperature and its influencing factors and reveal the nature of temperature variation. The model fitted well with the field test, indicating high reliability and possibility. This study lays a foundation to study the ventilation thermodynamic theory in the deep open-pit mine, which is of great importance for theoretical studies and engineering applications of solving air pollution problem in deep open-pit mines.
References
[1] HUERTAS J I, HUERTAS M E, IZQUIERDO S, GONZ LEZ E D. Air quality impact assessment of multiple open pit coal mines in northern Colombia [J]. Journal of Environmental Management, 2012, 93(1): 121�C129. DOI: 10.1016/j.jenvman.2011.08.007.
[2] CHAULYA S K. Assessment and management of air quality for an opencast coal mining area [J]. Journal of Environmental Management, 2004, 70(1): 1�C14. DOI: 10.1016/j.jenvman.2003.09.018.
[3] CVETKOVI
 , LOGAR M, ROSI A. Mineralogy and characterization of deposited particles of the aero sediments collected in the vicinity of power plants and the open pit coal mine: Kolubara (Serbia) [J]. Environmental Science and Pollution Research, 2013, 20(5): 3034�C3049. DOI: 10.1007/ s11356-012-1154-z.
[4] LI Xian-xiang, BRITTER R E, KOH T Y, NORFORD L K, LIU Chun-Ho, ENTEKHABI D, LEUNG D Y C. Large-eddy simulation of flow and pollutant transport in urban street canyons with ground heating [J]. Boundary-Layer Meteorology, 2010, 137(2): 187�C204. DOI: 10.1007/s10546- 010-9534-8.
[5] MONJEZI M, SHAHRIAR K, DEHGHANI H, NAMIN F. Environmental impact assessment of open pit mining in Iran [J]. Environmental Geology, 2009, 58(1): 205�C216. DOI: 10.1007/s00254-008-1509-4.
[6] GHOSE M K, MAJEE S R. Assessment of dust generation due to opencast coal mining��an Indian case study [J]. Environmental Monitoring & Assessment, 2000, 61(2): 257�C265. DOI: 10.1007/s10546-010-9534-8.
[7] NIKITIN B ��, BITECOROV H B. Design the ventilation for open pit [M]. Beijing: Metallurgical Industry Press, 1990. (in Chinese)
[8] DU Cui-feng, ZHAO Yun, LI Yong-xin. Numerical simulation and experimental study on distributions of flow field in stope of deep sunken open-pit mines [J]. Journal of Northeastern University, 2014, 35(6): 875�C879. DOI: 10.3969/j.issn.1005-3026.2014.06.026.(in Chinese)
[9] NELSON E P, CONNORS K A, SUREZ S C. GIS-based slope stability analysis, Chuquicamata open pit copper mine, Chile [J]. Natural Resources Research. 2007, 16(2): 171�C190. DOI: 10.1007/s11053-007-9044-7.
[10] ZARE NAGHADEHI M, JIMENEZ R, KHALO KAKAIE R, JALALI S M E. A new open-pit mine slope instability index defined using the improved rock engineering systems approach [J]. International Journal of Rock Mechanics and Mining Sciences, 2013, 61: 1�C14. DOI: 10.1016/j.ijrmms.2013.01.012.
[11] ROSE N D, HUNGR O. Forecasting potential rock slope failure in open pit mines using the inverse-velocity method [J]. International Journal of Rock Mechanics & Mining Sciences, 2007, 44(2): 308�C320. DOI: 10.1016/ j.ijrmms.2006.07.014.
[12] SJ BERG J. Large scale slope stability in open pit mining: A review [D].
  : Tekniska Universitet, 1996.
[13] READ J, STACEY P. Guidelines for open pit slope design [M]. Melbourne: CSIRO Publishing, 2009.
[14] OLATOMIWA L, MEKHILEF S, SHAMSHIRBAND S, MOHAMMADI K, PETKOVI D, SUDHEER C. A support vector machine�Cfirefly algorithm-based model for global solar radiation prediction [J]. Solar Energy, 2015, 115: 632�C644. DOI: 10.1016/j.solener.2015.03.015.
[15] CHEN Jia-qi, LI Liang, WANG Hao. Analytical prediction and field validation of transient temperature field in asphalt pavements [J]. Journal of Central South University, 2015, 22(12): 4872�C4881. DOI: 10.1007/s11771-015-3039-z.
[16] BAKIRCI K. Estimation of solar radiation by using ASHRAE clear-sky model in erzurum, turkey [J]. Energy Sources, 2009, 31(3): 208�C216. DOI: 10.1080/ 15567030701522534.
[17] FLORES J L, KARAM H A, FILHO E P M. Estimation of atmospheric turbidity and surface radiative parameters using broadband clear sky solar irradiance models in Rio de Janeiro-Brasil [J]. Theoretical and Applied Climatology, 2016, 123(3): 593�C617. DOI: 10.1007/s00704-014-1369-7.
[18] HU Bo, WANG Yue-si. Comparison of multi-empirical estimation models of photo synthetically active radiation under all sky conditions in Northeast China [J]. Theoretical and Applied Climatology, 2014, 116(1): 119�C129. DOI: 10.1007/s00704-013-0941-x.
[19] WANG Jian-ping, CAI Zong-liang, ZHU Cheng-hui. Daily solar direct radiation exposure online prediction based on the process wavelet neural network [J]. Taiyangneng Xuebao/ Acta Energiae Solaris Sinica, 2015, 36(1): 196�C201. DOI: 10.1109/iceceng.2011.6057583. (in Chinese)
[20] TAN Xian-jun, CHEN Wei-zhong, Wu Guo-jun, YANG Jian-ping. Study of airflow in a cold-region tunnel using a standard k�C��, turbulence model and air-rock heat transfer characteristics: Validation of the CFD results [J]. Heat Mass Transfer, 2013, 49(3): 327�C336. DOI: 10.1007/s00231-012- 1081-z.
[21] AL-SANEA S A, ZEDAN M F, AL-AJLAN S A. Adjustment factors for the ashrae clear-sky model based on solar-radiation measurements in Riyadh [J]. Applied Energy, 2004, 79(2): 215�C237. DOI: 10.1016/j.apenergy.2003.11.005.
[22] ABBASI F M, HAYAT T, AHMAD B, CHEN B. Peristaltic flow with convective mass condition and thermal radiation [J]. Journal of Central South University, 2015, 22(6): 2369�C2375. DOI: 10.1007/s11771-015-2762-9.
[23] CHATZIANGELIDIS K, BOURIS D. Calculation of the distribution of incoming solar radiation in enclosures [J]. AicHe Journal, 2015, 29(7): 1096�C1105. DOI: 10.1016/ j.applthermaleng.2008.05.026.
[24] SOUZA K D, ANDREWS R. Models for daily global solar radiation for the caribbean island of Trinidad [J]. Journal of Renewable & Sustainable Energy, 2015, 7(1): 013132. DOI: 10.1063/1.4909539.
[25] WAHI M K. Application of dimensional analysis to predict airplane stopping distance [J]. Journal of Aircraft, 2015, 14(2): 209�C214. DOI: 10.2514/3.44584.
[26] TAN Qing-ming. Dimensional analysis [M]. Hefei: Press of University of Science and Technology of China, 2005. (in Chinese)
[27] OGAREKPE N M, AGUNWAMBA J C, NWAOGAZIE I L. Dimensional analysis design model of biochemical oxygen demand in integrated solar and hydraulic jump enhanced waste stabilization pond [J]. International Journal of Civil Engineering & Technology, 2016, 7(2): 387�C395. DOI: 10.1080/19443994.2015.1112306.
[28] BUCHANAN M. Dimensional analysis [J]. Nature Physics, 2010, 6(8): 555. DOI: 10.1038/nphys1744.
[29] ALIPRANTIS C D, BORDER K C. Infinite dimensional analysis [M]. New York: Springer-Verlag, 2006. DOI: 10.1007/3-540-29587-9.
[30] SANCHEZ F, BUDINGER M, HAZYUK I. Dimensional analysis and surrogate models for the thermal modeling of multiphysics systems [J]. Applied Thermal Engineering, 2016, 110: 758�C771. DOI: 10.1016/j.applthermaleng.2016.08. 117.
[31] PARKIN J, WIDJAJA K S, BRYAN M P. Experimental validation of a dimensional analysis of spheronisation of cylindrical extrudates [J]. Powder Technology, 2016, 98: 73�C83. DOI: 10.1016/j.powtec.2016.05.007.
(Edited by HE Yun-bin)
���ĵ���
ij�¶����ұ��¶�Ӱ�����ط�����ģ�ͽ���
ժҪ��������������¶�쿪��������ӣ����ɹ����в������к�����ͷ۳�����Ⱦ�̶ȳʵ������ơ�Ϊ�˼��ٲɳ�����Ⱦ����ɢ���о���Ȼ������ij�¶����ұ��¶ȳ��ֲ�������ʮ�ֱ�Ҫ�ġ����ȣ����ڴ���ѧԭ��ȷ��������ҪӰ�����ء�Ȼ�����ұ����������������̫������Ӱ�첻ͬ��ѡȡij�¶����ĸ�����λ��������ֳ����飬���������ٷ������Ͷ�Ԫ�����Իع������������ij�¶����ұ��¶ȱ仯�ľ���ģ�ͣ��þ���ģ���ܽϺõ�����ֳ����������о��¶����ұ��¶ȵķֲ����ɣ��ܹ���һ����ʾ¶����ڲ����¶ȳ��ֲ������²���ݱ���ɣ�Ϊ�¶���ͨ���ȶ��������о��춨��ʵ�������Խ���¶��������Ⱦ���������Ҫ�����ۺ�ʵ�����塣
�ؼ��ʣ��¶����ұ��¶ȷֲ����ɣ����ٷ����������Իع����
Foundation item: Project(51274023) supported by the National Natural Science Foundation of China; Project(FRF-BD-17-007A) supported by Fundamental Research Funds for the Central Universities, China
Received date: 2017-04-12; Accepted date: 2017-10-16
Corresponding author: DU Cui-feng, PhD, Professor; Tel: +86�C10�C62313972; E-mail: ducuifeng@126.com
Abstract: In recent years, with the increase of the depth of open-pit mining, the pollution level has been on the rise due to harmful gases and dust occurring in the process of mining. In order to accelerate the diffusion of these air pollutants, the distributed regularity of the rock face temperature which is directly related to the air ventilation in deep open-pit mines should be studied. Here, we establish the key factors influencing the rock face temperature in a deep open-pit mine. We also present an empirical model of the rock face temperature variation in the deep open-pit mine, of which the performance is interestingly high compared with that of the field test. This study lays a foundation to study the ventilation thermodynamic theory in the deep open-pit mine, which is of great importance for theoretical studies and engineering applications of solving air pollution problem in deep open-pit mines.
