
J. Cent. South Univ. Technol. (2008) 15(s1): 322-325
DOI: 10.1007/s11771-008-372-5
![]()
Variation of yield stress of Daqing crude oil with pipelining history
LI Li(�� ��)1, HOU Lei(�� ��)2, SUN Li-xin(������)2
(1. College of Architecture and Storage Engineering, China University of Petroleum (Huadong),Dongying 257061, China;
2. Beijing Key Laboratory of Urban Oil and Gas Distribution Technology,China University of Petroleum (Beijing), Beijing 102249, China)
Abstract:
The yield stress of waxy crude oil is a fundamental parameter in the calculation of pipelining technique and analysis of flow safety for the heated oil transported through pipeline. Daqing crude oil was studied and the variation of yield stress with shear history was explored through simulation experiment of pipelining. It is found that the effect of throughput variation or shear rate on yield stress is not obvious. With the decrease of final dynamic cooling temperature, the yield stress of waxy crude oil decreases, but there exists a little increase at the beginning. The prediction model of yield stress for waxy crude oil under the condition of shutdown is developed and it can be used to predict the yield stress of Daqing crude oil at certain heating temperature, final dynamic cooling temperature and measurement temperature. For the 139 groups of yield stress data of Daqing crude oil from the simulation experiment of pipelining, the result of prediction with this model shows that the average relative deviation between the yield stress measured and predicted is 30.27%, and the coefficient of correlation is 0.962 3.
Key words:
Daqing crude oil; pipelining; yield stress; prediction model��
1 Introduction
Waxy crude oil is usually heated when it is transported through pipeline. The temperature of oil drops gradually during pipelining, which is a dynamic process of temperature decrease; while during the pipeline shutdown, the crude oil experiences a static process of temperature decrease since the oil temperature is higher than the soil temperature. The main factors that affect the yield stress of waxy crude oil during pipeline shutdown include heating temperature, throughput, oil temperature at the beginning and the end of shutdown, etc[1]. In this paper, the variation of yield stress with pipelining history of Daqing crude oil was studied through the simulation experiment of pipelining and yield stress test.
2 Experimental
2.1 Apparatus and instrument
Pipelining simulation apparatus consisted of sealed tank(with sampling outlet), IKA adjustable stirrer and HAAKE F8 programmable water bath.
RS150H rheometer was made by HAAKE in German, with coaxial geometry Z41Ti.
2.2 Sample oil and pipeline section simulated
The sample oil was Daqing crude oil. The differential scanning calorimetric test shows that its wax appearance temperature(WAT) was 40.7 �� and the wax content was 26.6% (mass fraction). The gel point determined through ��SY/T0541-94 Determination of the Gel Point of Crude Oil�� was 32 �� when the loading temperature of oil sample was 45 ��. The abnormal temperature determined by viscosity-temperature relationship was 37 ��.
The section from Tieling to Shenyang of the Tie-Da pipeline was simulated. The length of this section was 70.1 km. The outer diameter of the pipeline was 720 mm with inner diameter of 704 mm.
2.3 Principle of simulation experiment
According to the conclusion in Ref.[2], the quantitative simulation of thermal and shear history during pipelining was carried out as follows: the average shear rate was calculated through the volumetric average of the energy dissipation rate of fluid; the parameter simulated was the energy dissipation of viscous flow during shearing process; the energy dissipation when theoil temperature dropped to certain final dynamic cooling temperature, the average shear rate of oil in simulation tank, and the rotational speed of paddle and the time of stir were determined in accordance with the temperature variation history during pipelining.
3 Results and discussion
The temperature of oil in simulation tank begins to decrease after the oil is heated to 45 ��. The different throughputs adopted are 8, 10, 12 and 14 Mt/a; the shear rates are 20, 30, 50 and 60 s-1; the final dynamic cooling temperatures are 40, 38, 36, 34, 32 and 30 ��. All the measurements were conducted at 30 ��.
3.1 Effect of shear and final dynamic cooling tem- perature on yield stress
Figs.1 and 2 show the yield stress variation with final dynamic cooling temperature under different throughputs and shear rates. It can be found that: 1) the

Fig.1 Yield stress variation with final dynamic cooling temperature under different throughputs of Daqing crude oil at 30 ��
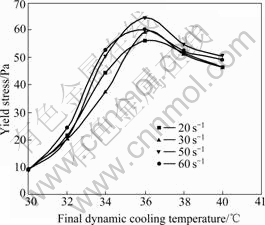
Fig.2 Yield stress variation with final dynamic cooling temperature under different shear rates of Daqing crude oil at 30 ��
curves of yield stress vs final dynamic cooling temperature under different throughputs and shear rates intertangle each other, indicating that the shear action during dynamic cooling process only affects the yield stress a little under the adopted throughputs and shear rates; 2) there exists a peak on every curve of yield stress vs final dynamic cooling temperature, and the corresponding final dynamic cooling temperature is 36 ��. When the final dynamic cooling temperature is above 36 �� the yield stress increases with the decrease of the final dynamic cooling temperature; on the other hand, when the final dynamic cooling temperature is below 36 �� the yield stress decreases with the decrease of the final dynamic cooling temperature.
3.2 Correlation for predicting yield stress
The issue above can be summarized as the study of the relation between �� and Cs/Cd. The correlation should meet the following boundary conditions: 1) when the oil is statically cooled from the heating temperature to the measurement temperature, Cd=0, Cs��0, Cs/Cd��+��, ��y=��ys, ��=0; 2) when the oil is dynamically cooled from the heating temperature to the measurement temperature, Cs=0, Cd��0, Cs/Cd=0, ��y=��yd, ��=1. The exponential function can meet the two boundary conditions:
![]() (1)
(1)
![]() (2)
(2)
The shearing effect on yield stress is realized by changing the structural morphology of wax crystals. When the final dynamic cooling temperature is higher than the WAT, the yield stress is unchanged with the decrease of the final dynamic cooling temperature and equals the value measured under a static cooling condition. When the final dynamic cooling temperature is lower than the WAT, the yield stress consists of two parts: one is determined by the wax precipitation volume during the course of dynamic cooling and is represented as ��y1; the other is determined by the wax precipitation volume during the course of static cooling and is represented as ��y2. Suppose that with the decrease of the final dynamic cooling temperature, the wax precipitation volume increases during the course of dynamic cooling and decreases during the course of static cooling. The combined result of the reverse trend above determines the trend of the yield stress variation with the final dynamic cooling temperature.
The yield stress corresponding to the peak value on the relation curve of yield stress vs final dynamic cooling temperature is called peak yield stress and represented as ��yp. The final dynamic cooling temperature corresponding to peak yield stress is called peak final dynamic cooling temperature and represented as Tp. Suppose that there is a linear relationship between ��y1 and Cd when final dynamic cooling temperature is higher than peak final dynamic cooling temperature, the following equation can be obtained: ��y1=kCd, where k is a parameter; when final dynamic cooling temperature is lower than peak final dynamic cooling temperature, the following equation can be obtained: ��y1=kCp, Cp is the wax precipitation volume corresponding to the peak final dynamic cooling temperature.
When ��y2 is introduced into Eqn.(2), the following equations can be obtained:
![]() (3)
(3)
![]() (4)
(4)
In order to strengthen the effect on ratio of wax precipitation volume, the parameter m is introduced to modify Eqn.(3), and the following equation can be obtained:
![]() (5)
(5)
3.3 Case study
The method above is used to predict the yield stress of Daqing crude oil under different thermal and shear history. For the 139 groups of data, the average relative deviation is 30.2% and the coefficient of correlation between the values predicted and measured is 0.962 3. The relative deviation of 85 groups of data is less than 20% and covers a ratio of 61.2%. The absolute deviation between the values predicted and measured of 81 groups of data is less than 10 Pa and covers a ratio of 58.3%. The comparison between the predicted result and measured result of yield stress is shown in Fig.3. In Fig.3, the middle real line represents that the predicted yield stress equals the measured value, and the up and down dashed lines are the error lines of ��20 Pa. There are 114 groups of data, which cover a ratio of 82.0% of the total data, between the error lines above. The comparison between the predicted result and measured result of yield stress at different heating temperatures are shown in Figs.4 and 5.
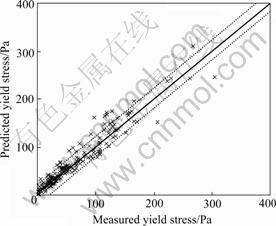
Fig.3 Comparison between predicted value and measured value of Daqing crude oil
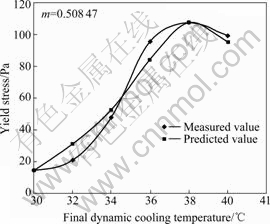
Fig.4 Yield stress of Daqing crude oil at heating temperature of 50 ��
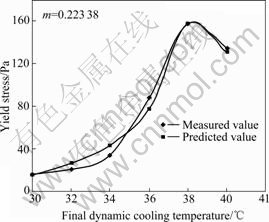
Fig.5 Yield stress of Daqing crude oil at heating temperature of 55 ��
4 Conclusions
1) In the range of investigated throughput and shear rate, the shear action under the dynamic cooling condition has a little effect on yielding behavior.
2) A peak yield stress exists on the relationship curve of yield stress vs final dynamic cooling temperature. When the final dynamic cooling temperature is above the peak, the yield stress has a little increase with the decrease of final dynamic cooling temperature. When the final dynamic cooling temperature is below peak, the yield stress decreases with the decrease of final dynamic cooling temperature.
3) A correlation for yield stress and wax precipitation volume under two different cooling conditions is established and is used to predict yield stress under different thermal and shear histories. The analysis of the obtained 139 groups of data shows that the average relative deviation is 30.2% and the coefficient of correlation between predicted value and measured value is 0.962 3.
References
[1] HOU Lei, ZHANG Jing-jun The research of yield stress of waxy wrude oil [J]. Oil & Gas Storage & Transportation, 2005, 24(3): 5-9. (in Chinese)
[2] ZHANG Jin-jun, ZHANG Fan, HUANG Qi-yu, YAN Da-fan. An approach to estimate the average shear rate in an adiabatic stirred vessel [J]. Journal of Engineering Thermophysics, 2002, 23(6): 703-706. (in Chinese)
Foundation item: Project(07E1007) supported by the Youth Innovation Foundation for Petroleum Science and Technology of China National Petroleum Corportation; Project(2006AA09Z357) supported by the National High Technology Research and Development of China
Received date: 2008-06-25; Accepted date: 2008-08-05
Corresponding author: HOU Lei, PhD, Associate professor; Tel: +86-10-89731967; E-mail:houleicup@126.com
