
J. Cent. South Univ. (2016) 23: 570-580
DOI: 10.1007/s11771-016-3104-2

Design and application of electric oil pump in automatic transmission for efficiency improvement and start–stop function
LIU Yan-fang(刘艳芳)1, 2, DONG Peng(董鹏)1, 2, 3, LIU Yang(刘洋)1, 2, XU Xiang-yang(徐向阳)1, 2
1. Department of Automotive Engineering, School of Transportation Science and Engineering,
Beihang University, Beijing 100191, China;
2. Beijing Key Laboratory for High-efficient Power Transmission and
System Control of New Energy Resource Vehicle (Beihang University), Beijing 100191, China;
3. Institute of Industrial and Automotive Drivetrain, Department of Mechanical Engineering,
Ruhr-University Bochum, Bochum 44801, Germany
 Central South University Press and Springer-Verlag Berlin Heidelberg 2016
Abstract:
For the purpose of improving efficiency and realizing start–stop function, an electric oil pump (EOP) is integrated into an 8-speed automatic transmission (AT). A mathematical model is built to calculate the transmission power loss and the hydraulic system leakage. Based on this model, a flow-based control strategy is developed for EOP to satisfy the system flow requirement. This control strategy is verified through the forward driving simulation. The results indicate that there is a best combination for the size of mechanical oil pump (MOP) and EOP in terms of minimum energy consumption. In order to get a quick and smooth starting process, control strategies of the EOP and the on-coming clutch are proposed. The test environment on a prototype vehicle is built to verify the feasibility of the integrated EOP and its control strategies. The results show that the selected EOP can satisfy the flow requirement and a quick and smooth starting performance is achieved in the start–stop function. This research has a high value for the forward design of EOP in automatic transmissions with respect to efficiency improvement and start–stop function.
Key words:
1 Introduction
Thanks to the increasing requirements for CO2 reduction and fuel economy, automatic transmissions tend to have more speeds in recent years. However, when automatic transmissions have more than 8 speeds, continuing increasing the gear number will not improve the fuel economy significantly. Therefore, some hybrid functions are integrated into automatic transmissions to further reduce the fuel consumption. Start–stop function is one option and it is easy to implement compared with other hybrid systems. Among different methods of integrating start–stop function into automatic transmissions, an add-on electric oil pump (EOP) is a good solution because of its small modifications in design. In addition, the EOP can supplement the oil flow at low engine speeds, thus the size of the mechanical oil pump (MOP) can be reduced to further improve the hydraulic efficiency.
Nowadays, many modern automatic transmissions have been equipped with a two-pump system (one EOP and one MOP). A compact EOP is integrated in the Aisin new generation of 6 and 8-speed transverse automatic transmission [1]. However, it is only designed to meet the market need for the start–stop function. Whether the EOP can work together with the MOP to give a further fuel economy potential is not mentioned in the reference. Mercedes-Benz new 9-speed automatic transmission also applies the two-pump system by integrating an EOP [2]. In addition to realization of the start–stop function, this EOP can also help to support the line pressure and supplement the oil flow for lubrication and cooling at low engine speeds. But, how to choose the size of the EOP and the MOP to get the lowest energy consumption is not considered in the reference. HWANG et al [3] designed a different two-pump system to improve the efficiency and performance of its 6-speed automatic transmission. The difference is that in this system the two pumps are all EOPs and there is no MOP. By controlling these two EOPs depending on the vehicle operating conditions, the optimal flow rate can be supplied, thus the energy loss can be reduced. However, only using the EOP is not the best solution through the investigation of our work. And two EOPs are not good in terms of weight and cost. Some control strategies have been proposed for the EOP of the two-pump system [4–6]. In the development of these control strategies, the minimization of the EOP energy consumption is always an important consideration. Toyota develops a new start clutch control system by employing an electric oil pump [7]. This electric oil pump is only designed for the start–stop function, thus its control strategy only serves for the smooth and quick vehicle start. SHUNSUKE et al [8] also developed a control strategy for the EOP with respect to start–stop function. Besides, new types of EOP and MOP with higher efficiencies have also been developed and applied in automatic transmissions [9–11] for a better fuel economy.
Figure 1 shows the two-dimensional structure of an 8-speed automatic transmission which have entered into the mass production. The MOP locates behind the torque converter and is connected to the pump of the torque converter directly. In current design, this MOP has a big displacement volume which results in a big hydraulic loss at high engine speeds. Therefore, the objectives of this work are listed as follows.
(1) Replacing this big MOP with a two-pump system to realize start–stop function and improve hydraulic efficiency.
(2) Developing a control strategy for the EOP to satisfy the flow requirement of the automatic transmission.
(3) Developing a control strategy for the EOP to fast build up the hydraulic line pressure when engine restarts.
(4) Developing a control strategy for the on-coming clutch to realize a quick and smooth vehicle starting performance.
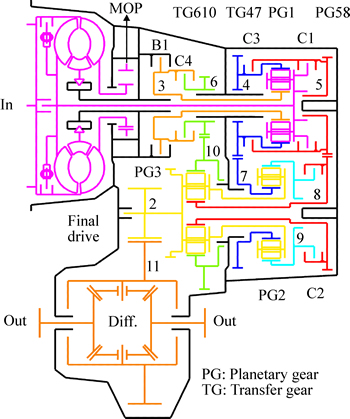
Fig. 1 Two-dimensional structure of an 8-speed automatic transmission
2 Power loss model
The power loss of an automatic transmission is comprised of mechanical loss (gear, bearing, seal, shifting loss, and drag torque loss in the open shifting elements), hydraulic loss (torque converter, and MOP), and electric loss (electric power demand for the solenoids, sensors, transmission control unit, and EOP). The power loss generates heat in the transmission and must be dissipated by the transmission housing and the cooling oil flow. The necessary cooling oil flow is supplied at the expense of the hydraulic loss (from MOP and EOP) and the electric losses (from EOP). In this section, the power loss model of the 8-speed automatic transmission is established. This power loss model can be applied for the calculation of the necessary cooling oil flow.
2.1 Gear meshing loss
As shown in Fig. 1, this 8-speed automatic transmission has three planetary gear sets and four transfer gear sets. The mechanical power transferred by a planetary gear set can be divided into two parts [12]. One part is known as “coupling power” which has no losses because there is no conversion of torque and speed. The other part is called “rolling power” which is a result of relative speeds between the central gears (sun gear and ring gear) and the carrier. This power generates losses in the rolling teeth and in the planetary bearing. Thus, the calculation of power loss for a planetary gear set is expressed by
 (1)
(1)
where TS and TR are the torques of the sun gear and ring gear, respectively; ωS, ωR and ωC are the angular speeds of the sun gear, ring gear and carrier, respectively.
In Eq. (1), the loss is mainly a torque loss. It is reflected by the kinetic equation of the planetary gear set:
 (2)
(2)
where i0 is the standard gear ratio; η0 is the efficiency factor of a planetary gear set with motionless carrier; w defines the direction of the power flow.
The efficiency factor η0 includes two parts:
 (3)
(3)
where ηV is the gear meshing efficiency; ηL is the planetary bearing efficiency. For a transfer gear set, the efficiency factor doesn’t need to consider the planetary bearing efficiency in Eq. (3). Equations (1)–(3) are also applied to a transfer gear set where TS and TR can be replaced by the torque of the two meshing gears and ωC can be treated as zero. The efficiency factor doesn’t need to consider the planetary bearing efficiency for a transfer gear set. According to Ref. [12], the gear meshing efficiency is assumed to be 99.0% for an external gear pair and 99.5% for an internal gear pair. The planetary bearing efficiency is assumed to be 99.5%.
2.2 Bearing loss
There are three types of bearings in this 8-speed automatic transmission: ball bearings, tapered roller bearings, and needle roller bearings. The friction torque of a bearing includes two parts [13]: One part is a function of speed as shown in Eq. (4), and the other part is a function of load as shown in Eq. (5):
 (4)
(4)
 (5)
(5)
where T0 is the friction torque as a function of speed; f0 is the bearing factor for friction torque as a function of speed; ν is the kinematic viscosity of the oil at a specific operating temperature; n is the operating speed; dM is the mean bearing diameter; T1 is the friction torque as a function of load; f1 is the bearing factor for friction torque as a function of load; P1 is the decisive load for friction torque; F is the load for bearings. The total power loss of a bearing is calculated according to
 (6)
(6)
2.3 Seal loss
The seals of this 8-speed automatic transmission include the radial shaft seal rings and the o-rings in the shifting elements. For the o-rings, besides the friction force in the circumferential direction, there is still an axial friction force when the clutch piston moves in the axial direction. However, this axial friction force only exists in the filling phase of the shifting process. It is ignored in the power loss calculation because of a short action time. The calculation of seal loss is according to the following equation [14]:
 (7)
(7)
where dsh is the shaft diameter.
2.4 Drag torque loss of open shifting elements
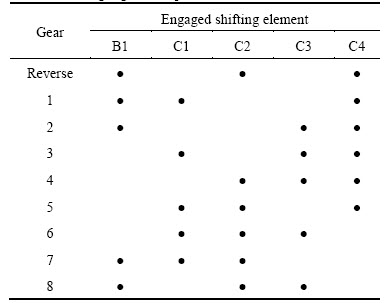
Table 1 gives the shifting logic of the 8-speed automatic transmission. This 8-speed automatic transmission has five shifting elements which are all multi-plate clutches or brakes. In each gear, three shifting elements are locked. Only two open shifting elements create drag torque losses.
Table 1 Shifting logic of 8-speed automatic transmission
The drag torque depends on the relative speed between the two halves of the shifting element. It is caused by the laminar shear of the oil in the gap between the plates. Assuming that the oil is Newtonian and the laminar velocity is in the circumferential direction, the drag torque can be expressed by


 (8)
(8)
where N is the number of friction facings; τ is the viscous torque per unit area; A is the friction area; r is the friction radius; ro is the out radius of the friction plate; ri is the inner radius of the friction plate; μ is the oil dynamic viscosity; υθ is the oil angular shear velocity; ω is the relative angular speed difference; h is the oil film thickness; z is the unit interval of the plate gap. The power loss of the open shifting element thus can be calculated according to
 (9)
(9)
2.5 Torque converter loss
The lock up clutch of torque converter is always open in the first gear and the reverse gear. In other gears, the pump and the turbine are mechanically connected. A big hydraulic loss occurs when the torque converter works in the hydraulic condition. It is considered in the power loss model and is calculated based on the following equation:

 (10)
(10)
where TP is the pump torque; TT is the turbine torque; ωP is the pump angular speed; ωT is the turbine angular speed; μTC is the torque ratio coefficient; λ is the performance coefficient; ρATF is the oil density; DTC is the profile diameter of torque converter.
2.6 Pump loss
The pump provides the circulated oil flow for the automatic transmission. It also consumes the engine power and generates the heat loss. This loss is calculated according to
 (11)
(11)
where pline is the hydraulic line pressure; qpump is the oil flow provided by the pump; ηpump is the pump efficiency. For the MOP, this efficiency includes the volumetric efficiency and the mechanical efficiency. For the EOP, the electric efficiency is also considered.
All above losses are torque or speed dependent. The sum of them in different gears at 90 °C is shown in Fig. 2. It can be seen that the 8-speed automatic transmission has a big power loss in the first and the reverse gear because the torque converter works in the hydraulic condition. The normal operating temperature of the automatic transmission fluid (ATF) is from 80 °C to 120 °C. When the temperature drops, the loss will increase because the viscosity of the ATF increases. However, there is still one big loss not shown in Fig. 2. This loss occurs not in a specific gear but in the shifting process. It is the shifting loss caused by the friction slip of the shifting elements.
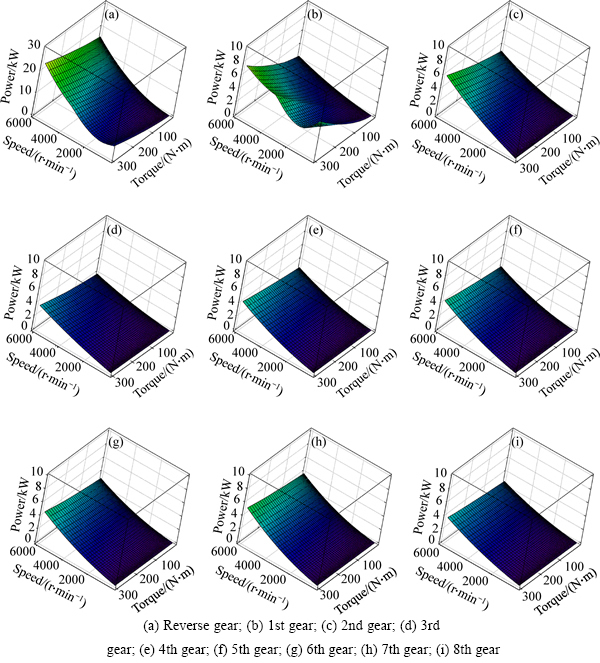
Fig. 2 Power loss of 8-speed automotive transmission in different gears at 90 °C:
2.7 Shifting loss
All shifts of this 8-speed automatic transmission are clutch-to-clutch shifts. For the engaging and disengaging shifting elements, there is a pressure-controlled slipping process during the gear shifting [15]. The power loss of the actuated shifting element is calculated according to
 (12)
(12)
where μd is the dynamic friction coefficient; pSE is the pressure of the shifting element; pkiss is the kiss-point pressure which compensates for the return spring and seal friction force; Δω is the angular speed difference. The shifting loss can be taken into account for each shifting process in the forward driving simulation. It is usually higher compared with other power losses. The heat appears in such a short time and cannot be dissipated by the oil at once. The friction materials should be able to bear such a high temperature. There are slots on the plate surface to let the oil through when the shifting element is locked. In this way, the heat stress can be reduced gradually. Figure 3 shows part of the NDEC driving cycle and calculated power loss in the forward driving simulation. It can be seen that the peak points of the power loss curve are just caused by the shifting loss at a certain driving pedal position.
3 Leakage model
Figure 4 shows the hydraulic schematic diagram of the 8-speed automatic transmission. The detailed description of its functionality is introduced in Ref. [16]. In this hydraulic system, all the valves (proportional solenoid valves, and slide valves) have leakages. The leakage oil flow must be compensated by the pump system. There are two kinds of leakage in the hydraulic system. The leakage of the eccentric ring gap is considered, as shown in Fig. 5(a). The leakage between the spool and the bore in the slide valve is just like this form. The other is called the orifice leakage, as shown in Fig. 5(b). The leakage of the proportional solenoid valve is considered in this form.
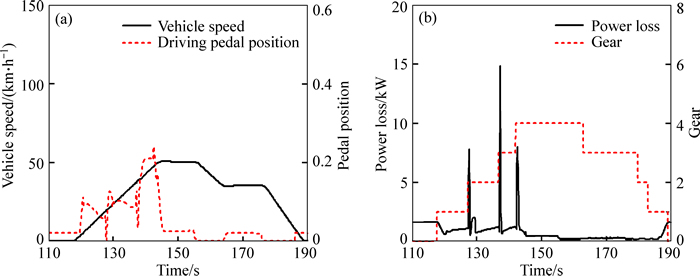
Fig. 3 Simulation results of NEDC driving cycle
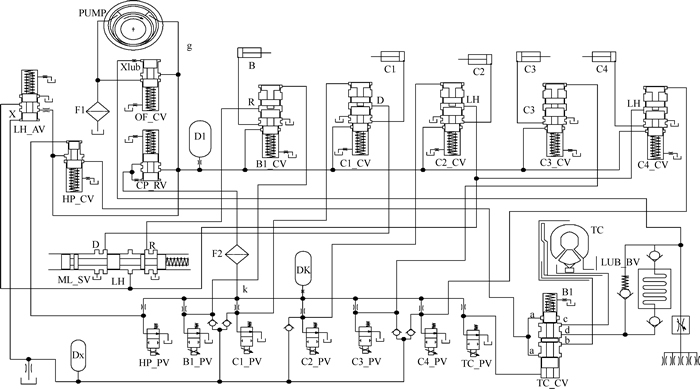
Fig. 4 Hydraulic schematic diagram of 8-speed automotive transmission
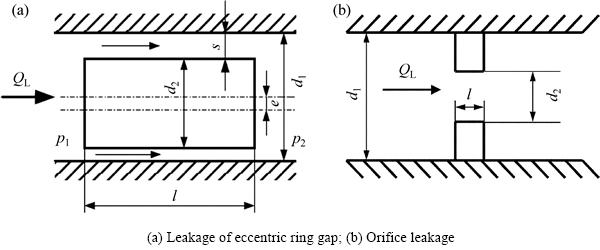
Fig. 5 Two types of leakage in hydraulic system:
The calculation of the leakage in an eccentric ring gap is expressed by
 (13)
(13)
where d1 is the inner diameter of the bore; d2 is the outer diameter of the spool; l is the overlap length between bore and spool; Δp is the pressure difference; e is the eccentric.
For the orifice leakage in the proportional solenoid valve, the calculation is according to the following equation:
 (14)
(14)
where αD is the flow coefficient; A0 is the cross section area of the orifice.
It is known from Eq. (13) that the leakage of an eccentric ring gap is much influenced by the temperature. With the temperature rising, the kinematic viscosity of the oil ν will decrease, thus the leakage will increase. However, the temperature has a small impact on the orifice leakage. In different transmissions, the leakage is different owing to different tolerances. The calculation here assumes that the transmission has the biggest tolerance, thus the eccentric e has the biggest value equal to (d1–d2)/2. The leakage also varies with the line pressure and the control pressure of the hydraulic system. When the pressure difference Δp increases, the ring gap leakage and the orifice leakage increase. The line pressure is controlled depending on the engine torque in the actual driving. But, in the leakage calculation, it is always the maximum value to ensure that the calculated flow requirement is sufficient.
In summary, the total flow requirement for the leakage is calculated:
 (15)
(15)
4 Flow-based control strategy of EOP
In order to replace the old big MOP with a two- pump system (one EOP and one MOP), a flow-based control strategy for the EOP is developed. This flow- based control strategy just makes use of the information of the calculated flow requirement. No more additional energy is required for the EOP under the condition that the flow rate is sufficient for the transmission. Hence, this control strategy can reduce the load of the EOP to a maximum extent. Firstly, based on the power loss model, the required oil flow for the cooling and lubrication is calculated:
 (16)
(16)
where Ptotal_loss is the total generated heat loss; Phousing is the heat dissipated through the housing; cATF is the heat capacity of the ATF; ΔT is the permissible temperature increase of the ATF.
In Eq. (16), the total generated heat loss is defined as

 (17)
(17)
The heat dissipated through the housing is calculated according to
 (18)
(18)
where k is the heat coefficient which includes the internal heat transfer between oil and housing, the heat conduction through the housing wall and the external heat transfer to the environment. The calculation of this coefficient is detailed described in Ref. [14]. Aca is the area of the housing; Toil is the temperature of the ATF; T∞ is the ambient temperature.
The maximum oil flow for the lubrication and cooling system is limited to 25 L/min by an oil flow control valve (OF_CV) in the hydraulic system. The reason is that the oil flow increases with the increasing engine speed. The pressure and the oil flow will become too high at high engine speeds without this limitation. Therefore, in Eq. (16), the flow requirement for the necessary cooling oil is limited to maximum 25 L/min.
The leakage mentioned in Section 3 should also be considered in the total flow requirement. Hence, the total flow calculation is expressed by
 (19)
(19)
where QTC is the minimum flow requirement of the hydraulic torque converter; Qline is the minimum flow demand for keeping the hydraulic line pressure.
Since the MOP is connected to the pump of the torque converter, the oil flow provided by the MOP depends on the engine speed. By subtracting this oil flow from the total flow requirement, the rest is just the necessary flow which needs to be provided by the EOP. Then, the speed of the EOP can be controlled according to

 (20)
(20)
where QEOP and QMOP are the oil flows from the EOP and MOP, respectively; VEOP and VMOP are the displacements of the EOP and MOP; ηEOP_vol and ηMOP_vol are the volumetric efficiencies of the EOP and MOP, respectively; npump is the rotation speed of the MOP.
This flow-based control strategy is verified through the forward driving simulation. For a given displacement of the MOP, Fig. 6 shows the simulation results of the total flow requirement, the oil flow provided by the MOP, and the necessary flow from the EOP in a driving simulation. It can be seen that the EOP provides necessary oil flow when the MOP cannot satisfy the total flow requirement. When the MOP can satisfy the system flow requirement alone, EOP will be switched off.
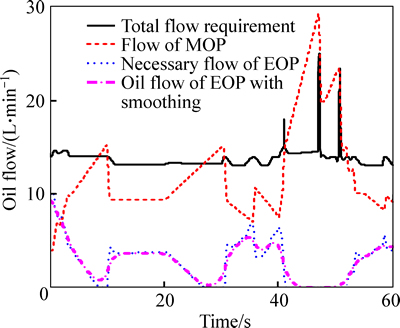
Fig. 6 Simulation results of oil flow in a simple driving cycle
However, when applying this control strategy in the actual vehicle driving, the fluctuation of the EOP flow requirement will make the target control speed of the EOP oscillate. Especially, when shift happens, the oil flow requirement will increase dramatically. The rotation speed of EOP cannot fluctuate so sharply to follow the system flow requirement. In reality, the heat generated in such a short time is dissipated gradually. Hence, a first order time delay function is applied here to control the EOP speed steadily. As shown in Fig. 6, this function helps to smooth the peak points of the oil flow for actual application.
This flow-based control strategy can help us to select the most economical combination of MOP and EOP through the forward driving simulation. For a two- pump system, when a small size of MOP is selected, the energy loss of the MOP especially at high engine speeds will be reduced. However, for the compensation of the oil flow at low engine speeds, a big EOP must be selected. Besides, the EOP needs to work for a long time, which increases the electric load of the vehicle. The total energy consumption thus will not be improved. On the contrary, a big MOP can reduce the electric load of the EOP, but it consumes a lot of energy with the engine speed increasing. Therefore, a best combination of EOP and MOP needs to be investigated in terms of the reduction of the total energy consumption.
The total energy consumption of EOP and MOP is expressed by

 (21)
(21)
where PEOP and PMOP are the power demands of EOP and MOP, respectively; ηEOP and ηMOP are the total efficiencies of EOP and MOP, respectively. Firstly, different sizes of MOP are selected in the simulation. According to the flow-based control strategy, the insufficient oil flow will be supplied by the EOP, thus its power depends on the displacement of the selected MOP.
Figure 7 shows the simulation results of energy consumption for different combinations of EOP and MOP in different driving cycles. Because each driving cycle has a different driving distance and speed–time profile, the total energy consumption for a specific displacement of MOP varies in different driving cycles. However, there is a minimum energy consumption point on each curve. It can be seen in the US-race cycle, the minimum point appears at the 4 mL displacement of MOP. In other cycles, the minimum energy consumptionpoint locates at the 7 mL displacement of MOP. The reason is that compared with other cycles, the US-race cycle has a higher acceleration and driving speed. The engine normally runs in the high speed range. A big size of MOP will consume much energy. Therefore, the US-race cycle tends to have a smaller MOP in terms of energy consumption. On the contrary, when driving in cities or at a relative low engine speed, the transmission tends to have a bigger MOP. Meanwhile, in all driving cycles, only one big MOP in current transmission has the largest energy loss. Although applying only one EOP can reduce this energy loss, it is also not the best choice, as shown in Fig. 7.
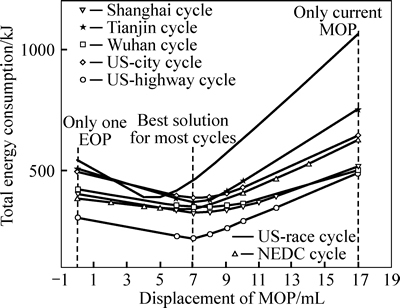
Fig. 7 Energy consumption for different combinations of MOP and EOP in different driving cycles
In most of the driving cycles, especially when driving in cities, the simulation results show that a 7 mL displacement of MOP contributes most to the fuel economy. Even in the US-highway cycle, a 7 mL displacement of MOP is also the best choice for the 8-speed automatic transmission. Therefore, a 7 mL displacement of MOP is selected in the newly-designed two-pump system. Compared with only one MOP in the current design, Fig. 8 shows the percentage of the energy consumption in each driving cycle when applying onlyone EOP or a two-pump system with a 7 mL displacement of MOP.
The power demand of the EOP, PEOP, corresponding to a certain displacement of MOP is also calculated in the forward driving simulation. It can give us a reference for the selection of the EOP power rating. For example, Fig. 9 shows the power demand of the EOP in the NEDC driving cycle corresponding to the selected 7 mL displacement of MOP. In this driving cycle, the maximum power demand of EOP is 330 W.
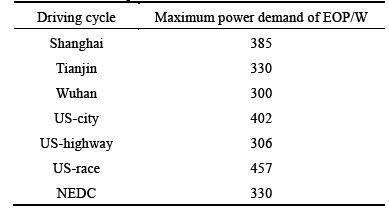
Table 2 depicts the maximum power demand of EOP in some driving cycles for the selected 7 mL displacement of MOP. In order to satisfy all the driving conditions, a peak power of 600 W EOP is selected in the design.
5 Control strategies of EOP and on- coming clutch for start–stop function
The selected EOP should also satisfy the flow requirement of the start–stop function. As shown in Fig. 10, the detailed control strategies for the start–stop function can be divided into three phases.
5.1 Engine stop phase
In this phase, the engine is off during vehicle standing still. Both brake B1 and clutch C4 are engaged for the preparation of the first gear. Their pressures are just a little larger than those of their kiss-points. This can reduce the line pressure demand, thus the EOP can work at a low speed to keep a low line pressure for the compensation of the leakage. Meanwhile, clutch C1 is open to disconnect the engine from the driveline. It is the on-coming clutch in the start–stop function.
5.2 Starter traction phase
When the brake pedal of the vehicle is released, the engine control unit judging the vehicle will start, thus the motor starter cranks the engine to the idle speed in a short time. Before the engine speed reaches the idle speed, the EOP must quickly build up a high line pressure to ensure a sufficient positive engagement of brake B1 and clutch C4. Therefore, the EOP speed increases immediately after this phase begins to deliver enough oil flow for this high line pressure.
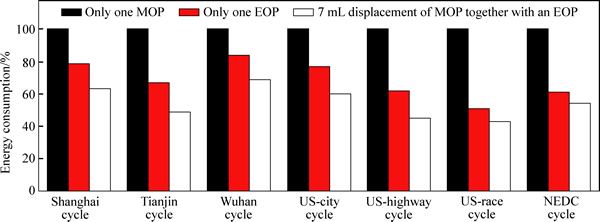
Fig. 8 Comparison of energy consumption in different driving cycles
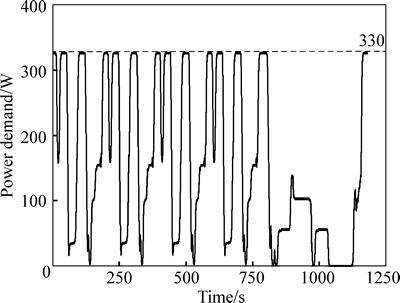
Fig. 9 Power demand of EOP in NEDC driving cycle
Table 2 Maximum power demand of EOP
Besides, the on-coming clutch C1 starts being filled in this phase. Therefore, the flow requirement for the EOP should also include the oil filling for clutch C1 within the predefined time. The hydraulic line pressure should not drop too much when clutch C1 is being filled.
5.3 Driveline connecting phase
In above two phases, the starter restarts the engine without vehicle load because the on-coming clutch C1 is open. It is fast filled by a triangle pressure command for the preparation of the torque delivering. After entering into the driveline connecting phase, the pressure of clutch C1 will increase to reduce its slip. In order to get a smooth and quick engaging process, this phase is again divided into three stages.
1) I stage: The purpose of this stage is to ensure the decrease of the clutch slip. Its end flag can be tuned by calibrating a predefined speed value nI. During this stage, the pressure of clutch C1 increases quickly to reduce its slip even though the engine speed increases fast when the driver kicks down the driving pedal. The pressure calculation in each time step is expressed by Eq. (22). It includes an open-loop control based on the gradient of pressure increase and a closed-loop PI control based on the desired clutch slip.

 (22)
(22)
where pc1(ti) is the clutch pressure in time step i; n(ti) is the actual clutch slip in time step i; ntarget(ti) is the target slip in time step i; Δpc1_I is the pressure changing rate in I stage; KpI is the proportional gain in the closed-loop PI control for the clutch slip; KiI is the integral gain in the closed-loop PI control for the clutch slip.
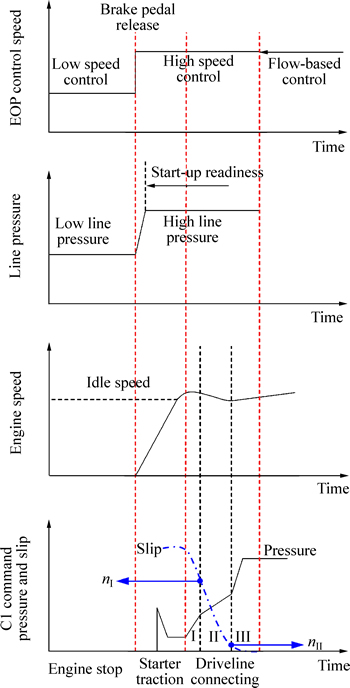
Fig. 10 Control of EOP and on-coming clutch in start–stop function
2) II stage: The purpose of Stage II is to eliminate the clutch slip. Compared with Stage I, the pressure increase of clutch C1 becomes slowly. The reason is a smooth engagement at the end of this stage. The pressure calculation in this stage is similar to Stage I. However, the pressure changing rate and the two gains in the PI control have different values. This stage will end when the clutch slip is smaller than the calibrated small value nII.
3) III stage: In this stage, the on-coming clutch C1 stops slipping. The driveline is finally rigidly connected. The pressure of clutch C1 increases to the line pressure directly in this stage. There is not a closed-loop PI control for the clutch pressure like in Stage I and Stage II. The pressure calculation in each time step is
 (23)
(23)
where △pc1_III is the pressure changing rate in Stage III.
6 Test verification
Driving simulation results give us a minimum loss combination of EOP and MOP. Based on it, the new two- pump system is designed and applied in the 8-speed automatic transmission. Figure 11 shows its 3D model. The EOP is mounted outside the transmission housing. The MOP is located in the original position behind the torque converter and downsized.
The prototype is manufactured and assembled. The developed control strategies for EOP and start–stop function are integrated into the transmission control unit. Figure 12 shows the test vehicle equipped with the8-speed AT. The test data are timely read by the PC through the calibration software CANape.
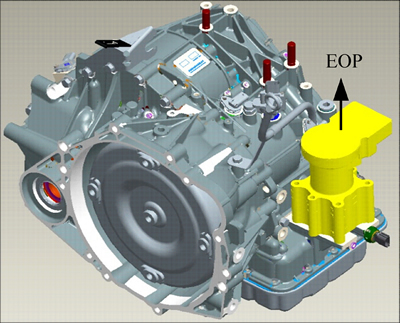
Fig. 11 3D model of 8-speed automotive transmission integrated with EOP

Fig. 12 Test vehicle
Figure 13 depicts the measured oil temperature in the NEDC driving cycle. The ATF temperature rises because of high accelerations and frequent shifts. However, the two-pump system supplies sufficient oil flow for cooling and lubrication under the flow-based control strategy. The oil temperature can be maintained at a normal level between 80 °C and 90 °C during driving. In addition, the durability test has also proven that no parts fail because of heat stress and lack of lubrication oil flow. This two-pump system and the flow-based control strategy of EOP can satisfy the flow requirement.
Figure 14 shows the test results of the vehicle start–stop function. It can be seen when the engine stops, the line pressure is maintained at about 3×10⁵ Pa by the EOP. No noise is heard by the driver because the EOP runs at a low speed. After the driver releases the brake pedal, the EOP quickly increases the line pressure to about 8×10⁵ Pa. The hydraulic system of automatic transmission gets ready for the vehicle start before the motor starter drags the engine to the idle speed. The response of start–stop function thus can be improved.
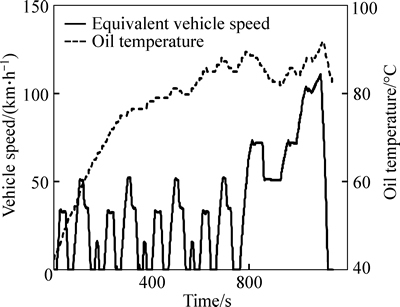
Fig. 13 Oil temperature in test of NEDC driving cycle
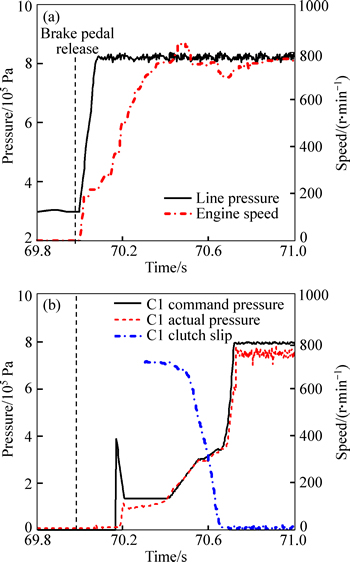
Fig. 14 Test results of vehicle start–stop function
Meanwhile, the on-coming clutch C1 has been fast filled in the starter traction phase. After the engine speed reaches the idle speed, the command pressure firstly fast increases to reduce the clutch slip. The actual clutch pressure can follow the command closely. At this time, clutch C1 starts delivering torque and the vehicle starts moving. After the clutch slip is reduced to a certain level, test results show that the pressure increase obviously becomes slow. Thus, a smooth engagement can be achieved at the final synchronization point. Driver’s subjective feeling in the test is also very positive. A smooth and quick starting performance can be achieved under the control of the developed strategies for the EOP and the on-coming clutch.
7 Conclusions
1) A power loss model is developed to calculate the transmission power loss depending on the engine torque and the engine speed.
2) A leakage model is developed to calculate the hydraulic leakage. Line pressure and tolerance are assumed to be the largest in the calculation.
3) A flow-based control strategy of the EOP is developed to satisfy the flow requirement of cooling, lubrication and leakage. Forward driving simulation verifies this control strategy and shows that there is a best combination for the size of EOP and MOP in terms of minimum energy consumption. Based on the simulation results, a two-pump system with minimum energy consumption (a 7 mL displacement of MOP and a 600 W peak power of EOP) is designed and applied in the 8-speed automatic transmission.
4) Control strategies of the EOP and the on-coming clutch are developed for the start–stop function. Several phases are divided to enable a precise control of the vehicle start.
5) Vehicle test results verify that the flow-based control strategy of the EOP can satisfy the flow requirement. The control strategy of the EOP in the start–stop function can reduce energy loss when engine stops and quickly builds up the hydraulic line pressure before engine starts. The control strategy of the on-coming clutch can achieve a quick and smooth vehicle starting performance in the start–stop function.
References
[1] KOBAYASHI T. New generation of 6 and 8 speed transverse automatic transmission [C]// 12th International CTI Symposium, Automotive Transmissions & HEV and EV Drives. Berlin, 2013: 141–147.
[2] D RR C, HOMM M, INDLEKOFER G. The new automatic transmission 9G-Tronic from Mercedes-Benz [C]// 12th International CTI Symposium, Automotive Transmissions & HEV and EV Drives. Berlin, 2013: 153–160.
[3] HWANG J, JO S, WI T, SON W. Development of two oil pumping system for automatic transmission [R]. SAE Technical Paper, 2014, 1766.
[4] KIM Y, LEE J, JO C, KIM Y, SONG M, KIM J, KIM H. Development and control of an electric oil pump for automatic transmission-based hybrid electric vehicle [J]. IEEE Transactions on Vehicular Technology, 2011, 60(5): 1981–1989.
[5] KIM Y, SONG M, KIM J, LEE H, KIM H. Power-based control of an electric oil pump for an automatic-transmission-based hybrid electric vehicle [J]. Proceedings of the Institution of Mechanical Engineers, Part D: Journal of Automobile Engineering, 2012, 226(8): 1088–1099.
[6] SONG M, OH J, KIM J, KIM Y, YI J, KIM Y, KIM H. Development of an electric oil pump control algorithm for an automatic- transmission-based hybrid electric vehicle considering the gear shift characteristics [J]. Proceedings of the Institution of Mechanical Engineers, Part D: Journal of Automobile Engineering, 2014, 228(1): 21–36.
[7] TOMOMATSU H, TANAKA Y, NAKATANI K, TOMOHIRO T, MATSUBARA T, MIYACHI E, MIURA K. Automatic transmission control system developed for toyota mild hybrid system (THS-M) [R]. SAE Technical Paper, 2002: 1253.
[8] SHUNSUKE Y, TOSHITAKA I, KOICHI F, TOSHIAKI M. Development of the v6 accord hybrid five-speed automatic transmission system [J]. Honda R&D Technical Review, 2005: 14–19.
[9] MIYACHI E, ISHIGURO M, MIZUMOTO K. Development of electric oil pump [R]. SAE Technical Paper, 2006: 1595.
[10] TOYODA F, KOBAYASHI Y, MIURA Y, KOGA Y. Development of variable discharge oil pump [R]. SAE Technical Paper, 2008: 0087.
[11] AHLAWAT R, FATHY H K, LEE B, STEIN J L, JUN D. Modelling and simulation of a dual-clutch transmission vehicle to analyse the effect of pump selection on fuel economy [J]. Vehicle System Dynamics, 2010, 48(7): 851–868.
[12] VDI Richtlinie 2157. Planetengetriebe–Begriffe, Symbole, Berechnungsgrundlagen [S]. Beuth Verlag, Berlin, 2010.
[13] SCHAEFFLER. Technical pocket guide [M]. Schaeffler Technologies GmbH & Co. KG. 1st edition, 2014: 506–507.
[14] ISO/TR 14179-2. Gears-Thermal capacity, Part 2: Thermal load-carrying capacity [S]. First edition, 2001.
[15] LU Xi, WANG Shu-han, LIU Yan-fang, XU Xiang-yang. Application of clutch to clutch gear shift technology for a new automatic transmission [J]. Journal of Central South University, 2012, 19(10): 2788–2796.
[16] WANG Shu-han, XU Xiang-yang, LIU Yan-fang, DAI Zhen-kun, TENBERGE P, QU Wei. Design and dynamic simulation of hydraulic system of a new automatic transmission [J]. Journal of Central South University of Technology, 2009, 16(4): 697–701.
(Edited by YANG Bing)
Foundation item: Project(51405010) supported by the National Natural Science Foundation of China; Project(2011BAG09B00) supported by the National Science and Technology Support Program of China
Received date: 2014-11-24; Accepted date: 2015-04-10
Corresponding author: DONG Peng, PhD; Tel: +86–10–82338121; E-mail: dpgoal@163.com
Abstract: For the purpose of improving efficiency and realizing start–stop function, an electric oil pump (EOP) is integrated into an 8-speed automatic transmission (AT). A mathematical model is built to calculate the transmission power loss and the hydraulic system leakage. Based on this model, a flow-based control strategy is developed for EOP to satisfy the system flow requirement. This control strategy is verified through the forward driving simulation. The results indicate that there is a best combination for the size of mechanical oil pump (MOP) and EOP in terms of minimum energy consumption. In order to get a quick and smooth starting process, control strategies of the EOP and the on-coming clutch are proposed. The test environment on a prototype vehicle is built to verify the feasibility of the integrated EOP and its control strategies. The results show that the selected EOP can satisfy the flow requirement and a quick and smooth starting performance is achieved in the start–stop function. This research has a high value for the forward design of EOP in automatic transmissions with respect to efficiency improvement and start–stop function.
