

J. Cent. South Univ. (2021) 28: 1476-1492
DOI: https://doi.org/10.1007/s11771-021-4711-0

Shear wave velocity in granular soil considering effects of inherent and stress-induced anisotropy
Bayat MEYSAM
Department of Civil Engineering, Najafabad Branch, Islamic Azad University, Najafabad, Iran
 Central South University Press and Springer-Verlag GmbH Germany, part of Springer Nature 2021
Abstract:
The aim of this research was to explain the effects of relative density, mean effective stress, grading characteristics, consolidation stress ratio and initial fabric anisotropy produced during specimen preparation on shear wave velocity (Vs). It is shown that the Vs of the consolidated specimens under anisotropic compression stress is greater than that of the consolidated specimens under isotropic or anisotropic extension stress states at a given relative density and effective confining stress. It is also shown that the depositional technique that was used to create reconstituted specimens has important effect on the Vs. A parallel comparison of measured values from the resonant column and bender element tests is also presented. These results of the tests have been employed to develop a generalized relationship for predicting Vs of granular soils. The Vs model is validated using data collected from literatures. Based on the results, it can be conducted that the proposed model has a good performance and is capable of evaluating the Vs of granular soil.
Key words:
anisotropy; sand; gravel; bender element; resonant column; shear wave velocity��
Cite this article as Bayat MEYSAM. Shear wave velocity in granular soil considering effects of inherent and stress-induced anisotropy [J]. Journal of Central South University, 2021, 28(5): 1476-1492. DOI: https://doi.org/10.1007/ s11771-021-4711-0.
1 Introduction
Shear wave velocity (Vs) is an important geotechnical soil property for design and analysis of geotechnical engineering structures. Vs can also be used to determine the maximum or small-strain (strains on the order of 10-5 or less) dynamic shear modulus (Gmax or G0) of the soil mass. In this range of strain levels, the soil behaviour is usually assumed to be elastic [1, 2]. According to elastic theory, Gmax is normally calculated by measuring Vs, which is related to Gmax by the following relationships:
 (1)
(1)
where �� is the density of soil mass, Gmax or Vs is independent of shear strain level and exhibits its maximum magnitude that can be used as a critical input parameter for multiple constitutive models used to describe seismic response analysis of soil layers, the static and dynamic response of soils, and also as a fundamental soil property for studying various soil-structure interaction problems [1, 3], quality check evaluation of ground modification methods [4], estimating liquefaction potential [1, 5], soil density [6] and seismic hazard parameters [7, 8]. Vs can be easily either obtained by laboratory or in situ testing techniques [9]. The advanced laboratory methods now have been used to measure Vs of soil specimens such as bender element (BE) test [10-12], the quasi-static loading test [13], piezoelectric ring-actuator technique [14] and resonant column (RC) test [15-17].
A bender element as electro-mechanical transducer comprises two layers of piezo-ceramic plates cross-sectionally polarized which allows straightforward wave velocity measurements to be made in soil specimens. Although the strains induced by a bender element test cannot be measured directly, DYVIK et al [18] estimated the maximum shear strain induced by bender element to be less than 10-5 , which is in the elastic strain region and can be considered as nondestructive. In most of the previous studies, BEs are used to determine Vs in the time domain. In the time domain method, an electrical pulse is emitted by a bender element which consists of a pair of piezoceramic plates and the shear wave travel time is determined when the electrical pulse arrives at the receiver bender element. The reliability of BE technique is affected by many factors such as near-field effect, travel distance, boundary effects, specimen geometry and size, cross-talking. Several different approaches have been used for determining the travel time such as the first or peak-to-peak arrival time method (which is often called as time domain method), the frequency domain method, and the cross-correlation method. In the first or peak arrival time method, the first major deflection or peak of the received signal is taken as the shear wave arrival time. The frequency domain method is an alternate method for travel time estimation based on the phase shift between the transmitted and received signals. The cross correlation method is based on the presumption that the transmitted shear wave retains its wave shape. The first arrival time method was applied in this work to estimate the travel time, which is the mostly widely used. Previous studies indicated that velocity obtained from the frequency domain analysis have been found to be slower than those from the time-domain technique even when the applied frequency range is carefully chosen [19-22].
The distance between the transmitter and receiver bender elements is assumed to be the length of travel of the shear wave which is called the tip-to-tip distance (Ltt). Vs is simply calculated as the Ltt divided by the measured travel time (��t), as:
 (2)
(2)
For previous research where bender element tests are used to determine the Vs or Gmax, accurate determination of the ��t in BE tests has long been a critical issue. Many researchers have commented on different interpretation methods for determining ��t. To determine the exact amount of ��t in BE tests is a tricky problem which can be determined as follows:
 (3)
(3)
where tt and tc are the total travel time and the offset time, respectively. The details of evaluating this time delay can be found in Section 2.1. Most difficulties in determining the exact arrival time in BE tests are due to near-field effects. The measurement uncertainty in a BE test due to compression wave interference, inherent complex particle motions, and fabrication deficiencies can lead to an error in the range of 30%-50% [23, 24].
The RC device is the most common lab technique for measuring the low-strain dynamic properties of soils for a strain level ranging from 1��10-6 to 5��10-3 which were conducted under ASTM. Among various laboratory methods for measurement of Vs, the RC device is recognized to be the most reliable due to high reliability. In order to interpret BE test results in previous studies, RC tests are usually performed under the same condition for comparison. The damping ratio in RC tests can be measured based on two methods: the half-power bandwidth method or free-vibration decay [25]. Based on tests results, YOUN et al [26] and GU et al [27] indicated that there is a good agreement between Gmax values from BE and RC tests for sandy soil. LING et al [28] and CAMACHO-TAUTA et al [29] based on the tests results show that the results of RC and BE were consistent with each other. However, SOUTO et al [30] based on the tests results on the granular soils showed that the consistency of the results of BE and RC techniques mainly depended on the grading characteristics of the soils. The uncertainty of the signal interpretation for determining ��t is the main reason for the different results obtained by the BE and RC tests.
Several factors can affect the Vs (or Gmax) of granular and cohesive soils. So far, comprehensive studies have been conducted to describe the factors affecting the Vs (or Gmax). Based on the previous studies, it has been established that mean effective stress (�ҡ�m), void ratio (e), over-consolidation ratio (OCR), cementation, degree of compaction or consolidation, stress history, stress anisotropy, soil fabric, and particle characteristics are the main factors that have significant influence on the Vs (or Gmax). The factors affecting the Vs (or Gmax) of granular soils have been extensively studied over the past years, mainly through laboratory and field experiments [31, 32]. Previous studies have shown that Vs of granular soils is primarily a function of soil��s relative density (Dr) or void ratio (e) and mean effective stress (�ҡ�m) and the widely used empirical equation for estimation of Vs is the one originally empirical equation proposed by HARDIN [33] as:
 (4)
(4)
where F(e) is void ratio function describing effects of e on Vs; A and n are material constants that are, in turn, linked to grain size distribution characteristics. This formulation is widely accepted for the prediction of Vs for all soils.
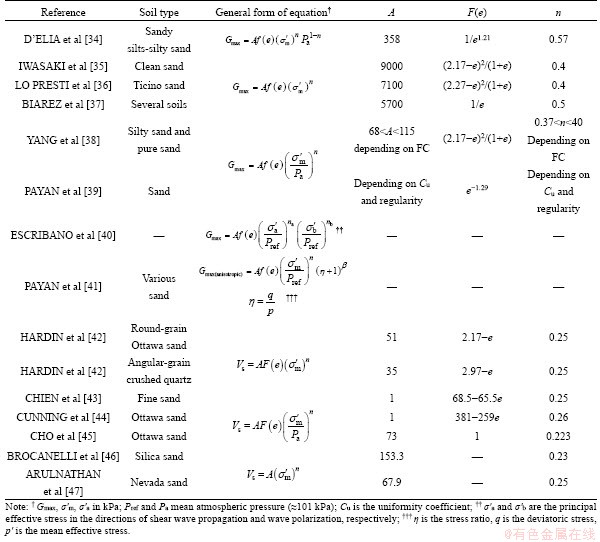
So far, several empirical equations presented in the literatures based on the laboratory tests results relating Vs and Gmax to basic soil characteristics and loading condition that most of these based correlations for estimating Vs or Gmax for granular soils relate them with e and �ҡ�m. Table 1 summarizes a range of void ratio functions and material constants for different granular soils which are presented in the previous studies.
As shown in Table 1, the stress exponent, n, varies from 0.12 to 0.57; and a value of 0.25 was widely used by many geotechnical researchers in this field of study [48]. Also various forms of F(e) that have been proposed by researchers are mainly simple exponential or hyperbolic functions. Based on the experimental studies that have been undertaken on the variety of soils by many researchers, it is recognised that Vs (or Gmax) increases in an exponential manner with �ҡ�m, and decreases with an increase in e. It should be note that there is no universal F(e) that can be used for all granular soils with varying grading and under various stress conditions.
The anisotropy of a granular soil can strongly influence its behaviour which is classified into two components: inherent anisotropy (e.g., due to depositional process) and stress-induced anisotropy. Reconstituted specimens produced by different specimen preparation methods, such as air pluviation (AP), wet tamping (WT), dry tamping (DT), or water sedimentation (WS) are usually used to prepare reconstituted specimens due to the difficulty of obtaining undisturbed specimens of cohesionless soil. Previous studies indicate that specimen preparation method has significant effects on mechanical or cyclic behaviour and liquefaction resistance of granular soils [49]. TATSUOKA et al [50] studied dynamic properties of Toyoura sand specimen��s reconstituted by various preparation methods. Based on the results, it can be conducted that the specimen preparation technique has not important effect on the shear modulus for a wide range of shear strain. However, RASHIDIAN et al [51] indicate that the specimen preparation technique has important effect on Vs values of Toyoura sand, so that the Vs of the specimens prepared by the WT and WS techniques are around 70% higher than those prepared by the AP technique for the specimens with void ratio smaller than 0.87. Vs values of the specimens are almost independent on the specimen preparation technique for the specimens with void ratio larger than 0.87. SELIG et al [52] showed that the Gmax values of the specimens prepared by the WT technique are around 20% more than those prepared by the AP technique for a given condition. GU et al [53] indicated that the Gmax of the specimens prepared by the WT technique from the BE tests are around 14% more than those from the RC test. These observations show that the effect of specimen preparation method on Vs or Gmax may depend on the test technique, soil type, and thus, further study is needed to fully understand this issue.
Table 1 Empirical estimations of shear wave velocity
Most of the previous studies on the Vs or Gmax of granular soils have been done under isotropic consolidation conditions. However, stress conditions of soils in earth structures are generally anisotropic stress conditions due to environmental and geological conditions during the deposition. Stress induced anisotropy in a soil element subjected to complex state of stress can be considered in the laboratory. For example, it may be possible to apply different stresses in two main directions and also switch the direction of the major principal stress in a triaxial test using initial deviator stress. The consolidation stress ratio (Kc) can be used to describe stress induced anisotropy [54]:
 (5)
(5)
 (6)
(6)
where and
and are the vertical and horizontal effective consolidation stresses, respectively. So far, many studies have been done on the effects of stress-induced anisotropy and principal stress rotation on the mechanical behavior of granular material by mean of element testing. ISHIHARA [55] stated that the increase in mean effective stress is the mean reason for increasing resistance of soil specimens under stress-induced anisotropy which is due to an increase in the initial compressive deviator stress. VIGGIANI et al [56] and JOVICIC et al [57] studied the effect of anisotropic stress condition on the Gmax of reconstituted specimens, and reported barely discernible effects. RAMPELLO et al [58] and PAYAN et al [59] investigated the effect of stress induced anisotropic state on Gmax. The results show that the principal stress in the direction of wave propagation has important effect on the Gmax of soil. SUN et al [60] indicated that an increase in Gmax as well as G/Gmax is a result of an increase in initial deviatoric stress under anisotropic compression stress states. ZHOU et al [61] and CHEN et al [62] show that Gmax significantly increases with increase in both effective confining stress and consolidation stress ratio. Despite these research efforts, there is only limited information about Vs or Gmax of granular soil under anisotropic stress conditions, especially in extension mode (i.e., KC>1). Also, there is a lack of comparative studies regarding the effect of relative density, mean effective stress, grading characteristics, induced and fabric anisotropies on the shear wave velocity of granular material.
2 Test apparatus, materials and testing procedure
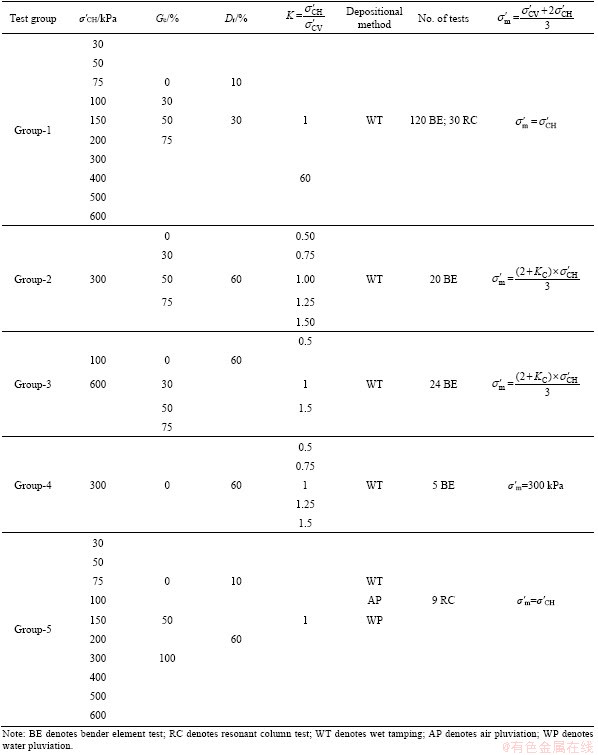
Table 2 shows the experimental programs used in this study that include the RC and BE tests. Group-1 of the tests was performed on four subgroups material under isotropic condition at different Dr and �ҡ�m. The aim of group-1 of the tests was to examine the effect of gravel content (GC, Gc) (GC), Dr and �ҡ�m on Vs and also compare the results of BE and RC. The results of primary tests in group-1 indicate that the results of BE were consistently lower than corresponding results of RC for pure gravel specimens. For this reason, the RC results for pure gravel specimens are used in all test groups. The aim of group-2 and group-3 of the tests was to identify the effect of induced anisotropic on Vs under constant confining stress condition. The aim of group-4 of the tests was to identify the effect of induced anisotropic on Vs under constant mean effective stress condition. Finally, group-5 of the tests was conducted to show the effect of the fabric anisotropy induced by the depositional method.
Table 2 Summary of tests details
2.1 Resonant column and bender element tests
In the current study, a free-free RC apparatus and a pair of BEs (i.e., a transmitter and a receiver) which has been installed in the triaxial apparatus are used to measure the shear wave velocity. In the RC tests, the frequency of excitation starts from a low value, gradually increases until the first mode resonant condition is determined and the phase shift between driving signal and measured acceleration signal recorded by an accelerometer is installed in the cuboidal top mass. The resonant frequency (fr) is a function of the soil properties such as stiffness, the sample geometry and characteristics of the apparatus. Based on boundary condition of RC device, the shear modulus at the shear strain level about of 5��10-5 (i.e., Gmax) can be calculated by:
 (7)
(7)
 (8)
(8)
where h is the height of the soil specimen; �� is the soil density; J, J0 and JL are the mass polar moment of inertia of specimen, the mass at one free and the mass at the other free end respectively and �� is one of the main parameters of RC apparatus.
In the current study, the BE test technique is also used to obtain the Vs of the granular soils. The time domain first arrival method is the simplest and usual method for interpreting BE tests. However, this can be the cause of much uncertainty [63]. For the input signal, the arrival point of the s-wave front can be masked by faster travelling p-wave components (so-called near-field effect) which can change the shape of received signal. In the current study, however, the first arrival time of the receiver signal was used. Generally, the measured ��t is greater than the true transmission time across the soil specimen, because of time delay associated with the electronics, ceramics and coating material [64]. Prior to testing, it is essential to calibrate the BE system to obtain true travel time. In this study, the time delay, td, is estimated by putting a pair of bender element (transmitter and receiver) directly in contact without a specimen and measuring the time interval between the transmitter and the receiver BEs. The result indicated that the value of td is equal to 7.80 ��s. True travel time, ��t(s), is determined by subtracting the td from the measured travel time (tt):
 (9)
(9)
2.2 Material and testing procedure
In this study, five different gradations of the gravelly and sandy material were used to study the influence of grading characteristics, consolidation stress ratio, depositional method, relative density and mean effective stress on the Vs of granular soil. A pure sand with a mean grain size of 0.6 mm which is classified as SP according to the unified soil classification system (USCS) and a pure gravel with a maximum particle size of less than 16 mm which is classified as GP according to the USCS are used. Each subgroup of the granular soil is named by the values of its GC. For example, material S-30 has a gravel content of 30%. Grain size distribution curves, the grading characteristics and photos of these five subgroup materials which were composed primarily of quartz are shown in Figure 1(a). The classifications of these five subgroups materials are SP or GP in the USCS. Figure 1(b) shows the emax and emin and the corresponding ��d-max and ��d-min based on gravel content for five subgroups of the soils.
Table 2 summarizes the details of tests programs that carry out on the reconstituted granular specimens which included BE and RC tests. A free-free RC apparatus in which the actuator was mounted on top of the specimen was used to measure the shear wave velocity. The cuboidal top mass (so-called excitation head) was equipped with two electrodynamic exciters, each of which accelerates a small mass. The minishakers made a sinusoidal rotational vibration at the top of the specimen. This acceleration and the resulting acceleration of the top mass were measured with acceleration transducers that were installed in the cuboidal top mass. The bottom end of the specimen was placed on a base plate that was free in rotation during the RC test. A sinusoidal electrical signal was generated by a function generator, amplified, and applied to electrodynamic exciters. The frequency of excitation was varied until the resonant frequency of the system was found. Based on the boundary condition of the RC apparatus and basic dynamic relations, the shear modulus (or shear wave velocity) was calculated.
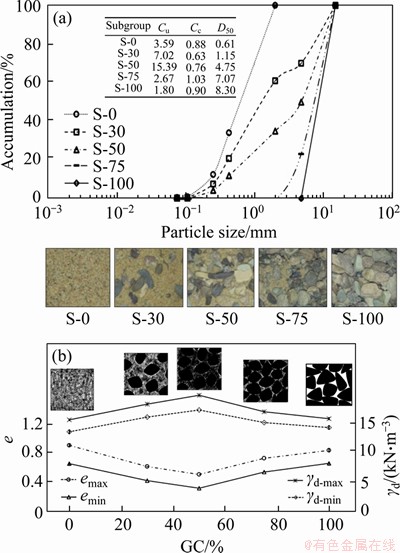
Figure 1 Grain size distribution curves and microstructures of sand-gravel mixtures (a) and maximum and minimum composite void ratios versus gravel content (b)
The BE and RC tests were conducted on the cylindrical granular specimens with a diameter equal to 100 mm, and a height/diameter relation close to 2, which were prepared using wet tamping (WT), water pluviation (WP) or air pluviation (AP) technique. WT method is the oldest laboratory reconstitution technique by which the specimen is formed by static compaction using a metal rod tamper in 10 uniform layers at low moisture content. The under-compaction technique as suggested by SELIG et al [65, 66] was implemented to achieve a more uniform specimen. In WP technique, dry granular soil was put into a funnel and the soil is poured into a mould filled with water. AP technique was the same as WP technique without water. After the specimen was formed with WT, WP or AP technique, the diameter and height of specimen were measured. The specimens have been first subjected by CO2 and then saturated by de-aired water. After specimen saturation, the minimum acceptable Skempton��s B value of 0.95 was obtained, the specimen is consolidated under anisotropic or isotropic consolidation condition.
3 Results and discussion
In the current study, the Gmax or Vs values corresponding to low shear strain levels (�á�10-6) are determined from BE or RC testing. Based on the results of BE and RC tests, the effects of relative density, mean effective stress, induced anisotropy, gravel content and depositional method on the Vs values can be discussed.
3.1 Comparison of BE and RC results
As shown in Table 2, the RC test was performed on some specimens of group-1 to compare the BE test. Figure 2 shows the results of BE tests versus the corresponding results of RC tests (i.e., Vs-BE (Vs of BE test) and Vs-RC (Vs of RC test)) for four subgroups of granular material (S-0, S-30, S-50 and S-75) under isotropic loading condition. Comparison of Vs-BE and Vs-RC shows that the results obtained by both techniques were in acceptable agreement; however, there is a slight difference between the two techniques in the low values of Vs that the values of Vs-BE were consistently lower than the corresponding values of Vs-RC. There are similar findings in previous studies about the comparison between the results of RC and BE tests [18, 67].
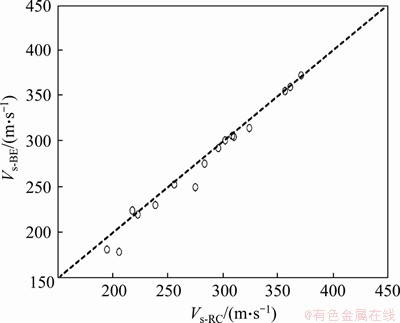
Figure 2 Comparison between Vs results of RC and BE tests
As shown in Table 2, all the values of Vs are based on the results of the BE tests and the results of RC tests only used for anisotropic loading condition under extension mode which lacks the RC test results. Note that this comparison is done only for testing under isotropic conditions (K=1). The results of BE tests show that the first inversion of the received signal for S-100 specimens cannot be clearly identified. In other words, Vs-BE for S-100 specimens were consistently lower than Vs-RC, with significant difference. For this reason, the RC test has only been used in group-5 of the tests which includes pure gravel specimens.
3.2 Results of tests under isotropic consolidation condition
Figure 3 shows the effect of �ҡ�m on the Vs values of the specimens with various gravel content. As expected, the Vs increases as the �ҡ�m increases for a given Dr and GC. As shown in Figure 3, the GC has important effect on the Vs values of the specimens, so that the Vs value increases with an increase in GC up to 50% and then decreases with the increase of GC. In other words, the sand specimen with Gc=50% recorded the highest value of the Vs at a given �ҡ�m and Dr. The results indicate that the effect of GC on Vs is more pronounced under higher levels of mean effective stress. Figure 3 also shows the effect of Dr on the Vs values with various GC. As expected, increasing Dr results in a nonlinear increase in the Vs.
Some specimens with different GC and Dr have the same initial void ratio; the S-30 specimens with Dr=10% and the S-75 specimens with Dr=60% have the same initial void ratio about 0.6 and the S-30 specimens with Dr=60% and the S-50 specimens with Dr=10% have also the same initial void ratio about 0.5. The effect of GC on the Vs values of the specimens with different gravel contents and the same e values are presented in Figure 4. The results indicate that the Vs values of the subgroups of soils are almost independent of GC for a given e value.
3.3 Results of tests under anisotropic consolidation condition
The effect of Kc can be examined from two distinct conditions, under constant mean effective stress (i.e., �ҡ�m is constant and �ҡ�3 depends on Kc) or constant confining effective stress (i.e., �ҡ�3 is constant and �ҡ�m depends on Kc). Most previous researchers investigated the effect of Kc only under constant confining effective stress. Note that all the tests in this section were carried out on the specimens with Dr=60%. Figure 5 indicates the effect of Kc on the Vs of the pure sand specimens under both conditions. Kc=1 represents the isotropic condition and the values of Kc greater or smaller than 1 represents the extension and compression conditions, respectively. The results show that the effect of Kc on the Vs is more pronounced under constant confining effective stress condition than under constant mean effective stress condition. The difference in the measured values of Vs under the two conditions becomes greater when the anisotropy increases. On the other hand, this difference is also more pronounced in compression mode (Kc<1) than in the extension mode (Kc>1).
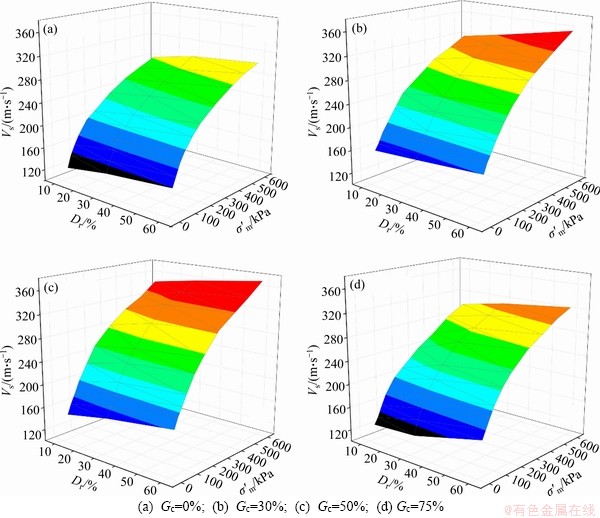
Figure 3 Relationships among Vs, Dr and �ҡ�m under isotropic condition:
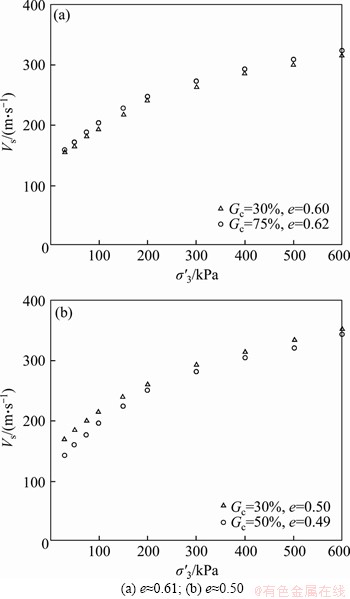
Figure 4 Variation of Vs versus �ҡ�3 for specimens with various gravel contents:
Figure 6 illustrates the effect of Kc on the Vs values of the pure sand specimens under various confining effective stress. As shown from Figure 6, the tests under �ҡ�3=300 kPa were carried out for five values of Kc (0.5, 0.75, 1, 1.25 and 1.5), however, the tests under �ҡ�3=100 and 600 kPa were performed for only three values of Kc (0.5, 1 and 1.5). The results show that increasing Kc results in a decrease in the Vs at all levels of confining effective stress and the effect of Kc on the Vs is almost independent of confining effective stress.
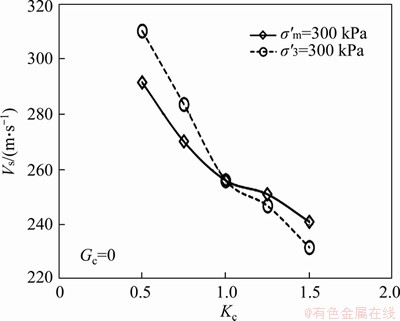
Figure 5 Effect of Kc on Vs of pure sand specimens under both conditions
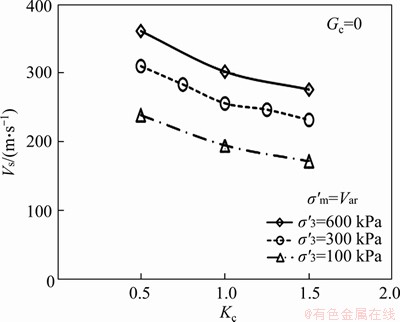
Figure 6 Effect of Kc on Vs for pure sand specimens under different confining effective stress values
The effect of Kc on the Vs in other subgroups has also been studied and the results are presented in Figure 7. The results indicate that the increasing Kc results in a decrease in the Vs in all subgroups. As shown from the results, the difference in the values of Vs in the specimens with different Gc increases due to increasing �ҡ�3 or Kc. On the other hand, adding gravel to the host sand up to 50% under anisotropic condition as well as isotropic condition results in increasing Vs for a given value of Kc and then more addition of gravel (S-75) to the host sand results in decreasing Vs.
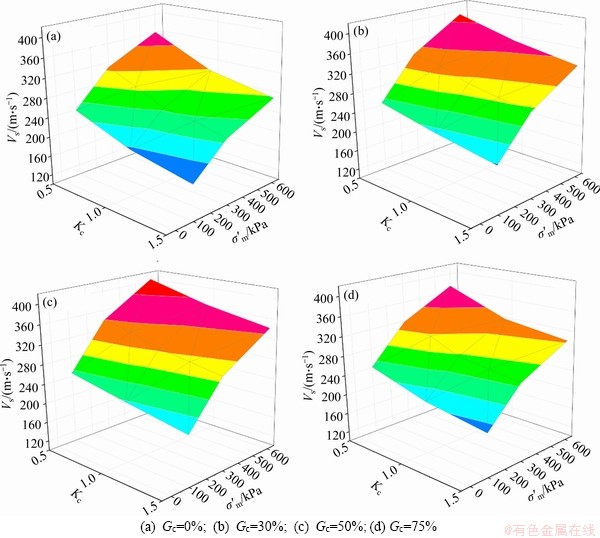
Figure 7 Relationships among Vs, Kc and �ҡ�m under anisotropic condition:
3.4 Effect of initial fabric
In the current study, the effect of initial fabric anisotropy induced by various depositional techniques on the Vs of the granular soils is investigated. To achieve this goal, three techniques, namely, WT, AP and WP are used to prepare the specimens. As shown in Table 2, in this group of the tests, the RC tests were performed on only three subgroups of the soils (S-0, S-50 and S-100).
As shown in Figure 8, depositional techniques have an important effect on the Vs of the granular soil specimens. For each subgroup, Vs reaches its highest or lowest value for the specimen prepared using the WT and WP techniques, respectively. The results of the tests indicate that the specimen containing 50% of gravel has the highest Vs for all depositional techniques. The effect of the depositional techniques on the Vs of the pure sand specimens under various mean effective stress ranging from 20 to 600 kPa and relative densities (10% and 60%) is also investigated. As shown from Figure 9, the effect of the depositional techniques on Vs is almost dependent on the mean effective stress and relative density. In other words, the effect of the depositional techniques on the Vs is more visible at low mean effective stress or relative density levels than large. As expected, for three depositional techniques, increasing mean effective stress or relative density results in increasing of the Vs.
3.5 A new equation for prediction of Vs
Based on the tests results, a general equation for predicting the Vs of granular soils is developed as following:
 (10)
(10)
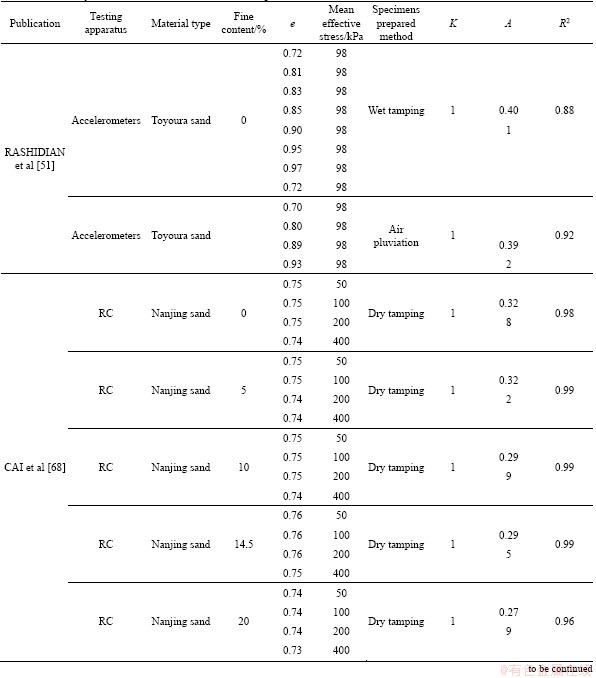
where Vs is the shear wave velocity in m/s; e is the void ratio; �ҡ�m is the mean effective stress in kPa; Kc is the consolidation stress ratio. As seen in Eq. (10), stress exponent, n=0.27 is adopted as a constant value, which is close to the values reported by previous research (see Table 1). It is noteworthy that various empirical void ratio functions presented in Table 1 have been examined, and finally Eq. (10) has the best prediction accuracy with the presented void ratio function. The constant parameters were determined by minimizing the respective error using the Solver add-in with Microsoft Excel. A is a model parameter reflecting particle shape and fabric-dependency of the soil that is primarily affected by depositional technique for reconstituted specimens. In the current study, this parameter is only considered as a function of the depositional technique due to using a given granular soil material in all subgroups. Note that, the A values are calculated using nonlinear least squares analysis and determined in such a way that the sum of the squares of the difference between the measured value and the corresponding predicted value can be minimized. Based on the nonlinear least squares analysis, the values of parameter A are obtained as 0.36, 0.33 and 0.30 for the specimens prepared by WT, AP and WP techniques, respectively. Changes in A values show that the depositional method has a minor effect on the stiffness of granular materials and the stiffness of granular materials is mainly affected by void ratio and mean effective stress. It can be stated that the effect of depositional method is due to the particle configuration, the particle-particle contact, the contact forces, and the microscopic interactions between particles. RASHIDIAN et al [51] studied Toyoura sand prepared with AP and WT techniques, CAI et al [68] studied Nanjing sand containing different fines contents, YOUN et al [26] studied silica and Toyoura sands specimens with different void ratios and ZHOU et al [61] studied rockfill materials which were tested under the anisotropic conditions to validate the ability of the proposed equation (Eq. (10)). Table 3 summarizes and details the sources of data, properties of the specimens and stress condition. The best-fit values of the A parameter for each of the tests group and the corresponding coefficients of determination R2 are listed in Table 3. Figure 10(b) also indicates a plot of predicted and measured values of Vs for the 56 tests detailed in Table 3. As shown, the correlation coefficient between the measured and predicted values is 0.994, which verifies the feasibility of the proposed equation. The maximum error was only 15% for the proposed relationship. The nonlinear least-squares method is also used for the identification of the A parameter. Based on the A parameter values presented in Table 3, it can be concluded that this parameter depends on the size of the soil particles, fine content and depositional technique. Parameter A varied from 0.279 to 0.435 with an average of 0.341. The results for Nanjing sand show that A decreases with increasing fine content. Comparison of A values of rockfill materials with other granular soils indicates that A value increases with increasing average particle size.
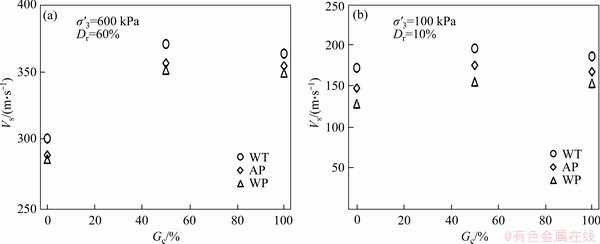
Figure 8 Effect of deposition method on Vs
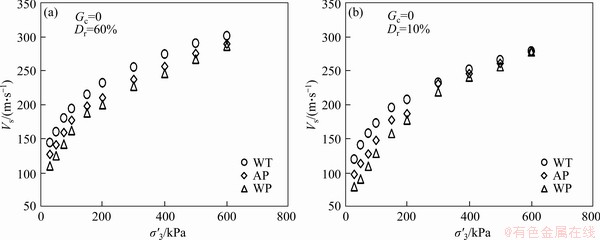
Figure 9 Effect of deposition method on Vs versus �ҡ�3 (a) and Dr (b)
Table 3 Summary of database used to validation Vs equation
Continued
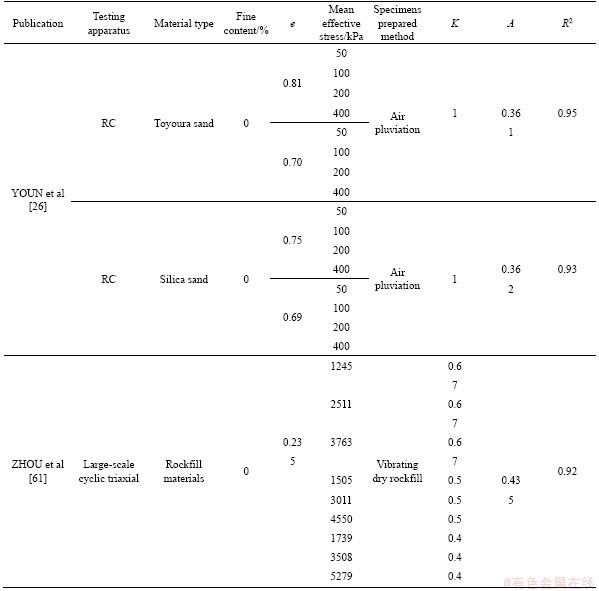
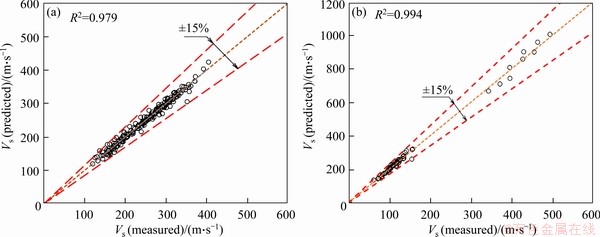
Figure 10 Vs values predicted by Eq. (10) versus measured Vs values in current study (a) and measured Vs values in previous studies (b)
The Vs (measured) values are also compared with the corresponding predicted values by two previous empirical equations. Figure 11 indicates the Vs (measured) versus Vs (predicted) for all 186 data points accumulated from all the tests. The main difference of the two models is the void ratio functions. As shown from the results, the equation presented in Figure 11(b) has a better prediction than the equation presented in Figure 11(a). However, the proposed equation in the current study has a better prediction than the previous empirical equations.
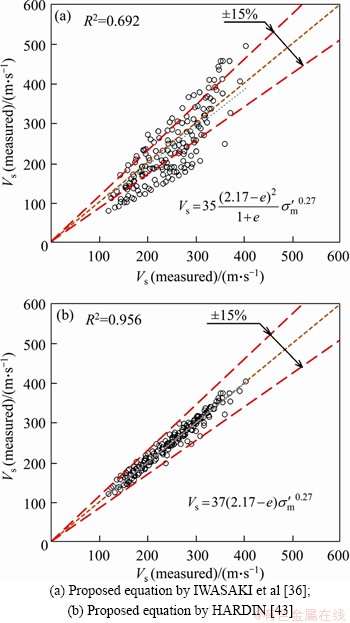
Figure 11 Vs values predicted by previous empirical equations:
In order to check the applicability of the proposed equation, the measured shear wave velocity, Vs (measured), was compared with that predicted by Eq. (10), Vs (predicted) for the all specimens considered in the current study. Figure 10(a) indicates the Vs (measured) versus Vs (predicted) for all 186 data points accumulated from all the tests. The predicted values of Vs of all the specimens are mostly within ��15% of the measured values and the correlation coefficient between the measured and predicted values is 0.979. As shown in Figure 10(a), it can be resulted that the proposed equation can be utilized for predicting Vs of granular soils, quite easily and precisely.
4 Conclusions
In order to investigate the effect of gravel content, relative density, mean effective confining stress, consolidation stress ratio and fabric anisotropic on the shear wave velocity of granular soils, a series of bender element and resonant column tests were carried out on fully saturated specimens. Based on the results, a new equation was developed for prediction of shear wave velocity of granular soil and the following results are obtained.
1) The effects of GC, �ҡ�m and Dr on the Vs of the granular soils are investigated. The results indicate that the Vs increases with an increase in GC up to 50% and then decreases with more increasing of GC. The sand specimen with Gc=50% records the highest value of Vs at a given �ҡ�m and Dr. Increasing �ҡ�m and Dr results in a nonlinear increase in Vs.
2) The effect of Kc on the Vs is investigated based on two states. In the first state, �ҡ�m is constant and �ҡ�3 is dependent on Kc; in the second state, �ҡ�3 is constant and �ҡ�m is dependent on Kc. The results of the tests indicate that the effect of Kc on the Vs is more pronounced under constant confining effective stress condition than under constant mean effective stress condition. The difference in the measured values of Vs in the two states becomes greater when the anisotropy is increased further. On the other hand, this difference is more pronounced in compression mode (Kc<1) than in the extension mode (Kc>1). Nevertheless, in both states, increase of Kc leads to decrease of Vs in all subgroups at all levels of confining effective stress.
3) The effects of initial fabric anisotropy induced by the depositional technique on the Vs of the subgroups of soils (i.e., Gc=0%, 50% and 100%) are investigated. To achieve this goal, three depositional techniques, namely, WT, AP and WP are used. The results of the tests show that depositional technique has an important effect on the Vs of granular soil specimens. For each of the subgroups of soils, Vs reaches its highest or lowest value for the specimen prepared using the WT and WP techniques, respectively. The effect of the depositional technique on the Vs is almost dependent on mean effective stress and relative density and this is more pronounced by decreasing the mean effective stress and relative density levels.
4) In this study, the new empirical equation is presented to estimate the Vs of granular soils as a power function of three variables, void ratio, mean effective stress and consolidation stress ratio with a constant parameter reflecting particle shape, grading characteristics and fabric-dependency of the soil which is primarily affected by depositional technique for a given material. Comparisons between the predictive Vs and the test results of the current study and previously published studies show that Eq. (10) is useful for estimating the Vs of granular soil under isotropic or anisotropic consolidation state.
Conflict of interest
The author declares no competing interests.
References
[1] ABBASZADEH S A, BEHZADAFSHAR K, RAJABLOU R. Verification of a new method for evaluation of liquefaction potential analysis [J]. Arab J Geosci, 2013, 6: 881-892. DOI: 10.1007/s12517-011-0348-x.
[2] CLAYTON C R I. Stiffness at small strain: Research and practice [J]. Geotechnique, 2011, 61: 5-37. DOI: 10.1680/ geot.2011.61.1.5.
[3] LIANG J, HAN B, TODOROVSKA M I, TRIFUNAC M D. 2D dynamic structure-soil-structure interaction for twin buildings in layered half-space II: Incident SV-waves [J]. Soil Dyn Earthq Eng, 2018, 113: 356-390. DOI: 10.1016/ j.soildyn.2018.05.023.
[4] BOUAZZA A, AVALLE D L. Effectiveness of rolling dynamic compaction on an old waste tip [C]// 5th ICEG Environmental Geotechnics: Opportunities, Challenges and Responsibilities for Environmental Geotechnics - Proceedings of the ISSMGE 5th Int Congress. 2006: 384-390.
[5] OZENER P. Estimation of residual shear strength ratios of liquefied soil deposits from shear wave velocity [J]. Earthq Eng Eng Vib, 2012, 11: 461-484. DOI: 10.1007/s11803-012-0134-0.
[6] HUSSIEN M N, KARRAY M. Shear wave velocity as a geotechnical parameter: An overview [J]. Can Geotech J, 2016, 53: 252-272. DOI: 10.1139/cgj-2014-0524.
[7] AL-AMRI A, FNAIS M, ABDELRAHMAN K, ABDELMONEIM E, ALQARNI H. New methods to improve the assessment of shear wave velocities and seismic hazard parameters in Jeddah city, western Saudi Arabia [J]. Arab J Geosci, 2016, 9: 1-15. DOI: 10.1007/s12517-015-2297-2.
[8] SALAH M K. Seismic anisotropy structure beneath the southeastern Mediterranean from shear-wave splitting [J]. Arab J Geosci, 2013, 6: 1717-1730. DOI: 10.1007/s12517-011-0480-7.
[9] DAMM J C, LEWIS M R, STOKOE K H, MOORE D P. Comparison of in situ and laboratory shear wave velocity measurements in compacted backfill [J]. Geotech Test J, 2013, 36: 20120140. DOI: 10.1520/GTJ20120140.
[10] GU X Q, YANG J, HUANG M S. Laboratory investigation on relationship between degree of saturation, B-value and P-wave velocity [J]. Journal of Central South University, 2013, 20: 2001-2007. DOI: 10.1007/s11771-013-1701-x.
[11] BAYAT M, GHALANDARZADEH A. Stiffness degradation and damping ratio of sand-gravel mixtures under saturated state [J]. Int J Civ Eng, 2018, 16: 1261-1277. DOI: 10.1007/s40999-017-0274-8.
[12] CHENG Z, LEONG E C. Determination of damping ratios for soils using bender element tests [J]. Soil Dyn Earthq Eng, 2018, 111: 8-13. DOI: 10.1016/j.soildyn.2018.04.016.
[13] EZAOUI A, DI BENEDETTO H. Experimental measurements of the global anisotropic elastic behaviour of dry hostun sand during triaxial tests, and effect of sample preparation [J]. Geotechnique, 2009, 59: 621-635. DOI: 10.1680/geot.7.00042.
[14] KARRAY M, ROMDHAN M B, HUSSIEN M N, ETHIER Y. Measuring shear wave velocity of granular material using the piezoelectric ring-actuator technique (P-RAT) [J]. Can Geotech J, 2015, 52: 1302-1317. DOI: 10.1139/cgj-2014-0306.
[15] EHSANI M, SHARIATMADARI N, MIRHOSSEINI S M. Shear modulus and damping ratio of sand-granulated rubber mixtures [J]. Journal of Central South University, 2015, 22: 3159-3167. DOI: 10.1007/s11771-015-2853-7.
[16] BAYAT M. Universal model forms for predicting the dynamic properties of granular soils [J]. Acta Geodyn Geomater, 2020, 17: 217-227. DOI: 10.13168/agg.2020.0016.
[17] YUAN X, SUN J, SUN R. A modified approach for calculating dynamic shear modulus of stiff specimens by resonant column tests [J]. Earthq Eng Eng Vib, 2006, 5: 143�C150. DOI: 10.1007/s11803-006-0472-x.
[18] DYVIK R, MADSHUS C. Lab measurements of gmax using bender elements [J]. Publ-Norges Geotek Inst, 1986: 186-196.
[19] HE H, SENETAKIS K. A study of wave velocities and poisson ratio of recycled concrete aggregate [J]. Soils Found, 2016, 56: 593-607. DOI: 10.1016/j.sandf.2016.07.002.
[20] GREENING P D, NASH D F T. Frequency domain determination of G0 using bender elements [J]. Geotech Test J, 2004, 27: 288-294. DOI: 10.1520/gtj11192.
[21] DA FONSECA A V, FERREIRA C, FAHEY M. A framework interpreting bender element tests, combining time-domain and frequency-domain methods [J]. Geotech Test J, 2009, 32: 91-107. DOI: 10.1520/GTJ100974.
[22] ALVARADO G, COOP M R. On the performance of bender elements in triaxial tests [J]. Geotechnique, 2012, 62: 1-17. DOI: 10.1680/geot.7.00086.
[23] LEE J S, SANTAMARINA J C. Bender elements: Performance and signal interpretation [J]. J Geotech Geoenvironmental Eng, 2005, 131: 1063-1070. DOI: 10.1061/(ASCE)1090-0241(2005)131:9(1063).
[24] MONTOYA B M, DEJONG J T, BOULANGER R W. Dynamic response of liquefiable sand improved by microbial-induced calcite precipitation [J]. Geotechnique, 2013, 63: 302-312. DOI: 10.1680/geot.SIP13.P.019.
[25] KHAN Z, EL NAGGAR M H, CASCANTE G. Frequency dependent dynamic properties from resonant column and cyclic triaxial tests [J]. J Franklin Inst, 2011, 348: 1363-1376. DOI: 10.1016/j.jfranklin.2010.04.003.
[26] YOUN J U, CHOO Y W, KIM D S. Measurement of small-strain shear modulus Gmax of dry and saturated sands by bender element, resonant column, and torsional shear tests [J]. Can Geotech J, 2008, 45: 1426-1438. DOI: 10.1139/T08-069.
[27] GU X, YANG J, HUANG M. Laboratory measurements of small strain properties of dry sands by bender element [J]. Soils Found, 2013, 53: 735-745. DOI: 10.1016/ j.sandf.2013.08.011.
[28] LING H I, CALLISTO L, LESHCHINSKY D, KOSEKI J. Soil stress-strain behavior: Measurement, modeling and analysis [C]// International Conference on Geotechnical Symposium. Rome, Italy: Springer Verlag. 2006.
[29] CAMACHO-TAUTA J. Shear modulus reduction curves of Guayuriba sands by cyclic triaxial and bender element tests [C]// Third Int Conf Geotech Constr Mater Environ Nagoya. Japan, 2013: 3-9. DOI: 10.13140/2.1.3915.5842.
[30] SOUTO A, HARTIKAINEN J, OZUDOGRU K. Measurement of dynamic parameters of road pavement materials by the bender element and resonant column tests [J]. Geotechnique, 1994, 44: 519-526. DOI: 10.1680/geot.1994. 44.3.519.
[31] ZHOU Y, SUN Z, CHEN J, CHEN Y, CHEN R. Shear wave velocity-based evaluation and design of stone column improved ground for liquefaction mitigation [J]. Earthq Eng Eng Vib, 2017, 16: 247-261. DOI: 10.1007/s11803-017-0380-2.
[32] CHOO H, BATE B, BURNS S E. Effects of organic matter on stiffness of overconsolidated state and anisotropy of engineered organoclays at small strain [J]. Eng Geol, 2015, 184: 19-28. DOI: 10.1016/j.enggeo.2014.10.022.
[33] HARDIN, B O, BLACK W L. Sand stiffness under various triaxial stresses [J]. J Terramechanics, 1967, 92(2): 27-42. DOI: 10.1016/0022-4898(67)90133-4.
[34] D��ELIA B, LANZO G. Laboratory and field determinations of small-strain shear modulus of natural soil deposits [C]// Earthq Eng 11th World Conf. Acapulco, Mex, 1996: 23-28.
[35] IWASAKI T, TATSUOKA F, TAKAGI Y. Shear moduli of sands under cyclic torsional shear loading [J]. Soils Found, 1978, 18: 39-56. DOI: 10.3208/sandf1972.18.39.
[36] LO PRESTI D C F, PALLARA O, LANCELLOTTA R, ARMANDI M, MANISCALCO R. Monotonic and cyclic loading behavior of two sands at small strains [J]. Geotech Test J, 1993, 16: 409-424. DOI: 10.1520/GTJ10281J.
[37] BIAREZ J, HICHER P Y. Elementary mechanics of soil behaviour: Saturated remoulded soils [M]. Rotterdam, the Netherlands: Balkema, 1994.
[38] YANG J, LIU X, RAHMAN M M, LO R, GOUDARZY M, SCHANZ T. Shear wave velocity and stiffness of sand: The role of non-plastic fines [J]. Geotechnique, 2018, 68: 931-934. DOI: 10.1680/jgeot.16.D.006.
[39] PAYAN M, SENETAKIS K, KHOSHGHALB A, KHALILI N. Characterization of the small-strain dynamic behaviour of silty sands; contribution of silica non-plastic fines content [J]. Soil Dyn Earthq Eng, 2017, 102: 232-240. DOI: 10.1016/j.soildyn.2017.08.008.
[40] ESCRIBANO D E, NASH D F T. Changing anisotropy of G0 in Hostun sand during drained monotonic and cyclic loading [J]. Soils Found, 2015, 55: 974-984. DOI: 10.1016/j.sandf. 2015.09.004.
[41] PAYAN M, SENETAKIS K, KHOSHGHALB A, KHALILI N. Characterization of small-strain shear modulus of sands subjected to anisotropic states of stress [J]. Poromechanics 2017-Proc 6th Biot Conf Poromechanics, 2017: 913-920. DOI: 10.1061/9780784480779.113.
[42] HARDIN B O, RICHART F E J. Elastic wave velocities in granular soils [J]. J Soil Mech Found Div ASCE, 1963, 89: 33-65.
[43] CHIEN L K, OH Y N. Influence of fines content and initial shear stress on dynamic properties of hydraulic reclaimed soil [J]. Can Geotech J, 2002, 39: 242-253. DOI: 10.1139/t01-082.
[44] CUNNING J C, ROBERTSON K, SEGO D C. Shear wave velocity to evaluate in situ state [J]. Can Geotech J, 1995, 32: 848-858.
[45] CHO G C, DODDS J, SANTAMARINA J C. Particle shape effects on packing density, stiffness, and strength: Natural and crushed sands [J]. J Geotech Geoenvironmental Eng, 2006, 132: 591-602. DOI: 10.1061/(ASCE)1090-0241(2006)132: 5(591).
[46] BROCANELLI D, RINALDI V. Measurement of low-strain material damping and wave velocity with bender elements in the frequency domain [J]. Can Geotech J, 1998, 35: 1032-1040. DOI: 10.1139/t98-058.
[47] ARULNATHAN R, BOULANGER R W, RIEMER M F. Analysis of bender element tests [J]. Geotech Test J, 1998, 21: 120-131. DOI: 10.1520/gtj10750j.
[48] BUI M T. Influence of some particle characteristics on the small strain response of granular materials [D]. Southampton, UK: University of Southampton, 2009.
[49] HUANG A B I N, CHANG W J, HSU H H, HUANG Y J. A mist pluviation method for reconstituting silty sand specimens [J]. Eng Geol, 2015, 188: 1-9. DOI: 10.1016/j.enggeo. 2015.01.015.
[50] TATSUOKA F, IWASAKJI T, YOSIDA S, FUKUSHIMA S, SUDO H. Shear modulus and damping by drained tests on clean sand specimens reconstituted by various methods [J]. Soils Found, 1979, 19: 39-54. DOI: 10.3208/sandf1972.19. 39.
[51] RASHIDIAN M, ISHIHARA K, KOKUSHO T, KANATANI M, OKAMOTO T. Effect of sample preparation methods on shear wave velocity [C]// Proc Second Int Conf Seismol Earthq Eng. Teheran, Iran, 1995: 1501-1508.
[52] SELIG E, ALBA P, BALDWIN K, JANOO V, ROE G, CELIKKOL B. Elastic-wave velocities and liquefaction potential [J]. Geotech Test J, 1984, 7: 77-88. DOI: 10.1520/ gtj10596j.
[53] GU X, YANG J, HUANG M, GAO G. Bender element tests in dry and saturated sand: Signal interpretation and result comparison [J]. Soils Found, 2015, 55: 951-962. DOI: 10.1016/j.sandf.2015.09.002.
[54] BAYAT M, GHALANDARZADEH A. Modified models for predicting dynamic properties of granular soil under anisotropic consolidation [J]. Int J Geomech, 2020, 20: 1-15. DOI: 10.1061/(ASCE)GM.1943-5622.0001607.
[55] ISHIHARA K. Soil behaviour in earthquake geotechnics [M]. vol. 34. Clarendon Press, 1997. DOI: 10.5860/choice.34-5113.
[56] VIGGIANI G, ATKINSON J H. Stiffness of fine-grained soil at very small strains [J]. Geotechnique, 1995, 45: 249-265. DOI: 10.1680/geot.1995.45.2.249.
[57] JOVICIC V, COOP M R. The measurement of stiffness anisotropy in clays with bender element tests in the triaxial apparatus [J]. Geotech Test J, 1998, 21: 3-10. DOI: 10.1520/gtj10419j.
[58] RAMPELLO S, VIGGIANI G M B, AMOROSI A. Small-strain stiffness of reconstituted clay compressed along constant triaxial effective stress ratio paths [J]. Geotechnique, 1997, 47: 475-489. DOI: 10.1680/geot.1997.47.3.475.
[59] PAYAN M, KHOSHGHALB A, SENETAKIS K, KHALILI N. Small-strain stiffness of sand subjected to stress anisotropy [J]. Soil Dyn Earthq Eng, 2016, 88: 143-151. DOI: 10.1016/ j.soildyn.2016.06.004.
[60] SUN J, GONG M, TAO X. Dynamic shear modulus of undisturbed soil under different consolidation ratios and its effects on surface ground motion [J]. Earthq Eng Eng Vib, 2013, 12: 561-568. DOI: 10.1007/s11803-013-0197-6.
[61] ZHOU W, CHEN Y, MA G, YANG L, CHANG X. A modified dynamic shear modulus model for rockfill materials under a wide range of shear strain amplitudes [J]. Soil Dyn Earthq Eng, 2017, 92: 229-238. DOI: 10.1016/j.soildyn.2016.10.027.
[62] CHEN G X, ZHOU Z L, SUN T, WU Q, XU L Y, KHOSHNEVISAN S, LING D S. Shear modulus and damping ratio of sand�Cgravel mixtures over a wide strain range [J]. J Earthq Eng, 2019, 23: 1407-1440. DOI: 10.1080/13632469.2017.1387200.
[63] ARROYO M. Pulse tests in soil samples [D]. UK, Arulnathan: University of Bristol, 2001. DOI: 10.13140/2.1.3249.9848.
[64] BRIGNOLI E G M, GOTTI M, STOKOE K H. Measurement of shear waves in laboratory specimens by means of piezoelectric transducers [J]. Geotech Test J, 1996, 19: 384-397. DOI: 10.1520/gtj10716j.
[65] LADD R S. Preparing test specimens using undercompaction [J]. Geotechnical Testing Journal,1978, 1(1): 16-23.
[66] MALEKI M, BAYAT M. Experimental evaluation of mechanical behavior of unsaturated silty sand under constant water content condition [J]. Eng Geol, 2012, 141-142: 45-56. DOI: 10.1016/j.enggeo.2012.04.014.
[67] CAMACHO-TAUTA J F, REYES-ORTIZ O J, ALVAREZ J D J. Comparison between resonant-column and bender element tests on three types of soils [J]. DYNA Journal, 2013, 80: 163-172.
[68] CAI Y, DONG Q, WANG J, GU C, XU C. Measurement of small strain shear modulus of clean and natural sands in saturated condition using bender element test [J]. Soil Dyn Earthq Eng, 2015, 76: 100-110. DOI: 10.1016/j.soildyn.2014. 12.013.
(Edited by FANG Jing-hua)
���ĵ���
���ڵĺ�Ӧ���յ������ĸ������ԶԿ��������в��ٵ�Ӱ��
ժҪ�������о�������ܶȡ�ƽ����ЧӦ�����ּ����ԡ��̽�Ӧ���Ⱥ���Ʒ�Ʊ������в����ij�ʼ�鹹�������ԶԼ��в��ٶ�(Vs)��Ӱ�졣����������ڸ���������ܶȺ���ЧԼ��Ӧ���£����ڸ�������ѹ��Ӧ���µĹ̽����������ͬ�Ի������������Ӧ��״̬�µĹ̽�������ȣ�����в��ٶȸ��졣ʵ�鷢���Ʊ�������Ʒ�ij��������Լ��в�������ҪӰ�죬���Թ�����������Ԫ��ʵ��IJ���ֵ������ƽ�бȽϣ����ý�����ڽ���һ��Ԥ�����״�������в��ٵĹ����ϵ�������������ݶ�Vsģ�ͽ�����֤�����������ģ�ͱ������ã��ܹ����ۿ���״�����ļ��в��١�
�ؼ��ʣ��������ԣ�ɳ�ӣ�ɳ��������Ԫ���������������в���
Received date: 2020-06-19; Accepted date: 2020-09-15
Corresponding author: Bayat MEYSAM, PhD, Assistant Professor; Tel: +98-3142292647; E-mail: bayat.m@pci.iaun.ac.ir; ORCID: https://orcid.org/0000-0001-5525-5199
Abstract: The aim of this research was to explain the effects of relative density, mean effective stress, grading characteristics, consolidation stress ratio and initial fabric anisotropy produced during specimen preparation on shear wave velocity (Vs). It is shown that the Vs of the consolidated specimens under anisotropic compression stress is greater than that of the consolidated specimens under isotropic or anisotropic extension stress states at a given relative density and effective confining stress. It is also shown that the depositional technique that was used to create reconstituted specimens has important effect on the Vs. A parallel comparison of measured values from the resonant column and bender element tests is also presented. These results of the tests have been employed to develop a generalized relationship for predicting Vs of granular soils. The Vs model is validated using data collected from literatures. Based on the results, it can be conducted that the proposed model has a good performance and is capable of evaluating the Vs of granular soil.
