
J. Cent. South Univ. Technol. (2010) 17: 93-101
DOI: 10.1007/s11771-010-0016-4 ![]()
Fourier and wavelet transformations application to fault detection of induction motor with stator current
LEE Sang-hyuk, WANG Yi-qi (��һ��), SONG Jung-il
School of Mechatronics, Changwon National University, Changwon 641-773, Korea
? Central South University Press and Springer-Verlag Berlin Heidelberg 2010
Abstract:
Fault detection of an induction motor was carried out using the information of the stator current. After synchronizing the actual data, Fourier and wavelet transformations were adopted in order to obtain the sideband or detail value characteristics under healthy and various faulty operating conditions. The most reliable phase current among the three phase currents was selected using an approach that employs the fuzzy entropy measure. Data were trained with a neural network system, and the fault detection algorithm was verified using the unknown data. Results of the proposed approach based on Fourier and wavelet transformations indicate that the faults can be properly classified into six categories. The training error is 5.3��10-7, and the average test error is 0.103.
Key words:
Fourier transformation; wavelet transformation; induction motor; fault detection��
1 Introduction
Fault detection techniques for induction motors were studied by numerous researchers with an objective of reducing the maintenance cost and preventing unscheduled downtimes [1-3]. Faults of an induction motor were classified as bearing faults; coupling and rotor bar faults; and air gap, rotor, end ring, and stator faults [1]. Various measurements were performed for monitoring the motor status and detecting faults. Mechanical vibration or sound was also used; however, the fault detection performance depended on the operator��s skills and experimental ability because of the sensor equipment used for fault detection [3-4]. Hence, it was proposed that a convenient technique to determine a fault involved the use of only current signals because such a technique enabled cost reduction and provided objective data [4-6]. Furthermore, the fault detection approaches for induction motors were classified into analytic and intelligent approaches [1]. The method of extracting frequency characteristics for detecting an air gap fault requires the specifications of an induction motor; furthermore, it was restricted to the limitative fault decision. The fault detection approach via intelligent design has been actively studied through fuzzy logic and neural networks. In addition, fault detection through the neuro-fuzzy approach has also been reported recently by ABBASZADEH et al [7]. In that study, rotor bar fault detection was carried out through wavelet transformation. As compared to a vibration or sound signals, a current signal can be used as representative data because it is independent of the operator��s experience. However, the similarity between the time series signals pertaining to normal operation and a fault makes it difficult to discriminate them from each other. Hence, it is useful to design a fault detection algorithm with both Fourier and wavelet transformations because of their hidden characteristics in the frequency domain. In previous studies, the obtained characteristics of Fourier and wavelet transformations were used to decide whether the operation is normal or a fault has occurred [1, 5]. Furthermore, five cases of fault conditions were decided by a heuristic approach. A neural network system was employed to detect various faults with the help of these characteristics [4]. Specific wavelet details and sidebands of Fourier transformation constitute the characteristics used to decide whether the operating induction motor is healthy or not, and which fault has occurred [7]. In addition, a fuzzy entropy measure was used to select a reliable phase current from three phase currents. For the neural network design, complete bivariate polynomials were used to determine numeric coefficients. In addition, the overfitting problem and simulation time were overcome with this structure.
Various faults of an induction motor were studied. Fourier and wavelet transformations were introduced for the purpose of feature extraction. In addition, fuzzy entropy was adopted so as to obtain reliable results. Furthermore, a neural network system was introduced for fault detection. Test results were discussed and presented.
2 Induction motor faults and feature extrac- tion
2.1 Conventional approaches for various faults
Induction motor faults are categorized by representing the frequencies of the outer bearing race defect, inner bearing race defect, ball defect, and train defect as f=(N/2)fr(1-bdcos ��/dp), f=(N/2)fr[1+bdcos ��/dp], f=(dpfr/bd)[1-(bdcos ��/dp)2], and f=(fr/2)[1-bdcos ��/dp], respectively [1]. Here, fr is the rotational frequency; N is the number of balls; bd and dp are the ball diameter and ball pitch diameter, respectively; and �� is the contact angle of the ball. Stator faults are usually related to insulation failure. In order to analyze the axial flux component of the motor, the frequency components used to detect in the axial flux component are given by [k �� n(1-s)/p]f, where s is the slip; p, the number of pole pairs; f, the main frequency; k = 1, 3; and n = 1, 2, 3, ��, (2p-1). In addition, motor current signature analysis (MCSA) is performed in order to detect broken bar faults; its sideband components are obtained by fb = (1 �� 2s)f. Air-gap eccentricity is finally classified. There are two types of air-gap eccentricities, namely, the static and the dynamic air-gap eccentricities. Static eccentricity may be caused by the ovality of the stator core or by the incorrect positioning of the rotor or stator at the commissioning stage. Dynamic eccentricity is caused by several factors such as a bent rotor shaft and bearing wear or misalignment. Static and dynamic eccentricities can also be detected with MCSA as f=(kR��nd)(1-s)/ (p��nw), where f is the fundamental supply frequency; k= 1, 2, ��; R denotes the number of slots; nd=0 in the case of static eccentricity and nd=1, 2 in the case of dynamic eccentricity [1]; and nw is the order of the stator time harmonics. However, these methods require the specifications of the motor, namely, the rotational and current frequencies.
2.2 Feature extraction technique
Fig.1 illustrates healthy and faulty time series signals. From current signals, it is observed that the classification based on statistical analysis seems difficult. Hence, frequency analysis is appropriate for feature extraction.
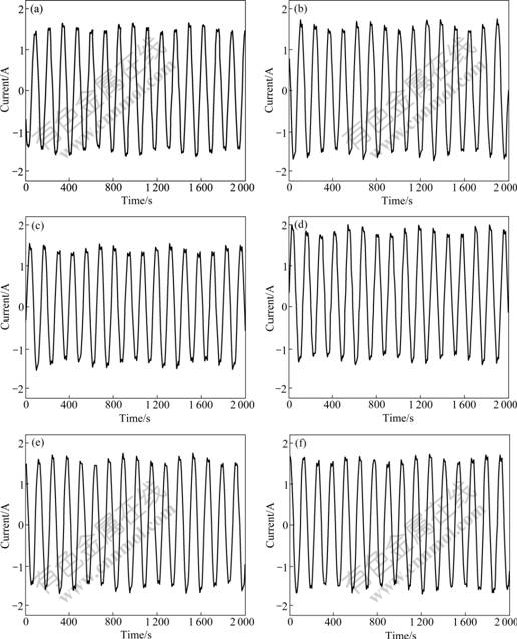
Fig.1 Healthy and five faulted stator current signals under full load: (a) Healthy; (b) Static eccentricities; (c) Dynamic eccentricities; (d) Faulty bearing; (e) Bowed rotor bar; (f) Broken rotor bar
For discrete signals, discrete Fourier transformation (DFT) is applied. Let t be the sampling time; sample sequences x(nt)=x(0), x(1), ��, x[(N-1)t] are represented. The Fourier transformation of x(nt) has the sequences of {X(k)}. DFT satisfies
![]()
![]() (1)
(1)
Hence, DFT represents N periodic functions. The Fourier transformation shown in Fig.1 is illustrated in Fig.2. In Fig.2, the distinctive sideband of DFT in the case of a broken rotor bar can be observed. Fourier transformation can be utilized for detecting the broken rotor bar fault among all possible failures because other cases do not show a sideband.
Wavelet transformation was used to analyze continuous or discrete signals [8-9], which overcomes the shortcomings of window Fourier transformation. In particular, it has an advantage over nonstationary signal analysis. In wavelet transformation, the difference of information between two approximations at resolutions 2j+1 and 2j is extracted by decomposing the function in a wavelet orthonormal basis. In Refs.[8�C9], it was found that the family of orthonormal basis of two-dimensional Lebesgue space with real coefficients L2(R) was defined as
{��j, k}j, k��Z = {2j/2��(2jx-k)} (2)
where Z is integer, and ��j, k is the orthogonal basis. The discrete wavelet transformation of a signal f(x) is obtained by the inner product as follows:
![]() (3)
(3)
where ![]() is the complex conjugate of the orthogonal basis. Now, the procedure for obtaining the signal approximation and using multiresolution analysis is illustrated. For space
is the complex conjugate of the orthogonal basis. Now, the procedure for obtaining the signal approximation and using multiresolution analysis is illustrated. For space ![]() , let
, let ![]() be the scale function; then,
be the scale function; then, ![]() is the orthonormal basis for the space
is the orthonormal basis for the space ![]() It is known that for any n��Z, the function
It is known that for any n��Z, the function ![]() is a member of
is a member of ![]() that is included in
that is included in ![]() The approximation of the signal f(x) at resolution 2j,
The approximation of the signal f(x) at resolution 2j, ![]() is characterized by the set of inner products
is characterized by the set of inner products
![]() (4)
(4)
Eq.(4) is the discrete approximation of signal f(x) at resolution 2j. Next, the extraction of the difference of information between the approximations of function f(x) at resolutions 2j and 2j+1 is investigated. The difference

Fig.2 Fourier transforms of signals corresponding to broken rotor bar (a) and static eccentricity (b) faults
of information denotes the detail signal at resolution 2j. The approximations of a signal at resolutions 2j and 2j+1 are equal to the signal��s orthogonal projections on ![]() and
and ![]() respectively [9]. At resolution 2j, signal f(x) is characterized by the set of inner products as follows:
respectively [9]. At resolution 2j, signal f(x) is characterized by the set of inner products as follows:
![]() (5)
(5)
where ![]() is the discrete detail signal at the resolution 2j. After applying the wavelet transformation, the data are inconsistent because of phase discrepancy. Therefore, data synchronization is required to overcome this problem. In addition, noise can be deleted through this preprocessing. Consider the following measured current signal:
is the discrete detail signal at the resolution 2j. After applying the wavelet transformation, the data are inconsistent because of phase discrepancy. Therefore, data synchronization is required to overcome this problem. In addition, noise can be deleted through this preprocessing. Consider the following measured current signal:
![]() (6)
(6)
where fH denotes the healthy signal; DN(t), the faulty signal; and MN(t), the measurement noise. MN(t) is considered to be a white random noise that has a mean of zero. However, the faulted signal DN(t) maintains its character during the entire period. The average value of the measured signal ![]() is obtained as follows:
is obtained as follows:
![]() (7)
(7)
where i = 1, ��, n, fHi(t), and DNi(t) is the function of each period. Preprocessed signals at n=64 are illustrated in Fig.3. It is difficult to classify faults in the time domain for a small-difference case. Hence, Fourier transformation of these signals is performed after their wavelet transformation. In the present experiment, a three-phase induction motor with the following specifications was considered: 220 V, 3 450 r/min, 0.385 kW, 34 slots, 4 poles and 24 rotor bars. The stator currents under the conditions of a faulted bearing, bowed rotor, broken rotor bar, static eccentricity, dynamic eccentricity, and healthy operation are transformed through Fourier and wavelet transformations. Five current detail (CD) signals among 12 details of the signal are illustrated in Fig.4. By computing Eq.(5), detail values are obtained, which represent currents at resolution 2j in time domain. The 4th values of the 6th detail show good pattern to classify six cases. The value of the front gradient is presented in Fig.5. The cases of static eccentricity and the broken rotor bar exhibit similar features; however, this problem can be resolved by using the Fourier transformation results. Table 1 lists the results of wavelet-transformed data. The order of the five faulty and healthy cases is assigned from 1 to 6.

Fig.3 Synchronized healthy and five faulted signals: (a) Faulty bearing; (b) Bowed rotor bar; (c) Broken rotor bar; (d) Healthy operation; (e) Static eccentricities; (f) Dynamic eccentricities
Table 1 The 4th of CD6 values for faulted and healthy operation under full load

Recently, it has been demonstrated that a reliable data acquisition procedure can be established through a design based on fuzzy entropy or a similarity measure. Fuzzy entropy is known as the measure of fuzziness, and a similarity measure is also used to represent the degree of similarity between data. Here, fuzzy entropy is used to select a reliable phase current from the three-phase stator current, and the definition of entropy proposed by LIU [10] is utilized. All notations are the same as those in Ref.[11]. Among the distance measures, the Hamming distance is generally used between fuzzy sets A and B,
![]() (8)
(8)
where the universe of discourse is satisfied by X = {x1, x2, ��, xn}.

Fig.4 Wavelet transform from the 6th to the 10th details (the 4th coefficients maximum and slope values of the 6th detail are used as characteristic values): (a) The 6th detail; (b) The 7th detail; (c) The 8th detail; (d) The 9th detail; (e) The 10th detail

Fig.5 Forward gradient of the 4th values of 6th detail
In the next theorem, fuzzy entropy function of A is induced only crisp set Anear.
Theorem 1: If distance measure d satisfies d(Ac, Bc)=d(A, B), A, B��F(X), then
e(A)=2d{A��Anear, [1]+2d(A��Anear), [0]}-2 (9)
is the fuzzy entropy. Proof can be found in Ref.[12].
Theorem 1 has the simple structure compared with that in Ref.[1]. Another fuzzy entropy is also followed in the next theorem.
Theorem 2: If distance measure d satisfies d(Ac, Bc)=d(A, B), A, B��F(X), then is also fuzzy entropy. Proof can be also found in Ref.[12]. Fuzzy entropy functions in theorems 1 and 2 are used to select the most reliable phase current.
e(A)=2d{(A��Afar), [0]+2d(A��Afar), [1]} (10)
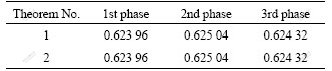
In order to determine which phase current is the most reliable, 50 cycles of Bootstrap method are run and the 4th values of the 6th detail are obtained from 20 data for each phase. The values for the first phase range from 6.866 to 7.100; for the second phase, from 5.000 to 7.160; and for the third phase, from 3.500 to 9.000. With the results of theorems 1 and 2, the entropies of the three-phase currents are listed in Table 2. The results of theorem 1 are the same as those of theorem 2, as shown in Table 2. The first phase current has the smallest entropy value and is hence most reliable.
Table 2 Results of three-phase current entropy (Current/A)
3 Dynamic polynomial neural networks and experimental results
3.1 Dynamical polynomial neural networks (DPNN)
Data classification was studied through various approaches [13-14]. Complete bivariate polynomials were designed for the modeling method that was developed from Kolmogorov-Gabor polynomials represented according to the group method of data handling (GMDH) method [15]. As shown in Fig.6, if two inputs are selected from four inputs, we have 4C2 nodes in layer 1. A node can be expressed with the combination of {x1, x4}, then,
![]()
![]()
For the first layer, five nodes with the minimum error are selected from six nodes. The selected five nodes are used as inputs in the second layer. In the second layer, 10(5C2) nodes are constructed through inputs y1 and y2:
z = f3(y1, y2) =
![]()
In order to determine coefficient wij in DPNN, the least-square method is used, where i=0, 1, 2, ��, n; j=0, 1, 2, ��, k. Obtained wij minimizes the error between the actual measured output and the trained output value.
![]() (11)
(11)
w=(��T��)-1��Tz (12)
where N denotes the number of data values; z(k), the actual measured output; ![]() , the trained output; w, the coefficient vector; and ��, the coefficient matrix. The output of the present layer constructs the next layer input, and finally, a reasonable function is obtained by the iteration of this procedure. A modeling technique with DPNN has advantages of simple structure and fast computation time. Furthermore, the major variable can be detected from the model structure.
, the trained output; w, the coefficient vector; and ��, the coefficient matrix. The output of the present layer constructs the next layer input, and finally, a reasonable function is obtained by the iteration of this procedure. A modeling technique with DPNN has advantages of simple structure and fast computation time. Furthermore, the major variable can be detected from the model structure.
DPNN divides the entire sample data into training and test data by GMDH, which avoids the preponderance of data by using variance. The model structure and the coefficients of each node are obtained from the data sets. In general, coefficients are obtained from training data, and the model performance is evaluated through test data. The final model structure is determined by self-organization that is modified through training and test errors. Furthermore, overfitting exists in DPNN, as in other neural networks. In order to avoid overfitting, DPNN utilizes the performance criterion (PC) to determine the network size and prevent overfitting and ensure costing stability and settlement of training termination. Eq.(13) evaluates whether the constructed model adapts well to the training and test data:
 (13)
(13)
where eA denotes the training error; eB, the test error; nA, the number of training data values; nB, the number of test data values; yi, the measured output; fA, the model constructed from the training data; ��, the weighting factor between eA and eB; ![]() and
and ![]() the training and testing results, respectively. The optimal model is obtained by minimizing PC in Eq.(13). Fig.7 shows the variations in the training error, test error, and PC relative to the layer number. As shown in Fig.7, curve 3 exhibits minimum PC. Therefore, the output of curve 3 gives the optimal performance.
the training and testing results, respectively. The optimal model is obtained by minimizing PC in Eq.(13). Fig.7 shows the variations in the training error, test error, and PC relative to the layer number. As shown in Fig.7, curve 3 exhibits minimum PC. Therefore, the output of curve 3 gives the optimal performance.
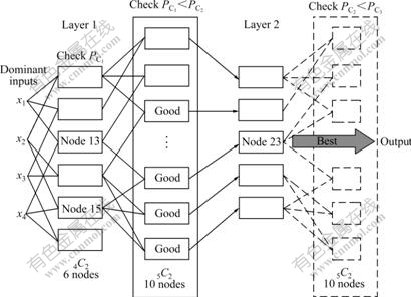
Fig.6 Structure of DPNN, in which two inputs are chosen from four characteristic inputs
3.2 Illustrative exampleInput characteristics were investigated using two wavelet gradient values, one peak value, and three fast Fourier transformation (FFT) sidebands. These characteristics include the wavelet gradients 1 and 2; wavelet peak; and FFT sidebands 1, 2, and 3. Twenty experiments were carried out. Hence, 60 input data are allocated to each case. Training data and test data are divided. Output data correspond to the target values, and the output cases are allocated by the integer number from 1 to 6. These outputs are shown in Table 3. Results for fault detection are listed in Table 4. After training, the training error is found to be 5.3��10-7, and the average total test error is 0.103. These results show that nearly 90% of faults are correctly detected. Hence, the proposed algorithm is applicable.
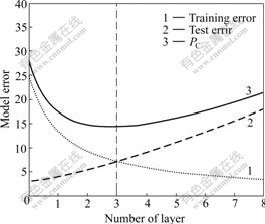
Fig.7 Variation of performance criterion under change of layer
Table 3 Output data for detection
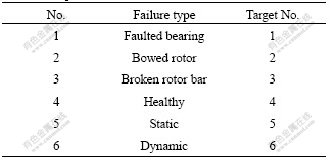
Table 4 Test results for fault detection

References
[1] VAS P. Parameter estimation, condition monitoring, and diagnosis of electrical machines [M]. Oxford: Clarendron Press, 1993.
[2] HAJI M, TOLIYAT H A. Pattern recognition: A technique for induction machines rotor fault detection eccentricity and broken bar fault [C]// Proceedings of the 2001 IEEE Industry Applications Conference. Chicago, 2001: 1572-1578.
[3] NEELAM M, RATNA D. Motor current signature analysis and its applications in induction motor fault diagnosis [C]// Proceedings of the American Conference on Applied Mathematics. Massachusetts, 2008: 442-448.
[4] OLYMPIADA A S, MARIA G I. Induction motors�� faults detection and diagnosis by using dedicated software [J]. Journal of Materials Processing Technology, 2007, 181(1): 313-317.
[5] NEELAM M, RATNA D. An approach of condition monitoring of induction motor using MCSA [J]. International Journal of Systems Applications, Engineering and Development, 2007, 1(1): 13-17.
[6] LEBAROUD A, CLERC G. On-line diagnosis of induction motor faults [C]// Proceedings of the 4th International Conference: Sciences of Electronic, Technologies of Information and Telecommunications. Hammamet, 2007: 1-5.
[7] ABBASZADEH K, MILIMONFARED J, HAJI M, TOLIYAT H A. Broken bar detection in induction motor via wavelet transformation [C]// Proceedings of the 27th Annual Conference of the IEEE Industrial Electronics Society. Denver, 2001: 95-99.
[8] MALLAT S. A Theory for multiresolution signal decomposition: The wavelet representation [J]. IEEE Transaction on Pattern Analysis and Machine Intelligence, 1989, 11(7): 674-693.
[9] MALLAT S. A wavelet tour of signal processing [M]. London: Academic Press, 1999.
[10] LIU Xue-cheng. Entropy, distance measure and similarity measure of fuzzy sets and their relations [J]. Fuzzy Sets and Systems, 1992, 52: 305-318.
[11] FAN Jiu-lun, MA Yuan-liang, XIE Wei-xin. On some properties of distance measures [J]. Fuzzy Set and Systems, 2001, 117(3): 355-361.
[12] LEE S H, CHUN S P, KIM J H. Measure of certainty with fuzzy entropy function [J]. Lecture Note in Computer Science, 2006, 4114: 134-139.
[13] MARTINEZ W L, MARTINEZ A R. Computational statistics handbook with Matlab [M]. Florida: Chapman and Hall/CRC, 2002.
[14] BAO Zhe-jing, ZHONG Wei-min, PI Dao-ying, SUN You-xian. Robustly stable model predictive control based on parallel support vector machines with linear kernel [J]. Journal of Central South University of Technology, 2007, 14(5): 701-707.
[15] PNADYA A S, GIBAR T C, KIM K B. Neural network training using GMDH type algorithm [J]. International Journal of Fuzzy Logic and Intelligent Systems, 2005, 5(1): 52-58.
Foundation item: Project supported by the Second Stage of Brain Korea 21 Projects
Received date: 2009-03-28; Accepted date: 2009-06-24
Corresponding author: SONG Jung-il, PhD, Professor; Tel: +82-55-213-3606; E-mail: jisong@changwon.ac.kr
(Edited by CHEN Wei-ping)
Abstract: Fault detection of an induction motor was carried out using the information of the stator current. After synchronizing the actual data, Fourier and wavelet transformations were adopted in order to obtain the sideband or detail value characteristics under healthy and various faulty operating conditions. The most reliable phase current among the three phase currents was selected using an approach that employs the fuzzy entropy measure. Data were trained with a neural network system, and the fault detection algorithm was verified using the unknown data. Results of the proposed approach based on Fourier and wavelet transformations indicate that the faults can be properly classified into six categories. The training error is 5.3��10-7, and the average test error is 0.103.
