

J. Cent. South Univ. (2020) 27: 1587-1598
DOI: https://doi.org/10.1007/s11771-020-4392-0

Catastrophe theory-based risk evaluation model for water and mud inrush and its application in karst tunnels
ZHU Jian-qun(�콨Ⱥ)1, LI Tian-zheng(������)2
1. School of Civil Engineering and Architecture, Changzhou Institute of Technology,Changzhou 213002, China;
2. School of Civil Engineering, Central South University, Changsha 410075, China
 Central South University Press and Springer-Verlag GmbH Germany, part of Springer Nature 2020
Abstract:
This paper presents a risk evaluation model of water and mud inrush for tunnel excavation in karst areas. The factors affecting the probabilities of water and mud inrush in karst tunnels are investigated to define the dangerousness of this geological disaster. The losses that are caused by water and mud inrush are taken into consideration to account for its harmfulness. Then a risk evaluation model based on the dangerousness-harmfulness evaluation indicator system is constructed, which is more convincing in comparison with the traditional methods. The catastrophe theory is used to evaluate the risk level of water and mud inrush and it has great advantage in handling problems involving discontinuous catastrophe processes. To validate the proposed approach, the Qiyueshan tunnel of Yichang-Wanzhou Railway is taken as an example in which four target segments are evaluated using the risk evaluation model. Finally, the evaluation results are compared with the excavation data, which shows that the risk levels predicted by the proposed approach are in good agreements with that observed in engineering. In conclusion, the catastrophe theory-based risk evaluation model is an efficient and effective approach for water and mud inrush in karst tunnels.
Key words:
risk evaluation model; water and mud inrush; catastrophe theory; karst area; tunneling��
Cite this article as: ZHU Jian-qun, LI Tian-zheng, YANG Xiao-li. Catastrophe theory-based risk evaluation model for
water and mud inrush and its application in karst tunnels [J]. Journal of Central South University, 2020, 27(5): 1587-1598. DOI: https://doi.org/10.1007/s11771-020-4392-0.
1 Introduction
Studies on the geological disaster of water and mud inrush in tunnel projects of karst areas have been one of the most concerned and cutting-edge issues in the industry. It is of great significance for safe construction and disaster prevention and mitigation in major engineering fields, such as railway, highway, water conservancy and hydropower. With the gradual expansion of the western development strategy, the tunnel construction will inevitably encounter all kinds of severe challenges, such as complex topography, adverse geological conditions, especially the occurrence of water and mud inrush, which greatly threatens the security of underground construction and seriously retards the pace of national infrastructure construction [1]. Currently, scholars at home and abroad have done a lot research about the risk evaluation for water and mud inrush in karst tunnels, but there still exist some shortcomings which can be generally attributed to the following two categories. For research contents, the risk of water and mud inrush in karst tunnels is determined by two aspects, the dangerousness and harmfulness, which respectively mean the possibilities of the disaster and the losses due to it.
However, most studies have a detailed and in-depth analysis about the dangerousness of the tunnel water and mud inrush, but do little about the harmfulness of the disaster. For research methods, what are mainly adopted includes expert judgment method [2], analytic hierarchy process (AHP) [3], fuzzy mathematics [4], neural network model [5], etc. However, in these methods, there widely exist the issues of strong subjectivity, being oversimplified and deviating from the actual situations. For example, the expert judgment method and AHP need to determine the weight of each indicator in advance. The determination processes are mostly involved with ��Expert Scoring��, which has strong subjectivity. Neural network model, which is achieved by means of numerical algorithms, is generally applicable to continuous and gradual processes, but has trouble in simulating the catastrophe processes. In fact, under complex conditions water and mud inrush in karst tunnels is affected by many factors, so it is very difficult to give the relative weight of each indicator by subjective judgment. The disaster is actually a catastrophe process from scratch, which changes by leaps and bounds from one state to an essentially different one. These make the above models deviate from the actual situations to some extent, greatly reducing the credibility of the evaluation results.
In view of those, with in-depth analyses of the factors on the geological disaster of water and mud inrush in karst tunnels, the dangerousness evaluation indicator system and the harmfulness evaluation indicator system were established respectively. Then they were coupled and optimized to construct the risk evaluation model based on catastrophe theory [6]. Then the catastrophe progression method was used to determine the catastrophe progressions of the system layer by layer, and the risk level of water and mud inrush was evaluated. Finally, the model was applied to the relevant project. It is found that the evaluation results have a high degree of agreement with the actual situations, indicating that the model has a high engineering value.
2 Catastrophe theory
2.1 Basic principle of catastrophe theory
Catastrophe theory was firstly proposed by the French mathematician THOM in 1972 [6]. It is a branch of mathematics to qualitatively study on discontinuous phenomena and catastrophe processes by mathematical tools of topology and singularity theory. Catastrophe theory can be used to understand and predict the behaviors of complex systems, thereby gaining a wide range of applications. Supposing that a state function which is used to describe the state of a system contains a set of parameters, it should get the only extreme value for a stable system. Conversely, when the state function gets two or more extreme values with the change of parameters, it can be considered that under the current parameter combinations the system is in an unstable state. Therefore, by calculating the extreme values of the state function it can be examined whether the system is stable or not.
Suppose the state function of a system is Fuv(x), which has a variable x and two parameters u, v. x is the state variable, namely the body of the catastrophe, and u, v are the control variables, namely the factors which impact the catastrophe. The extreme values of the state function can be obtained by Eq. (1):
 (1)
(1)
For the given values of u, v, one or more values of x can be determined. Thus, the critical point x can be regarded as a function of parameters u, v, namely:
 (2)
(2)
Obviously, such a function is a curved surface in three-dimensional space, which is also the set of all critical points M, namely the critical surface. So, the singularity set S satisfies:
 (3)
(3)
which is a subset of M. Bifurcation point set B is the projection of S which is projected on the control space of the u-v. For a more complex system, the state function may have more than one state variable. This will involve extreme values solving of multivariate functions. The problem becomes more complex, so it will not be elaborated here.
2.2 Typical catastrophe types and fuzzy membership functions
Each catastrophe type [7] corresponds to one state function which determines the characteristics of the system. THOM [6] proves that the state function types of the system do not depend on the number of variables but the parameters, namely control variables. THOM [6] gives the classification theorem of catastrophe theory, indicating that in the nature a large number of discontinuous phenomena can be represented with certain geometric shapes. We live in is a four-dimensional space-time, including three-dimensional space and one- dimensional time, so the control variables of the state function is generally not more than 4. The state functions have no more than seven kinds of types, namely seven catastrophe types, including four kinds of univariate catastrophe types and three kinds of bivariate catastrophe types. The bivariate catastrophe types are very complex and fold catastrophe is too simple, so they are less used. Here we only consider the latter three univariate catastrophe types, namely cusp catastrophe, swallowtail catastrophe and butterfly catastrophe, as shown in Figure 1.
Fuzzy membership function is the core of catastrophe progression method. It is generally derived from the simultaneous equations of critical surface equation F ��(x) and singularity set equation F ��(x). After the elimination of state variable, the bifurcation point set equation of control variables is obtained, by which the corresponding relationships between control variables and state variables can be solved, namely the fuzzy membership functions. Because each control variable is corresponding to the same state variable, the different coefficients of the control variables lead to their different ranges. So, we can control the ranges of all variables in the interval [0, 1] by enlargement or reduction, which does not affect the characteristics of the catastrophe types [9]. The fuzzy membership functions of above three catastrophe types are shown in Table 1, whose graphics in three-dimensional space are shown in Figures 2-5.
It is worth noting that the control variables play a dominant role in the catastrophe model which is determined by the model itself and they have the distinctions of major and minor variables. The order of major and minor variables is u>v in cusp catastrophe model, u>v>w in swallowtail catastrophe model and t>u>v>w in butterfly catastrophe model.
3 Risk evaluation model based on dangerousness-harmfulness evaluation indicator system
3.1 Process of model construction
Catastrophe theory as a new mathematical theory has been widely applied into many fields of science. One common application using catastrophe progression evaluates the system. The overall idea is firstly to decompose the final evaluation objective into a multi-layer structure. Secondly, combined with the catastrophe theory and fuzzy mathematics, the normalization formulas, namely the fuzzy membership functions, are derived from bifurcation point set equations of typical catastrophe types. Lastly, the catastrophe progressions are calculated layer by layer until the total catastrophe progression of the system is done. In this way, the process of the multi-indicator evaluation and multi-criterion decision can be described in Figure 6.
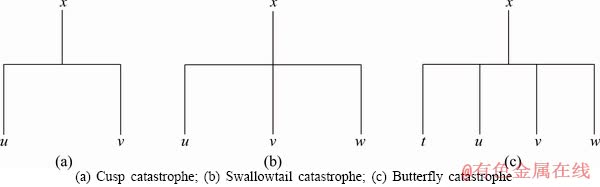
Figure 1 Structures of univariate catastrophe types:
Table 1 Fuzzy membership functions of typical catastrophe types
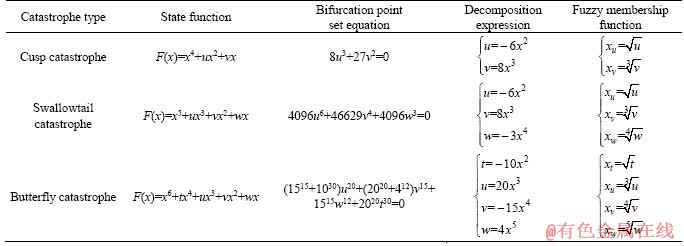
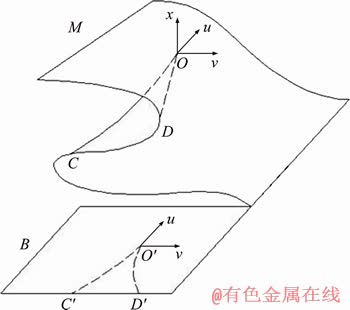
Figure 2 Cusp catastrophe
Figure 3 Swallowtail catastrophe

Figure 4 Butterfly catastrophe (u=0, t<0)
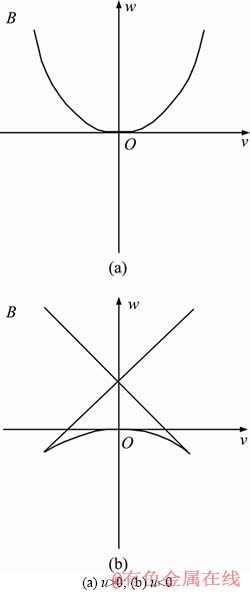
Figure 5 Projection of swallowtail catastrophe on v-w space:
Model construction can be divided into three modules according to their division of labor, including engineering-theory connection module, engineering data processing module and catastrophe model construction module.
Firstly, the engineering-theory connection module as the interface between engineering and theory plays a crucial role in the risk evaluation model. It is the intermediate link in the transformation from engineering practice to theory model as well as the most important link. The scientificity and rationality of this module will directly relate to whether the accuracy of the evaluation model can meet the engineering requirements or not. Secondly, the engineering data processing module is entirely led by engineering practice in the model, which must be closely linked with the engineering and provide true and reliable data for the model construction. It is the foundation of the effective evaluation model. Thirdly, the catastrophe model construction module is based on catastrophe theory, through which the engineering data are transformed into theoretical parameters. Then the evaluation results are given according to the catastrophe model based on dangerousness- harmfulness evaluation indicator system. It is the last link of the model as well as the core of it.
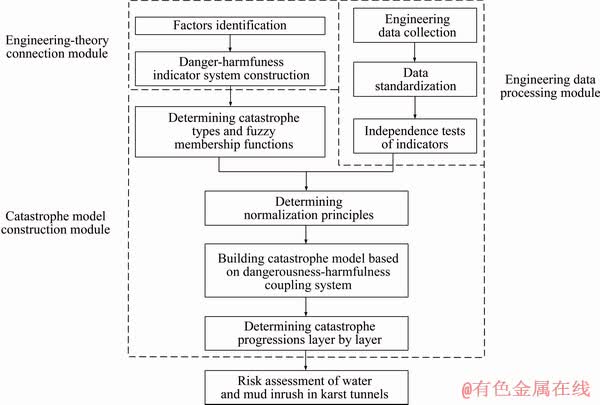
Figure 6 Process of model construction
Compared with other comprehensive evaluation programs, the model has the following two advantages. 1) What should be considered the relative importance of each evaluation indicator rather than the specific weight value of each one, which just avoids the subjectivity in dealing with indicator weights. 2) Catastrophe theory can well express the phenomenon that the accumulation of quantitative changes eventually causes a qualitative change, which is initially a continuous change followed by a skipping change. Likewise, in karst tunnels hydrodynamic force grows to a certain amount, causing the failure of water blocking system, and then water and mud inrush occurs. This process can be well simulated and analyzed by means of catastrophe theory.
3.2 Factors of water and mud inrush in karst tunnels
Factors of water and mud inrush in karst tunnels include two aspects, namely the dangerousness factors and the harmfulness factors [10]. The risk value of the disaster is the product of its probability of occurrence and expected loss. The former is affected by the dangerousness factors and the latter by the harmfulness factors. The dangerousness factors are the controlling factors of disaster occurrence. They are mostly objective environmental factors with great complexity and uncertainty and the main reason why the geological disaster of water and mud inrush is so difficult to predict. Therefore, the dangerousness factors are the focused objects in this paper. The harmfulness factors are the controlling factors of disaster development. They are closely related to the human activities, so it has great stability and identifiability. According to above analyses, the risk evaluation indicator system of water and mud inrush in karst tunnels is divided into two subsystems, the dangerousness evaluation indicator system and the harmfulness evaluation indicator system. Combined with the two subsystems, building a clearly layered, focused and well-structured risk evaluation indicator system has important significance on improving the accuracy of evaluation results. Based on the existing research achievements of water and mud inrush in karst tunnels and a comprehensive consideration of various factors, the dangerousness- harmfulness evaluation indicator system is built as shown in Figure 7.
The hydrological factors P1 (including groundwater level X1 [11], water supply X2, sediment content X3 [12], the geological factors P2 (including formation lithology X4 [13], adverse geology X5 [14], rock occurrence X6 [15], topography X7) and the engineering factors P3 (including section size X8) have been discussed in detail in Ref. [16]. In addition, the extended length X9 is interpreted as follows. The longer the tunnel extends, the more complex the formation it passes through will be. The hydrological and geological conditions will both further deteriorate with the extension of the tunnel, so the risk of water and mud inrush is higher. In order to improve the estimation of the model, the human factors, equipment factors and the management factors are also taken into account. These factors are also interpreted as follows.
1) Human factors Q1
Human factors [16] mainly include the number of staff Y1 and their safety consciousness Y2, escape skills Y3, health status Y4. The bigger the number of staff who are close to the tunnel face is, the greater the harmfulness will be once the geological disaster of water and mud inrush occurs. The remaining three can be investigated by questionnaire, simulated training and physical examination.
2) Equipment factors Q2
Equipment factors include equipment costs Y5, vulnerability degree Y6 and repair costs Y7. If the equipment costs more or is more easily damaged, the harmfulness will be greater in the disaster. Likewise, in disaster relief and recovery work, the higher the costs of equipment repair are, the greater the harmfulness will be.
3) Management factors Q3
Management factors are closely related to the implementation capacity of managers and overall quality of tunnel construction teams. Management factors are very complicated, but in general they can be divided into two aspects of emergency plan Y8 and safety education Y9. The rationality and execution efficiency of emergency plan as well as the qualified rate of safety education have a certain effect on the harmfulness of the disaster, which all can be tested by the relevant assessment programs.
In short, many factors have influences on water and mud inrush in karst tunnels, and each one has certain relevance with others more or less. In order to study such a systematic engineering problem, it is not only to take all varieties of factors into consideration to improve the reliability of the evaluation results, but also to get the point with rational analysis to ensure the efficiency of evaluation.
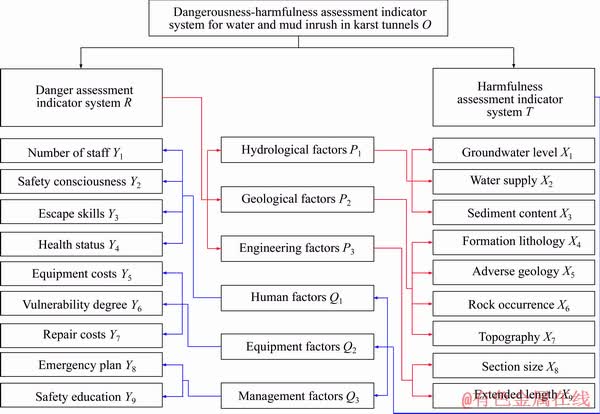
Figure 7 Dangerousness-harmfulness evaluation indicator system
4 Engineering application
Qiyueshan tunnel of Yichang-Wanzhou Railway is located in Lichuan, Hubei Province with the total length of 10528 m [17, 18]. It is one of the important controlling structures of Yichang-Wanzhou Railway. The formations the tunnel passes through are very complex and the length of karst zone is about 4.7 km which accounts for 45% of the full length of the tunnel. The main geological structures of Qiyueshan tunnel include Qiyueshan anticline, Jianzhuxi syncline as well as 15 large faults. Meanwhile, there exist a lot of water-rich karst caves, causing great difficulties to tunnel construction. Based on Qiyueshan tunnel project, the target segments H1, H2, H3, H4, H5 on the DK361+255 to DK367+931 section of the tunnel are selected. H1 is near the F4 fault, H2 is near the F6 fault and H4 is near the F8 fault. There exist several large karst caves but no fault around H3. The geological structures of H5 is the most complex, which is surrounded by F9, F10, F11 faults and various karst caves, as shown in Figure 8.
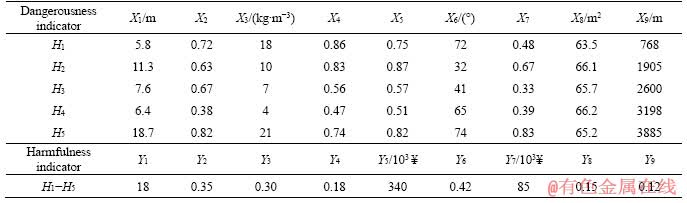
Considering the 5 target segments of Qiyueshan tunnel, the data of dangerousness evaluation indicators are obtained from the on-site monitoring or testing, while the data of harmfulness evaluation indicators from the statistics or tests of construction company. For the same construction company or companies who have the same qualifications and experience, the factors of human, equipment, management and others have great similarity, so here the data of harmfulness evaluation indicators of the 5 target segments will be not subtly distinguished. The data are listed in Table 2.
In Table 2, X2, X4, X5, X7 are comprehensive indicators, whose values are obtained by comprehensively evaluating the results of on-site surveys and statistics on the basis of relevant industry standards and experience in similar projects. Y2, Y3, Y4, Y6, Y8, Y9 are also comprehensive indicators, whose values are obtained from questionnaires, tests and reasonable evaluation of the construction companies. The value of each comprehensive indicator is evenly distributed in the interval [1, 0]. It represents the dangerousness or harmfulness level of corresponding evaluation indicator which decreases in accordance with the order of 1-0.
4.1 Data standardization
In order to apply the theoretical model to engineering, the original data need to be standardized according to Eqs. (4)-(6) [19]:
Positive indicator:
 (4)
(4)
Negative indicator:
 (5)
(5)
Suitability indicator:
 (6)
(6)
where the positive indicator refers to the indicator whose large values correspond to high dangerousness or harmfulness levels, and it is just contrary to the negative indicator. x��i represents the standardized value; xmax and xmin represent the maximum and minimum values of each indicator respectively, which include not only the observed values, but also the threshold values of all evaluation levels as shown in Tables 3 and 4; xopt is the moderate value. For X2, X4, X5, X7 and Y2, Y3, Y4, Y6, Y8, Y9, the values are already in the interval [0, 1], so no standardization is needed. X6 is the suitability indicator whose moderate value is 45��. The rest values are positive indicators.

Figure 8 Partial geological profile of Qiyueshan tunnel
Table 2 Data of dangerousness-harmfulness evaluation indicators in Qiyueshan tunnel
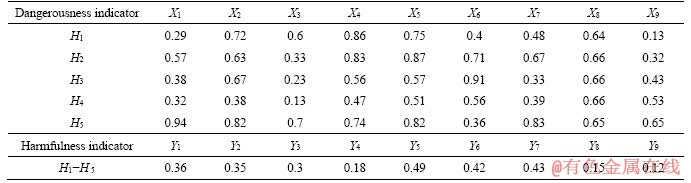
According to the dangerousness and harmfulness level classification standard in Tables 3 and 4, the data in Table 2 are standardized as shown in Table 5.
4.2 Independence tests of indicators
The independence of indicators has a crucial impact on the model and it is the basis to decide the normalization principles. The dangerousness and harmfulness evaluation indicator systems belong to two separate systems, so the independence tests should be separately done. In fact, for Qiyueshan tunnel, the values of harmfulness indicators vary little with the change of target segments, which lose the meaning of variables to a certain extent. So, there is no need for independence tests. Here the Pearson product-moment correlation coefficient is adopted to test the independence of dangerousness evaluation indicators [20]. The correlation coefficient r between each indicator can be calculated according to Eq. (7):
 (7)
(7)
where x��i, y��i represent the standardized values of indicators;
 represent the average of standardized values; n is the number of samples. The value of r is in the interval [-1, 1]. r>0 indicates a positive correlation between the two indicators; r<0 indicates a negative correlation; and r=0 indicates the independence between the two. However, the correlation coefficients obtained in accordance with the above steps are only that of the statistical samples. So, when r is very small, but not equal to zero, it does not indicate a certain correlation between two indicators. So, we reasonably assume that if |r|��0.3 the two indicators are independent, and if |r|>0.3, the two are interrelated.
Table 3 Dangerousness level classification standard for single indicator
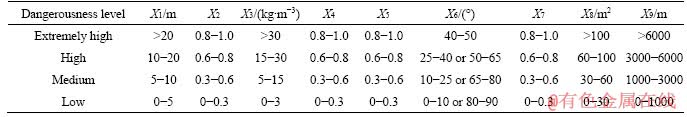
Table 4 Harmfulness level classification standard for single indicator
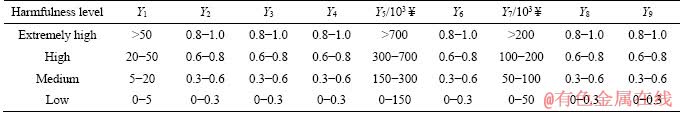
Table 5 Standardized data of dangerousness-harmfulness evaluation indicators in Qiyueshan tunnel
As we can see in Table 6, the correlation coefficients of dangerousness evaluation indicators in Qiyueshan tunnel are all between -0.3 and 0.3, indicating no significant correlation among the indicators. So, they can be considered independent from each other. Likewise, harmfulness evaluation indicators with slightly changes also can be considered irrelevant from each other.
4.3 Data normalization
In civil engineering, limit analysis method is widely used [21-29]. Combined with the dangerousness-harmfulness evaluation indicator system O and catastrophe theory, the risk evaluation model for water and mud inrush in karst tunnels based on dangerousness-harmfulness evaluation indicator system was built. Form the model we can see that the catastrophe type of R-P and T-Q layer is swallowtail catastrophe. The catastrophe types of P-X and Q-Y layer include cusp catastrophe, swallowtail catastrophe and butterfly catastrophe. According to the fuzzy membership functions listed in Table 1, the standardized data listed in Table 6 were normalized and then the catastrophe progressions were determined layer by layer. Two principles should be followed in the data normalization, namely the ��non-complementary�� principle and the ��complementary�� principle. Assuming that there is no correlation between each control variable or indicator in the same system, the value of the state variable takes the smaller one according to ��non-complementary�� principle, otherwise takes the average according to ��complementary�� principle.
Here the dangerousness evaluation of target segment H1 was taken as an example and the normalization process was as follows:
1) Hydrological factors P1:


 (8)
(8)
2) Geological factors P2:


 (9)
(9)
3) Engineering factors P3:
Table 6 Correlation coefficients of dangerousness evaluation indicators in Qiyueshan tunnel


 (10)
(10)
4) Dangerousness evaluation R:
 (11)
(11)
Following the steps above, the catastrophe progressions of dangerousness, harmfulness and lastly the total system were calculated in order as shown in Table 7.
4.4 Risk evaluation based on proposed approach
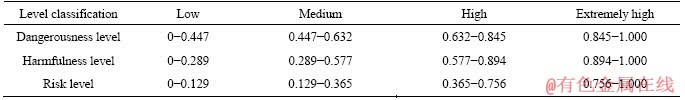
The threshold of each level in Tables 3 and 4 was standardized and then normalized using the catastrophe model. So, the risk level classification standard for water and mud inrush in Qiyueshan tunnel was obtained as shown in Table 8.
From Tables 7 and 8, the following conclusions can be drawn: 1) H1 belongs to a medium to low risk area; H2, H3, H4 belong to medium risk areas; and H5 belongs to a high risk area where the occurrence of water and mud inrush is likely to cause a great loss. 2) H2, H3 is high dangerousness areas and H5 is an extremely high dangerousness area which means that there is a great chance for water and mud inrush. However, they are all weakened when the harmfulness factors are taken into consideration. Obviously with a reasonable plan to reduce the harmfulness of various factors, the risk of water and mud inrush can be effectively controlled in the tunnel construction.
4.5 Result analysis
Excavation data show that F5, F6 faults located in the core of Qiyueshan anticline are seriously affected by geological tectonic. The karst, joints and fissures are developed. The surface is relatively flat, so the surface water seepage along the fracture zone is easier. The groundwater flows as pouring, which may cause water and mud inrush in the tunnel. For H2, which is in the vicinity of F5, F6 faults, the dangerousness level is high. The total length of F11 fault is about 200 m, which is mainly composed of fault breccias, broken rock and fault mudstone. The fault is rich in high-pressure water with strong water conductivity. As is influenced by F11 fault as well as F9, F10 faults, the dangerousness level of H5 is extremely high. Since the harmfulness indicators are controlled, the risks of H2 and H5 have been weakened to some extent. H1 is located near the F4 fault where the karst is less developed. Moreover, it lies in the entrance of the tunnel which is beneficial for the disaster control, so the risk of water and mud inrush is low. The upper surfaces of H3 and H4 are parts of hillside with steep terrain, which is difficult for surface water convergence and infiltration. Groundwater mainly consists of bedrock fissure water and karst water. Meanwhile, the formation lithology is not conducive to the flow of groundwater, so the risk is medium.
The risk evaluation results of H1, H2,H3, H4, H5 and the excavation data agree well, which proves that the risk evaluation model for water and mud inrush based on dangerousness-harmfulness evaluation indicator system is of rationality and applicability.
Table 7 Catastrophe progressions of target segments in Qiyueshan tunnel
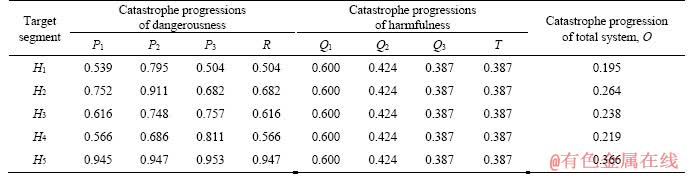
Table 8 Risk level classification standard for water and mud inrush in Qiyueshan tunnel
5 Conclusions
1) The factors which affect the risk of water and mud inrush in karst tunnels are various and complex. From two aspects of dangerousness and harmfulness of the geological disaster, the factors were decomposed in detail and reasonably classified into two groups. According to those, a clearly layered, focused and well-structured dangerousness-harmfulness evaluation indicator system was established.
2) The essence of water and mud inrush in karst tunnels is the process that the system changes by leaps and bounds from one stable state to another unstable one. The catastrophe process has great randomness. Combined with catastrophe theory, the dangerousness and harmfulness evaluation indicator systems were coupled and optimized to establish the risk evaluation model based on dangerousness-harmfulness evaluation indicator system. Then the catastrophe progressions were determined layer by layer to evaluate the system. This model avoids the deviation between the evaluation results and observed results, which is generally caused by lack of suitability for catastrophe processes in traditional evaluation programs.
3) The model was adopted to evaluate the water and mud inrush risk of target segments H1-H5 which were distributed on DK361+255 to DK367+931 section of Qiyueshan tunnel. The risk evaluation results and the excavation data agree well, which demonstrates that the model is of rationality and applicability, and can provide a reference for related projects.
References
[1] Zhang P, Heasley K A. Elimination of boundary effect for laminated overburden model in pillar stability analysis [J]. Journal of Central South University, 2016, 23(6): 1468-1473.
[2] Kl��gel J U. Uncertainty analysis and expert judgment in seismic hazard analysis [J]. Pure and Applied Geophysics, 2011, 168(1, 2): 27-53.
[3] YANG Yu-lan, TAI Hui-xin, SHI Tao. Weighting indicators of building energy efficiency assessment taking account of experts�� priority [J]. Journal of Central South University, 2012, 19(3): 803-808.
[4] ZHANG Da-wei, MA Yan-jiao, QI Li-xiao. Reliability analysis of existing road bridges and Markovian life prediction based on fuzzy mathematics [J]. WIT Transactions on the Built Environment, 2013, 140: 95-99.
[5] QU Xu, WANG Wei, WANG Wen-fu, LIU Pan. Real-time rear-end crash potential prediction on freeways [J]. Journal of Central South University, 2017, 24(11): 2664-2673.
[6] THOM Rene. Stabilit�� structurelle et morphog��n��se�CEssai d��une th��orie g��n��rale des mod��les [M]. Amsterdam: Elsevier, 1972.
[7] Chow P T, Cheung S O, Yiu T W. A cusp catastrophe model of withdrawal in construction project dispute negotiation [J]. Automation in Construction, 2012, 22: 597-604.
[8] ZHAO Wan-chun, WANG Ting-ting, FU Xiao-fei, LIU Yu. The study of fracturing rock body damage and cracks propagation model basing on catastrophe theory [J]. Open Petroleum Engineering Journal, 2014, 7(1): 64-70.
[9] XU Li-ming. Risk assessment and study on prevention of debris flows near the dam of Wudongde hydropower station based on catastrophe theory [D]. Jilin: Jilin University, 2013: 71-94. (in Chinese)
[10] ZHU Guang-an, DOU Lin-ming, CAO An-ye, CAI Wu, WANG Chang-bin, LIU Zhi-gang. Assessment and analysis of strata movement with special reference to rock burst mechanism in island longwall panel [J]. Journal of Central South University, 2017, 24(12): 2951-2960.
[11] Moon J, Fernandez G. Effect of excavation-induced groundwater level drawdown on tunnel inflow in a jointed rock mass [J]. Engineering Geology, 2010, 110(3, 4): 33-42.
[12] ZHOU Zhi-hua, CAO Pi, YE Zhou-yuan. Crack propagation mechanism of compression-shear rock under static-dynamic loading and seepage water pressure [J]. Journal of Central South University, 2014, 21(4): 1565-1570.
[13] Schiemenz A, Liang Y, Parmentier E M. A high-order numerical study of reactive dissolution in an upwelling heterogeneous mantle-I. Channelization, channel lithology and channel geometry [J]. Geophysical Journal International, 2011, 186(2): 641-664.
[14] GONG Qiu-ming, YIN Li-jun, MA Hong-su, ZHAO Jian. TBM tunnelling under adverse geological conditions: An overview [J]. Tunnelling and Underground Space Technology, 2016, 57: 4-17.
[15] Ahn J S, Ji S W, Cho Y C, Youm S J, Yim G J. Assessment of the potential occurrence of acid rock drainage through a geochemical stream sediment survey [J]. Environmental Earth Sciences, 2015, 73(7): 3375-3386.
[16] Kirytopoulos K, Konstandinidou M, Nivolianitou Z, Kazaras K. Embedding the human factor in road tunnel risk analysis [J]. Process Safety and Environmental Protection, 2014, 92(4): 329-337.
[17] TIAN Si-ming, ZHANG Min-qin, HUANG Hong-jian, YIN Huan-lian. Qualitative analysis and countrol measures for the karst developing anticline section on the entrance of Qiyueshan tunnel [J]. Modern Tunneling Technology, 2006, 43(4): 27-33. (in Chinese)
[18] SUN Guo-qing. Discussion on design and execution of grouting for F11 high-pressure and water-rich fault of Qiyueshan tunnel [J]. Tunnel Construction, 2010, 30(3): 304-308. (in Chinese)
[19] KAO Chiang. Fuzzy data standardization [J]. IEEE Transactions on Fuzzy Systems, 2010, 18(4): 745-754.
[20] XU Wei-chao, MA Ru-bao, ZHOU Yan-zhou, PENG Shi-guo, HOU Yun-he. Asymptotic properties of Pearson��s Rank- Variate correlation coefficient in bivariate normal model [J]. Signal Processing, 2016, 119(9): 190-202.
[21] LUO Wen-jun, YANG Xiao-li. 3D stability of shallow cavity roof with arbitrary profile under influence of pore water pressure [J]. Geomechanics and Engineering, 2018, 16(6): 569-575.
[22] Li Tian-zheng, Yang Xiao-li. Stability of plane strain tunnel headings in soils with tensile strength cut-off [J]. Tunnelling and Underground Space Technology, 2020, 95: 103138.
[23] YANG Xiao-li, WANG Jin-ming. Ground movement prediction for tunnels using simplified procedure [J]. Tunnelling and Underground Space Technology, 2011, 26(3): 462-471.
[24] YANG Xiao-li. Seismic bearing capacity of a strip footing on rock slopes [J]. Canadian Geotechnical Journal, 2009, 46(8): 943-954.
[25] YANG Xiao-li, HUANG Fu. Three-dimensional failure mechanism of a rectangular cavity in a Hoek�CBrown rock medium [J]. International Journal of Rock Mechanics and Mining Sciences, 2013, 61: 189-195.
[26] YANG Xiao-li, YIN Jin-hua. Upper bound solution for ultimate bearing capacity with a modified Hoek-Brown failure criterion [J]. International Journal of Rock Mechanics and Mining Sciences, 2005, 42(4): 550-560.
[27] YANG Xiao-li, YIN Jin-hua. Slope equivalent Mohr- Coulomb strength parameters for rock masses satisfying the Hoek-Brown criterion [J]. Rock Mechanics and Rock Engineering, 2010, 39(4): 505-511.
[28] YANG Xiao-li, HUANG Fu. Collapse mechanism of shallow tunnel based on nonlinear Hoek-Brown failure criterion [J]. Tunnelling and Underground Space Technology, 2011, 26(6): 686-691.
[29] Yang Xiao-li, Zhong Jun-hao. Stability analysis of tunnel face in nonlinear soil under seepage flow [J]. KSCE Journal of Civil Engineering, 2019, 23(10): 4553-4563.
(Edited by ZHENG Yu-tong)
���ĵ���
����ͻ�����۵���������ͻˮͻ���������ģ�ͼ���Ӧ���о�
ժҪ�����������һ�����ܵ����������ڹ�����ͻˮͻ���������ģ�͡����ȣ��о���Ӱ����������ͻˮͻ������Ե����أ�����ȷ���˸õ����ֺ���Σ���ԡ�ͬʱ�����ǵ�ͻˮͻ���ֺ���ɵľ�����ʧ���Ӷ�ȷ����Σ���ԡ��ڴ˻����ϣ������˻���Σ�գ�Σ���̶�����ָ����ϵ�ķ�������ģ�ͣ��봫ͳ������ȣ��������ģ�;��и�ǿ��˵���������Ľ�ͻ��������������ͻˮͻ����յȼ����÷����ڽ��������ͻ�����ⷽ����о����ơ�Ϊ����֤�÷�������Ч�ԣ���������·������ɽ����Ϊ����ͨ����������ģ�Ͷ��ĸ�Ŀ��·�ν����������������������뿪�����ݽ��бȽϣ�������������ķ�����Ԥ��ķ���ˮƽ�빤�������۲쵽������������õ�һ���ԡ����ϣ�����ͻ�����۵�����ģ����һ����Ч����������ͻˮͻ���������������
�ؼ��ʣ���������ģ�ͣ�ͻˮͻ�ࣻͻ��ģ�ͣ����ܵ�������������
Foundation item: Project(51378510) supported by National Natural Science Foundation of China
Received date: 2018-08-07; Accepted date: 2020-01-22
Corresponding author: LI Tian-zheng, PhD; Tel: +86-13875988038; E-mail: jacksonic@126.com; ORCID: 0000-0001-8424-5299
Abstract: This paper presents a risk evaluation model of water and mud inrush for tunnel excavation in karst areas. The factors affecting the probabilities of water and mud inrush in karst tunnels are investigated to define the dangerousness of this geological disaster. The losses that are caused by water and mud inrush are taken into consideration to account for its harmfulness. Then a risk evaluation model based on the dangerousness-harmfulness evaluation indicator system is constructed, which is more convincing in comparison with the traditional methods. The catastrophe theory is used to evaluate the risk level of water and mud inrush and it has great advantage in handling problems involving discontinuous catastrophe processes. To validate the proposed approach, the Qiyueshan tunnel of Yichang-Wanzhou Railway is taken as an example in which four target segments are evaluated using the risk evaluation model. Finally, the evaluation results are compared with the excavation data, which shows that the risk levels predicted by the proposed approach are in good agreements with that observed in engineering. In conclusion, the catastrophe theory-based risk evaluation model is an efficient and effective approach for water and mud inrush in karst tunnels.
