
Mathematical simulation of gas induced bath flow in drained aluminum reduction cell
LI Xiang-peng(������), LI Jie(�� ��), LAI Yan-qing(������),
ZHAO Heng-qin(�Ժ���), LIU Ye-xiang(��ҵ��)
(School of Metallurgical Science and Engineering, Central South University, Changsha 410083, China)
Abstract:
A mathematical model describing the bubble driven bath flow in a drained cell with a center sump was presented, which spanned the fluid around half an anode and was developed to simulate the flow fields. The calculated results show reasonable agreement with the experiment. Then the model was developed to a full cell model, and bath flow pattern in the whole cell was predicted and analyzed. The flow pattern variation with the changes of the ACD, anode slope, anode immersion depth and current density, especially the fluid secondary recirculation, was modeled. According to the results, side channel or slots feeding technique was recommended in such a drained cell.
Key words:
bath flow pattern; mathematical model; drained cell CLC number: TF821;
Document code: A
1 INTRODUCTION
In the past several decades, there has been considerable interests in gas induced bath flow in the currently used Hall-Heroult cells[1-5]. Physical modeling, generally water model, is a means that researchers tended to apply, with which, the high temperature and corrosive molten bath and metal pad could be replaced by water and organic liquid at room temperature, and bubble behavior and liquid flow pattern could be directly measured and observed. Physical modeling is simple and cost saving as well[6-10].
Physical modeling is oriented to partial liquid flow in a cell, the flow field features around a single anode can be well represented. For better understanding of the fluid flow phenomena in a whole cell, mathematical modeling should be used.
In the past lots of work focused on the gas induced flow fields. The mechanism for modeling two phase flow was studied by Johansen in 1989[11], using a Lagrangian particle tracking algorithm incorporating an approximate drag coefficient calculation for spherical bubbles. Fraser et al[12] applied this algorithm to the calculation of 2D H-H cell bath circulation in 1990. Purdie et al[13] calculated the bath flow field in 3D using the computational fluid dynamics(CFD) package FLUENT in 1993. Nevertheless, all these previous studies are limited to the currently used H-H cells.
The bath flow field in a drained cell is different from that of currently used H-H cells. From the previous work[13] it can be seen that, in a currently used cell prebaked anode was, when an anode bottom is horizontal, bubbles drag the bath to move disorderly in the interpolar gap; after the anode has been used for a period of time, the bottom edges were rounded, bubbles then would drive the bath to move in all directions under the anode to the slots and channels. While more than 90 pct of the bubbles under a drained cell anode moved along the length of the slope, the majority of the bath in the interpolar gap was driven to move from the bottom to the top of the slope.
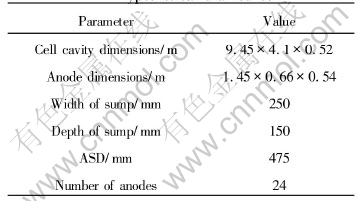
In the previous work[14], the flow pattern was studied through water modeling, secondary recirculations were observed in the fluid. In this paper a mathematical model based on Eulerian-Lagrangian formulation, was set up to simulate the water model. Then the model was improved to predict the steady state fluid flow in three dimensions in a drained cell which was retrofitted from a 160kA H-H cell. With such a model, it was possible to optimize the flow fields through improving the design of the cell cavity, and appropriate selection of parameters such as anode tilt, anode immersion depth, slot and channel width, and even the alumina feeding points as well. Initial characteristic dimensions of a hypothetical drained cell are listed in Table1.
2 GOVERNING EQUATIONS FOR TWO PHASE FLOW
The Eulerian-Lagrangian formulation com-
Table 1 Characteristic dimensions of hypothetical drained cell
putes the two phases with different schemes, wherein the liquid-phase equations are solved in a Eulerian frame of reference, similar to a single-phase calculation, and the bubble phase equations are solved with bubbles in a Lagrangian frame of Ref.[15].
2.1 Liquid-phase equations
The equations governing the motion of the liquid phase are the time averaged balances of mass and momentum which can be expressed as follows.
Mass conservation
![]()
Momentum conservation
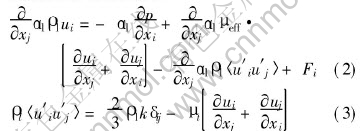
where ui and u��i are the mean and fluctuating parts of the velocity component in the direction xi, p the pressure, ��l the liquid density, ��eff and ��t the effective and turbulent viscosity of the liquid respectively, ��l the liquid fraction, k the turbulence kinetic energy, ��ij the Kronecker delta function, Fi the momentum exchange between the gas and the liquid. The distribution of the turbulent viscosity is obtained from
![]()
where C�� is an empirical coefficient, �� dissipation rate of turbulence. The effective viscosity is represented as a linear combination of the molecular �� and eddy components ��t
��eff=��t+��(5)
k and �� are obtained by solving the following k���� equations.
k equation
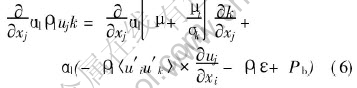
�� equation
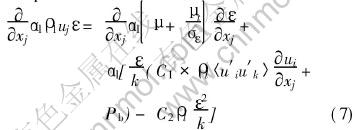
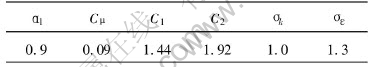
where Pb is the additional turbulent energy production rate produced by shear work due to bubble rising. The constants employed in calculations are listed in Table 2.
Table 2 Constants used in model[11, 15]
2.2 Gas-phase equations
The analysis of the motion of the gas bubbles was conducted in a Lagrangian frame of reference. In it, the change rate of velocity of a discrete bubble with respect to time can be expressed as
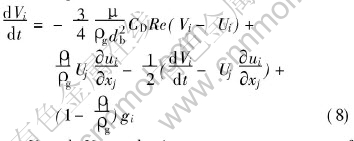
where Vi and Ui are the instantaneous components of bubble and liquid velocities in the direction xi, t the time, ��l and ��g the density of bath and gas, db the diameter of a sphere of equal volume of a bubble, CD the drag coefficient which is experimentally determined, gi the acceleration due to gravity, Re the relative Reynolds number which can be calculated as
![]()
2.3 Momentum interaction between bubble and bath
The momentum interaction terms(source terms) Fi in the liquid motion governing equations are calculated by summing the momentum exchanged by each bubble within the system passing through a particular control volume.
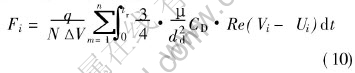
where q is the volumetric flow rate of the gas, N is the total number of bubbles calculated, ��V the control volume, n the number of bubbles visit that control volume, tR the bubbles residence time.
3 BOUNDARY CONDITIONS
The computational domain spanned half of an anode, the meshed model was shown in Fig.1. The cathode sloped surface, top of the metal surface, and the side and end wall were modeled as flat wall, using logarithmic wall functions for velocity. When a bubble encountered the upper surface of the bath, it escaped from the surface as the same in reality, so the momentum interaction calculation was terminated for this bubble. Bubbles were assumed to be nonspherical and with a shape factor of 0.9. Bubbles were set randomly at the bottom of the anode initially.
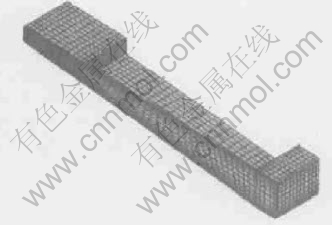
Fig.1 Meshed half anode model
The model calculations were carried out on the commercial CFD package CFX4.3, using the standard k���� model and the equations were solved with SIMPLE algorithm.
4 RESULTS AND ANALYSIS
Compare the flow pattern calculated with that of measured in the previous work of physical modeling, reasonable agreement was found between them. The fluid secondary recirculation existed in the interpolar gap and also formed between the slot and interpolar gap. The main flow in the slot went to the center channel on the right, part of the flow at the bottom of the slot entered the interpolar gap directly. Great turbulence was found in the side channel and slot.
Fluid velocities were calculated and the velocities at the points which were in accord with the two points where the measurements were conducted in the physical modeling were obtained. Then average value of the two velocity was calculated. The average velocities calculated under different slopes with the results measured in physical modeling are shown in Fig.2. Compared the results with that of the measured, maximum difference was 1.3cm/s, about 5%, so the two were still in good agreement with each other.
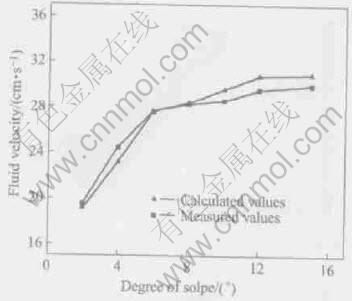
Fig.2 Effect of anode titles on fluid velocity
The subject of similarity between a water model and its prototype has been investigated several times, the most important features of the model cell and industrial cell were similar to each other[5, 9, 10, 14].
Based on the water model, the fluid properties were changed to simulate the bath flow in a 160kA drained cell. According to the result it can be seen that the flow pattern of the bath was just like that of the water that modeled by physical modeling and mathematical simulation. Second recirculations of the bath were evident in the ACD and between the ACD and slot. The majority of the bath dragged by the bubbles run to the side channel, then went to the slot, through the slot to the center channel; a small part of the bath went to the slot directly with the bubbles escaped from the ACD to the slot as shown in Fig.3. Flow from the side channel(left side) formed the upper flow in the slot, which went to the center channel, and the flow emerged from the ACD at the upper half of the anode distance and went to the slot, there met the upper flow and turned backwardly, formed the lower flow in the slot, which did not go to the center and returned to the ACD insteadly at the lower half of the anode distance. Great turbulence was caused in the slot, ACD and side channel by bubbles discharging, which is shown in Figs.4-6, the contours of the turbulent kinetic energy, dissipation rate and turbulent intensity.
Further calculations were carried out to predict the effects of different modeling factors on the flow pattern, especially the fluid secondary recirculation.
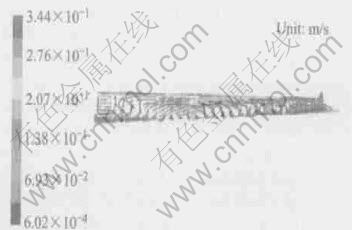
Fig.3 Flow pattern in slot
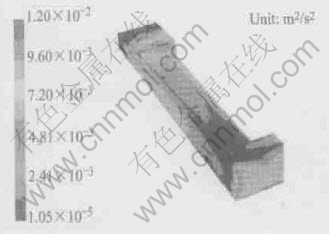
Fig.4 Contours of turbulent kinetic energy (k)
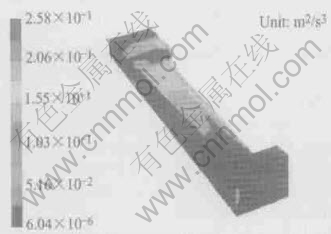
Fig.5 Concours of turbulent dissipation rate (Epsilon)
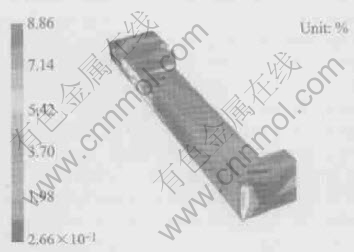
Fig.6 Contours of turbulence intensity
4.1 Influence of ACD
When the ACD was reduced from 2.5 to 1cm, almost no fluid secondary recirculation was observed, which was in good agreement with the results observed in the water modeling. The net rising flow under the anode started from the bottom of the slope to the top. However, an intensified fluid secondary recirculation was formed between the slot and interpolar gap, part of the rising flow in the gap mixed with the flow from the side channel at the edge of the upper end of the slope going to the slot, without entering the side channel; almost all of flow in the slots mixed with the flow from the center channel at middle part of the slot and turned down to the interpolar gap and never went to the center channel. Increased the ACD from 2.5 to 4cm, fluid secondary recirculation in every interpolar gap was intensified, not only the speed, but also the layer thickness. Secondary recirculations under the anodes at or near the middle part of the cell extended all the way through the length of the anode bottom to the center channel, then with the flow from the slots and end channel back to the interpolar gap again, as to the fluid under the anodes near the end channel, the secondary recirculations were still very weak. The flow in the slots was also intensified, almost all of the flow there went to the center channel with greater turbulence than that of the initially calculated when ACD was 2.5cm. The fluid properties changing with the variation of the ACD are listed in Table 3.
4.2 Influence of slope
Increased the degree of the anode bottom slope from 4��to 8��and 15��, the fluid secondary recirculation in the interpolar gap was weakened. When the slope is 8��, the secondary recirculation in the interpolar gap shrank to the position a little bit lower to the mid-length of the anode, and there encounters the rising flows from the center channel and slots, mixes with them, then turns upward and goes back to the side channel along the anode bottom. Very weak secondary recirculations were observed under anodes when the slope is increased to 15��, which extends only a short distance(about one forth of the anode length), then mixes with part of the rising flow and goes to the slots. The velocity of the flow increased with the degree of the slope, and so does the turbulence which are listed in Table 4.
4.3 Influence of anode immersion depth
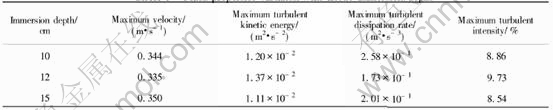
The change of the anode immersion depth had great influences on the flow pattern under the anodes as well. When increased the anode immersion depth to 12cm(refer to the upper edge at the bottom of anode), the fluid secondary recirculation withdrew to the mid-length of the anode; when increased to 15cm, the secondary recirculation was pulled back close to the upper edge of the slope, about one fifth of the anode length. As the anode immersion depth increased, the turbulence in the side channel and slots decreased, while the amount of flow in the slot directly to the interpolar gap increased, the fluid properties changing with the variation of the anode immersion depth are listed in Table 5. When the anode immersion depth was increased to 12cm, the turbulence in the fluid increased, however, as it increased to 15cm, the turbulence decreased. It seemed that there was a peak of turbulence between 10 and 15cm. Further study would focus on this phenomenon. In addition, it could be seen that the anode immersion depth had little influence on the fluid flow velocities.
Table 3 Fluid properties variation with ACD
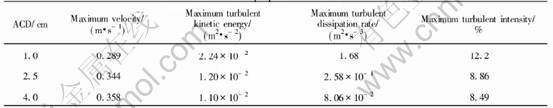
Table 4 Fluid properties variation with slope
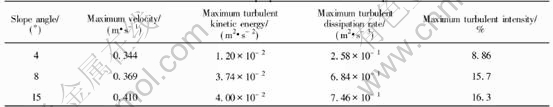
Table 5 Fluid properties variation with anode immersion depth
4.4 Influence of current density
According to the results calculated, the influence of the current density on the bath flow pattern was not as large as that of the ACD, degree of slope and anode immersion depth, however, the maximum velocity in the interpolar gap increased with the increase of it.
Other factors such as the dimensions of the slot, ASD(anode-side wall distance) and dimensions of the center channel also have impacts on the flow pattern in the cell, which were not presented here.
5 CONCLUSIONS
The combined Eulerian-Lagrangian formulation of gas-liquid-phase momentum is suitable for the calculation of gas driven bath flow in a drained style aluminum reduction cell. Bath flow pattern, especially the secondary recirculation of the bath flow in the interpolar gap was predicted and observed. Good agreement was found between the results calculated and measured in the previous work.
According to the results calculated, it can be seen that the fluid secondary recirculations in the interpolar gap and slot were nearly unavoidable. Not only small vortices exist in the interpolar gap, but big fluid recirculation forms between the slot and interpolar gap, part of the fluid in the slots go to the interpolar gap directly without going to the center channel, and on the other hand, part of the fluid in the interpolar gap enter the slots with the bubbles escaped there without going to the side channel. This may be quite unfavorable for the alumina dissolution and transfer, especially if the currently used center feeding technique is applied on a drained cell, since large amount of exhausted bath would not reach the center channel, therefore, could not be refreshed with alumina.
The flow in the center channel is dominated by the downward flow, and if the alumina is fed there, the alumina particles would be held down by the flow and deposit to the cell bottom easily.
As the bath flow turbulence is responsible for mixing of the liquid phase and dispersion of the alumina particles, the turbulence caused by the bubbles discharging in the side channel and slots would be quite helpful for the alumina mixing. It would be reasonable to install the alumina feeders at either position. The center feeding technique that applies on most of the currently used large scale prebaked cells may be no longer suitable.
The fluid secondary recirculation in the interpolar gap moves in the same direction as that of the aluminum drainage. Big drag force would be imposed on the aluminum droplet which is deposited on the cathode surface during the electrolysis, and greatly contributes to its drainage process, however, the bubbles dispersed in the bath flow would react with the aluminum and lower the current efficiency.
REFERENCES
[1]Brown G D, Hardie G J, Shaw R W, et al. TiB2 coated aluminium reduction cells: status and future direction of coated cell in comalco [A]. Welch B. Aluminium Smelting Conference [C]. Queenstown, New Zealand: Al Smelting Workshop, 1998, 26: 499-508.
[2]Wahnsiedler W E. Hydrodynamic modeling of commercial hall-heroult cells [J]. Light Metals, 1988: 269-273.
[3]Stedman I G, Houston G J, Shaw R W, et al. Aluminum Smelting Cells [P]. US 5043047, 1991.
[4]Vittorio de Nora. Cell for Aluminium Electrowinning Employing a Cathode Cell Bottom Made of Carbon Blocks which have Parallel Channels Therein [P]. US 5683559, 1997.
[5]Solheim A, Johansen S T, Rolseth S, et al. Gas driven flow in hall-heroult cells [J]. Light Metals, 1989: 245-252.
[6]Purdie J M, Bilek M, Taylor M P, et al. Impact of anode gas evolution on electrolyte flow and mixing in aluminum electrowinning cells [J]. Light Metals, 1993: 355-360.
[7]Dernedde E. Gas induced circulation in an aluminum reduction cell [J]. Light Metals, 1975: 111-122.
[8]Chessonis D C, Lacamera A F. The influence of gas-driven circulation on alumina distribution and interface motion in a hall-heroult cell [C]. Light Metals, 1990: 211-219.
[9]Fortin S, Gerhardt M, Gesing A J. Physical modeling of bubble behavior and gas release from aluminum reduction cell anodes [J]. Light Metals, 1984:721-741.
[10]Shekhar R, Evans J W. Modeling studies of electrolyte flow and bubble behavior in advanced Hall cells [J]. Light Metals, 1990: 243-248.
[11]Johansen S T, Robertson D G C, Woje K, et al. Fluid dynamics in bubble stirred ladles(��)��Mathematical modeling [J]. Metallurgical Transactions B, 1998, 19B(4): 755-764.
[12]Fraser K J, Taylor M P, Jenkin A W. Electrolyte heat and mass transport processes in hall heroult electrolysis cells [J]. Light Metals, 1990: 221-226.
[13]Purdie J M, Bilek M, Taylor M P, et al. Impact of anode gas evolution on electrolyte flow and mixing in aluminum electrowinning cells [J]. Light Metals, 1993: 355-360.
[14]LI Xiang-peng, LI Jie, LAI Yan-qing, et al. Physical modeling of the gas induced bath flow in a drained aluminum reduction cell [J]. Trans Nonferrous Met Soc China, 2004, 14(5): 1017-1022.
[15]Guo D, Irons G A. Modeling of gas-liquid reactions in ladle metallurgy(��)��Numerical simulation [J]. Metallurgical and Materials Transactions B, 2000, 31B: 1457-1464.
Foundation item: Project(G1999064903) supported by the National Key Fundamental Research Development Program of China
Received date: 2004-02-23; Accepted date: 2004-05-08
Correspondence: LI Xiang-peng, PhD; Tel: +86-731-8830474; E-mail: roclee_xp@163.com
