

J. Cent. South Univ. (2021) 28: 1555-1569
DOI: https://doi.org/10.1007/s11771-021-4715-9

Measurement and engineering application of adsorbed water content in fine-grained soils
ZHANG Rui(����)1, 2, XIAO Yu-peng(Ф����)2, WU Meng-li(������)2,ZHENG Jian-long(֣����)1, 2, MILKOS B C1, 2
1. National Engineering Laboratory of Highway Maintenance Technology,
Changsha University of Science & Technology, Changsha 410114, China;
2. School of Traffic and Transportation Engineering, Changsha University of Science & Technology, Changsha 410114, China
 Central South University Press and Springer-Verlag GmbH Germany, part of Springer Nature 2021
Abstract:
In this paper, the content and density of adsorbed water in fine-grained soil are determined. According to the test results, the calculation method of compaction degree of the solid-phase and void ration of soil is improved. Four kinds of fine-grained soils from different regions in China were selected, and the adsorbed water content and density of four kinds of fine-grained soils were determined by thermogravimetry and volumetric flask method. Furthermore, SEM and XRD experiments were used to analyze the differences in the ability of each soil sample to absorb water. In order to study the compression characteristics of adsorbed water, four saturated soil samples were tested by consolidation method. The results show that the desorption temperature range of the adsorbed water and its density were equal to 100-115 ��C and 1.30 g/cm3, respectively. Adsorbed water plays a positive role in keeping the compressibility of fine-grained soil at a low rate when it has high water content. Besides, adsorbed water can be a stable parameter and is difficult to discharge during the operation period of subgrade. The settlement of fine-grained soil embankment is predicted by engineering example, and compared with the result of conventional calculation method. The results show that it is more close to the field monitoring results by using the improved void ratio of soil as the parameter.
Key words:
adsorbed water; volumetric flask method; thermogravimetric analysis method; void ratio; settlement��
Cite this article as:
ZHANG Rui, XIAO Yu-peng, WU Meng-li, ZHENG Jian-long, MILKOS B C. Measurement and engineering application of adsorbed water content in fine-grained soils [J]. Journal of Central South University, 2021, 28(5): 1555-1569.
DOI:https://dx.doi.org/https://doi.org/10.1007/s11771-021-4715-91 Introduction
The water containing in the soil will significantly affect its physical and mechanical properties. Unlike the general sandy soil, the fine-grained soil contains a great amount of adsorbed water. The water inside the electric double layer composed by negative charge and the surrounding water molecule dipole, cation cloud, etc. is known as adsorbed water, and the water outside the electric double layer is called free water [1, 2]. Water molecules near and far from the soil particles surface are known as strongly and weakly adsorbed water respectively, due to the soil particle surface attraction [3]. The strongly adsorbed water is firmly fixed on the soil particle surface because of the effect of diffusion-electric double layer, and it is considered a part of soil particle when conducting the calculation. Adsorbed water is different from free water, and nanoscale studies have found that its density is higher than that of free water [4, 5], which has the characteristics of high viscosity, low fluidity and large deformation stiffness [6, 7]. Since strongly adsorbed water has been classified as a part of solid phase, the weakly adsorbed water is collectively referred to herein as adsorbed water. Because of the special properties of adsorbed water, it is urgent for researchers to find an accurate and simple way to measure the adsorbed water content and study its influence on soil engineering characteristics.
Many scholars have found that the diffusion-electric double layer theory based on soil-water relationship can qualitatively explain the consolidation and the compression of soil, and can qualitatively predict the compressibility of soil at home and abroad [8-11]. At present, the determination of adsorbed water content mainly includes isothermal adsorption method [12, 13], thermogravimetric analysis method [14-16] and volumetric flask method [17]. In the study of isothermal adsorption of soil with high fine particle content, CALVET [18] found that the adsorbed water content decreases with the decrease of cation exchange capacity, and it was considered that the amount of adsorbed water in low humidity environment was affected. The adsorption of cations on the soil particle surface has the greatest influence and plays a decisive role. RASCIO et al [19] used pressure-volume method and the isothermal adsorption method to compare the strongly and weakly adsorbed water content of soil adsorption, and they concluded that the strongly adsorbed water content is the same, while the content of weakly adsorbed water is quite different. The isothermal adsorption method is simple and straightforward, since the soil particles are agglomerated and the cohesive force among clay particles is much larger than the shearing force of the water molecules. The water molecules are usually adsorbed by the soil particle surface and they cannot establish full contact with soil particles, making the test results inaccurate. HATAKEYAMA et al [20] analyzed different types of adsorbed water on the surface of a research object by using thermogravimetry and differential scanning calorimetry (DSC), and they accurately determined the content of strongly adsorbed water, weakly adsorbed water and free water. But the thermogravimetric analysis instrument is expensive in the engineering practice; therefore it is usually hard to assure the conditions for utilizing it. In order to find a simple and easy-to-operate test method, ZHANG et al [17] used the volumetric flask method to observe the total volume change of soil-water mixture samples, and the adsorbed water content on the soil particles surface was measured based on the assumption of the adsorbed water density. Different test methods have been used by scholars, and the adsorbed water content results were not the same. The adsorbed water content also has an impact on the soil engineering characteristics. Therefore, if adsorbed water content can be accurately obtained, this fact will represent a step forward in engineering research.
To determine an effective test method for obtaining the adsorbed water content, four kinds of fine-grained soils with different particle size distribution were selected from different regions to carry out this research. The basic physical characteristics of the four soil samples were determined, and the specific surface area of each soil sample was determined by using the methylene blue adsorption method. The thermogravimetric analysis method and the volumetric flask method were used to test the weakly adsorbed water content in the soil, and the adsorbed water density was further determined by analyzing the experimental results. Besides, scanning electron microscopy (SEM) and X-ray diffraction (XRD) were carried out with the objective of observing and analyzing the difference in the adsorbed water content of the mentioned material samples. Moreover, the compression characteristics of the adsorbed water were further studied by using consolidation test of four saturated soil samples, and by carrying out modification of compression characteristics of the soil based on the test results.
2 Soil samples
2.1 Basic physical properties
Four representative fine-grained soils from different parts of China were selected for experimental study, i.e. Zhuzhou, Hunan Province (Sample-1), Danzhou, Hainan Province (Sample-2), Xiangtan, Hunan Province (Sample-3), and Enshi, Hubei Province (Sample-4). The basic characteristics of the four soil samples including particle composition, limit moisture content, and specific surface area were obtained. Table 1 summarizes those experimental data. The selected material samples were named taking into consideration of the determined basic physical property results and the specifications. Sample-1 is heavy clay (CH), sample-2 is heavy silt (MH), sample-3 is lean clay (CL), and sample-4 is lean silt (ML).
2.2 Material composition and microstructure
The microstructure of each soil sample was observed by using SEM, and its composition was analyzed by utilizing X-ray diffraction. According to the results of the above micro tests, the ability of each soil sample to adsorb water can be analyzed.
In modern testing technology, SEM has the advantages of high resolution, large magnification, wide field of view and strong stereo sense [21]. SEM test was carried out on the test soil samples to better understand its microstructure and explain the reasons for the difference of adsorbed water content in different soil samples. JSM-649LV scanning electron microscope spectrometer was used in the experiment. The electronic resolution of the secondary image was equal to 1.0 nm (30 kV), and the magnification was up to 10000 times.
First, grind the 4 soil samples to be tested with the goal of obtaining powder shape soil, dry them in an oven at constant temperature for 8 h, and then put them in a drying bottle to cool them at room temperature. Apply a layer of conductive adhesive on the sample base, spread the sample powder to be tested on it, and after the conductive adhesive adheres the powder, blow off the sample powder which is not firmly adhered on the surface with the ear ball. In order to obtain clear SEM images,5-10 mm Pt conductive film was sprayed on the surface of the sample. After that, put the prepared samples into SEM for scanning, observe the samples, and select 10000 times of electron microscope pictures for storaging. After the test, turn off the high pressure, unload the vacuum and take out the sample. The microstructure images of each soil sample obtained from the test were analyzed.
SEM image of each soil sample is shown in Figure 1, which magnifies the internal microstructure of the soil samples by 10000 times. It can be clearly seen that the quartz content of the four soil samples is high [22], and the microstructure has a layered structure. Scale illite can be seen in heavy clay, lean clay and lean silt, while the presence of laminated kaolinite in the middle layer of heavy silt is prominent, indicating that the clay content in the four kinds of soils is high. RAJKUMAR et al [23] also observed the microstructure of mangrove soil in India and they found that the presence of clay minerals improves the water holding capacity of clay particles. Illite is a kind of mesoporous material, which has a wide range of particle size and shape distribution [24]. Its crystal structure is 2:1 type, and it is easy for isomorphic substitution to occur, that is, Si4+ of tetrahedron is often replaced by Al3+ and Al3+ of octahedron is often replaced by Mg2+ [25], resulting in a negative charge on the surface of clay particles. The negative charge on the particle surface will adsorb the cations in the water molecules, which will form a layer of adsorbed water film on the mentioned surface. This phenomenon is also the main reason for the formation of the adsorbed water of the three soil samples. Kaolinite has a 1:1 crystal structure, and its molecules are connected by hydrogen bond, so it is not easy to fracture them. However, the micropores produced by its layered structure provide favorable conditions for the existence of adsorbed water. Therefore, the particle composition of soil has a great influence on its ability to adsorb water.
It was found that the composition of soil affects its physical properties. Each crystal has its own unique chemical composition and structure. When X-ray is diffracted by crystal, each crystal has its own unique diffraction pattern. Their characteristics can be described by the distance (d) between diffracted crystal faces and the relative intensity I/I0 of diffracted rays. The surface spacing d is related to the shape and size of the crystal cell, while the relative strength is associated with the type of particle and its position in the crystal cell. The diffraction data d and I/I0 of any kind of crystal material are the inevitable reflections of its crystal structure, according to which the phase of crystal material can be identified. Therefore, the mineral composition of different soil samples can be obtained by conducting XRD analysis [26, 27]. In order to study the influence of soil composition on its water adsorption capacity, all soil samples were diffracted by utilizing Japanese Physical XRD.
Table 1 Physical properties of soil samples
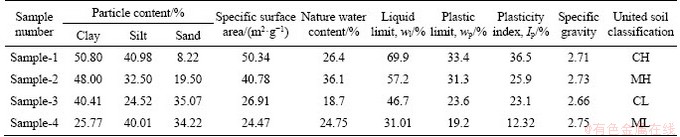

Figure 1 SEM images of different soil specimens:
Before the test, grind the soil sample (40 ��m) to ensure that the sample has enough grains in the range of light, and adjust the diffraction angle range to 3��-80�� to obtain the correct powder diffraction pattern data. At the end of the experiment, the data were collected and the patterns in the crystallography database were analyzed. The clay mineral contents of illite, kaolinite, montmorillonite and quartz in each soil sample were roughly estimated.
X-ray diffraction pattern is shown in Figure 2. It can be clearly observed that the quartz diffraction peaks of four kinds of soil samples are prominent, and the diffraction peaks of montmorillonite, illite and kaolinite also appear in the mentioned samples. Through the processing of the test data, the approximate content of mineral composition of each soil sample was obtained. CH sample is composed of 39.5% quartz, 0.4% montmorillonite, 33.2% illite and 27.0% kaolinite. MH sample contains 69.1% quartz, 1.2% montmorillonite, 11.6% illite and 18.2% kaolinite. CL sample contains 74.3% quartz, 1.0% montmorillonite, 15.1% illite and 9.6% kaolinite. ML sample is composed of 83.8% quartz, 0.6% montmorillonite, 8.5% illite and 7.1% kaolinite. The results are consistent with those obtained from SEM. Montmorillonite, illite and kaolinite are all clay minerals, which are different from stone and other non-clay minerals. Their surface has a strong activation center. Due to the existence of hydrogen bond, van der Waals force and other molecular forces, clay mineral has a strong affinity for water molecules, forming a clay water system. That is, forming an adsorbed water film on the particle surface. The proportion of clay minerals and non-clay minerals in the four soil samples is the main reason for the difference of adsorbed water content.

Figure 2 X-ray diffraction patterns for different soil specimens:
3 Test methods and steps
At present, thermogravimetry is a kind of direct adsorbed water test method, but the test instrument is expensive, which is not suitable for promotion; while volumetric flask method is an indirect test method based on the assumption of adsorbed water density, and the instrument is simple and easy to operate. Although there are some differences between the two methods, combining the thermogravimetric method and the volumetric flask method to complement each other��s strengths and combining their test results organically has certain significance for the adsorbed water test.
3.1 Thermogravimetric test
The thermogravimetry can record the change of weight loss rate of the sample with the rise of temperature in real time through the thermobalance, and then analyze the water loss of the soil. The STA 449 F5 Jupiter synchronous thermal analyzer was used for the test, and the weighing accuracy of the balance can reach 0.1 ��g. Before the test, grind the soil sample with the objective of obtaining a powder shape soil; the water content of the specimen was set to be slightly lower than the liquid limit water content of the soil sample; keep it sealed in the environment with the humidity and temperature equal to 1 and 20 ��C, respectively. Weigh the mass every 24 h until the quality of the specimen does not change, and ensure that the soil specimen reaches the saturated state of adsorbed water.
First, open the balance protective gas (argon), adjust the air valve to make the reading of the air valve less than 0.1 MPa, and adjust the air flow to 20-40 mL/min. The test parameters are set on the computer, the temperature gradient is set to be 5 ��C/min, and the maximum temperature is set at 200 ��C. Next, take about 50 ��g of the prepared sample and put it into a clean crucible, weigh it, and then place it gently in the furnace body. To prevent the test results from being affected by the gas released and blown away during the process, cover the crucible cover and place an empty crucible in the furnace body for calibration. After the preparation process is completed, close the furnace body, start the procedure and conduct the test. After the test, export the data, take out the test sample for weighing after the furnace body achieves the room temperature, and then close the instrument.
3.2 Volumetric flask method test
The difference of density between adsorbed water and free water can be explained by the difference of physical properties between adsorbed water and free water. It was found that the water density in soil was more than 1.0 g/cm3; the adsorbed water density at 15% and 28% water content were equal to 1.46 and 1.32 g/cm3, respectively; the adsorbed water density in soil with 28.4% and 46.0% water content were equal to 1.32 and 1.16 g/cm3, respectively, and the soil water density could be up to 1.42 g/cm3 [28]. The water density in soil decreases with increasing water content, but it can be still higher than 1.0 g/cm3 [29]. According to Kurichetsky��s test results of the adsorbed water density in several typical clay minerals [30], it is assumed that the adsorbed water density in the soil is equal to 1.3 g/cm3. ZHANG et al [31] studied the adsorbed water density according to the relationship between the soil adsorption potential and the soil water density. The modeling and test results were consistent, which showed that the soil water density was about 1.3 g/cm3. In engineering practice, the soil water content for construction is generally between 15% and 25%. When the free water is converted into adsorbed water, the volume of water in the volumetric flask becomes smaller because of its higher density. By measuring the total volume change of the known volume of dry soil particles and the known volume of distilled water before and after mixing at constant temperature, the content of the adsorbed water of the sample is calculated. The test principle of the volumetric flask method test is shown in Figure 3 [17].
Some scholars have found that the soil particle composition has a certain influence on the adsorbed water content [29, 32, 33]. In order to keep the particle size uniform and reduce the error, the quartering method was used. First, lay the screened soil sample on the flat plate, forming a square with uniform thickness; then divide the square diagonally and take two samples diagonally; and then take samples in sequence according to the above steps until the required sample quality is achieved. The total volume of the volumetric flask used in the test is equal to 255 mL, and the graduation value is equal to 0.05 mL. They are numbered respectively. First, calibrate the volumetric flask, wash the numbered volumetric flask with water and ultrasonic, and then dry it at constant temperature of 105 ��C in a drying oven for 12 h. Accurately measure 254 mL of distilled water, put it into the volumetric flask, record the liquid level reading of each volumetric flask at this time, calculate and record the correction value of each volumetric flask. Next, take 20-30 g of dried soil sample and put it into the calibrated dry volumetric flask, slowly pour a certain volume of distilled water into it, shake and evenly discharge the bubbles, make the soil particles fully disperse and contact with the water, then place the volumetric flask in a water bath at constant temperature of 25 ��C, cover the opening of the flask with a hole fresh-keeping film to prevent impurities from falling, and record the initial concave liquid level reading. In order to eliminate the influence of the external environment, adjust the room temperature at 25 ��C. All tests are set with 5 groups of parallel test and ��bottle water adding�� correction test. Record the concave liquid level reading of the volumetric flask every 24 h until the liquid level height in the volumetric flask does not change.
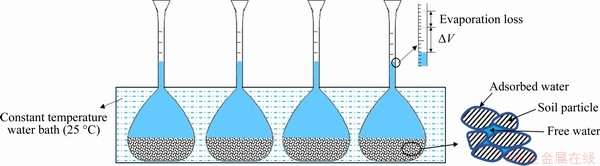
Figure 3 Volumetric flask method (��V: Reduction in volume of free water converted to adsorbed water)
4 Results and discussions
According to the adsorbed water content in each soil sample directly measured by using thermogravimetry method and the volume change of water measured by utilizing volumetric flask method, the adsorbed water density of the soil sample can be calculated to verify the hypothesis of volumetric flask method. Besides, at the same time, the accuracy of volumetric flask method can also be verified.
4.1 Thermogravimetry
Many scholars have studied the types of soil water, but there is no unified standard for the classification of soil water, often using the critical temperature to distinguish it [15, 34]. In fact, the critical temperature of adsorbed water in numerous articles is different and cannot be determined. Another method is regarding the inflection point on the TG curve as the boundary between the strongly and weakly adsorbed water. There is no obvious stage in the TG curve, but the DTG curve can be obtained by carrying out differentiation of the TG curve, which can be used to record the speed of mass loss with temperature, to determine the maximum reaction speed, and to divide the free water and the adsorbed water effectively. The TGA test results of the four soil samples are shown in Figure 4.
The loss rate of soil sample at the peak of DTG curve is the largest, and the corresponding temperature is the removal temperature of different types of water in soil sample. When the mass loss of soil sample reaches the peak value, the mass loss rate decreases with the increasing temperature, which means that after one type of water is removed, another new type of water is in the stage of removal. 25-250 ��C is the stage with large mass loss rate of soil samples, and there are obvious peaks in the thermogravimetric analysis curves of the four kinds of soil samples. Compared with the adsorbed water, the temperature of free water removal is lower, the removal rate is smaller, and it will be completely removed between 75-90 ��C. Because of the double electric layer effect [35], the adsorbed water is firmly adsorbed on the surface of soil particles and can be completely removed in the range of 100-115 ��C. According to the TG curve, it can be seen that the difference between the free water content and the adsorbed water in the saturated soil sample is relatively small, that is, the adsorbed water content in the unsaturated soil used for construction is relatively high.
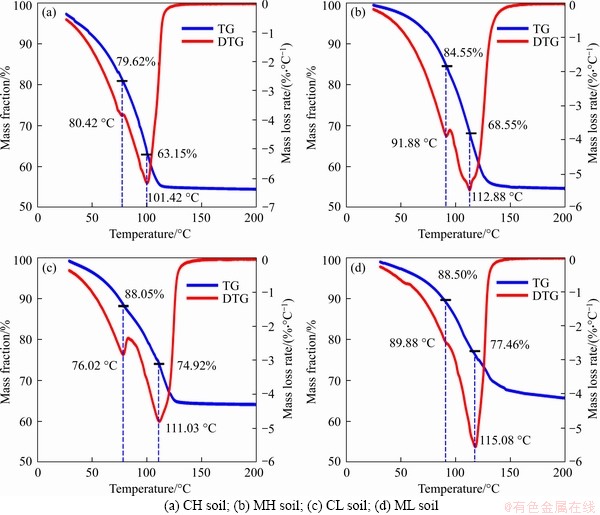
Figure 4 Thermogravimetric curves for clay samples:
According to Figure 4, the adsorbed water content of the four soil samples is calculated:
 (1)
(1)
where ��g, MT, ��F, ��B and M0 represent the adsorbed water content of the soil (expressed as the mass fraction of dry soil), the initial mass of the sample, the ordinate corresponding to the TG curve when the free water is completely removed from the soil, the vertical coordinate corresponding to the TG curve temperature when the free water is completely removed, and the stable mass of the sample after the end of temperature rise, respectively.
The adsorbed water contents of the four samples can be obtained by conducting calculation, which are 30.37%, 29.44%, 20.57% and 16.92%. According to the analysis in Table 1, the adsorbed water content of the four soil samples decreases with the decrease of fine-grained content. Therefore, the soil adsorption capacity to adsorb water is affected by its particle size of soil.
4.2 Volumetric flask method
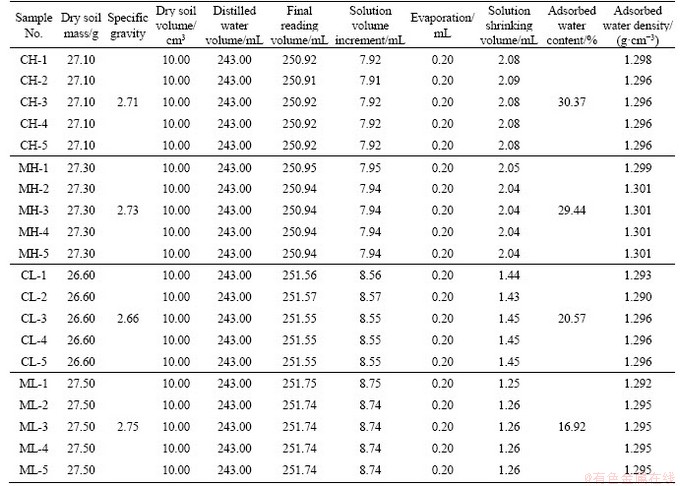
The volumetric method is easy to operate and the experimental conditions are easy to reach, so it is widely used in engineering. Four samples were tested by using volumetric flask method. Due to the density difference between adsorbed water and free water, when a certain volume of water and a certain volume of dry soil water are fully mixed, the surface of soil particles adsorbs the free water, and the volume changes after the free water is converted into adsorbed water, resulting in the change of the total volume of soil water mixture. The test record is shown in Table 2.
Through the volumetric flask method test, the volume change of the liquid in the volumetric flask can be obtained before and after the soil sample adsorbs the water. But the adsorbed water density has not a certain value so far, which leads to the inaccuracy of the adsorbed water content of the soil mass in the volumetric flask test. Therefore, the adsorbed water density can be determined by combining the data obtained from the volumetric method with the test results of the adsorbed water content obtained from the thermogravimetry, so as to obtain the adsorbed water content of each soil sample. Test data can be determined according to Eq. (2), and they are shown in Table 2.
 (2)
(2)
where wg, ��we, ��wt, ms and ��V represent the adsorbed water content of the soil (expressed as the mass fraction of dry soil), the unit weight of adsorbed water, the unit weight of free water at temperature t, the mass of dry soil used in the test, and the volume reduction when free water is converted into adsorbed water, respectively. The latter parameter can be measured by conducting test and calculated by:
 (3)
(3)
where Gs and Vt represent the specific gravity of soil sample measured in neutral liquid, and the increment of water volume in measured volumetric flask respectively.
Through the analysis and calculation of the test records of volumetric method and the adsorbed water content of each soil sample measured by utilizing thermogravimetry method, the adsorbed water density results of each sample are obtained and shown in Table 2, and the discrete statistical analysis related to 20 groups of data was carried out. The maximum density, the minimum density and the average density are equal to 1.301, 1.290 and 1.30 g/cm3, respectively. After analyzing the density results associated with the 20 groups of data, it is possible to conclude that the range of density value is equal to 0.011, which is small. The variation coefficient is equal to 1.60%, and the distribution of the density value of the adsorbed water is relatively stable with little fluctuation. Therefore, it can be considered that the adsorbed water density is equal to 1.30 g/cm3. According to this result, the adsorbed water content in soil can be tested by utilizing the volumetric method in engineering.
5 Application of test results
Due to its solid nature, adsorbed water is also one of the important factors to control the compression deformation of fine-grained soil. Therefore, this section discusses the influence of adsorbed water on the laboratory consolidation test related to fine-grained soil and the actual consolidation settlement of the project.
Table 2 Parallel tests record of volumetric method
5.1 Application in consolidation prediction
By applying the nanoscale dynamic simulation experiment, it was found that the adsorbed water on the surface of the soil particle has certain shear strength and viscosity [36]. The experiment results show that when the overburden pressure reaches 2 MPa, the soil moisture content is about its adsorbed water content [37]. Through the thermogravimetric analysis, it can be noticed that the adsorbed water can be completely removed only when temperature is set to be 100-115 ��C. The existing experiments show that the effective void ratio greatly affects the engineering properties of the soil after considering the content of adsorbed water removed from the void ratio calculation [38], so the adsorbed water can be considered a part of the solid phase of the soil. At the same time, the adsorbed water density can be considered 1.30 g/cm3 according to the test results from thermogravimetry analysis and volumetric flask. Its density is higher than that related to free water, so it has strong viscosity and is not easy to discharge. The void ratio of soil refers to the ratio between the volume of pore gas and pore water and the volume of soil particles. When the adsorbed water is regarded as a solid phase, it has a great influence on the void ratio of soil. Therefore, taking into consideration of the existence of adsorbed water, the void ratio of soil is modified, and the three-phase diagram of soil before and after the modification is shown in Figure 5.
Conventional void ratio can be calculated by:
 (4)
(4)
Modified void ratio can be derived by:
 (5)
(5)
According to Eq. (4), bring the relationship between e and V into Eq. (5), and then modified void ratio can be derived by:
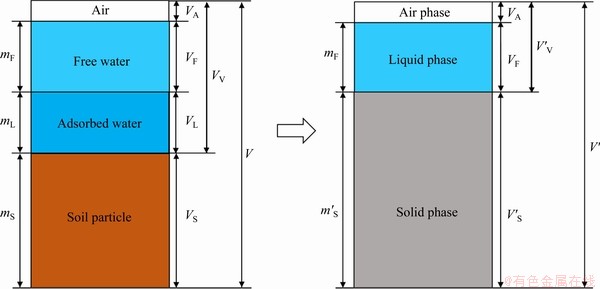
Figure 5 Three-phase schematic diagram of soil considering adsorbed water content
 (6)
(6)
Modified solid phase volume can be known from Figure 5:
 (7)
(7)
Substituting V��S from Eq. (7) into Eq. (6) can get the modified void ratio:
 (8)
(8)
 (9)
(9)
where e, e��, wg, Gs and ��g represent the conventional void ratio, the modified void ratio, the adsorbed water content, the specific gravity of soil particles, and the adsorbed water density respectively, and ��g=1.3 g/cm3.
Void ratio is an important index in engineering soil, which has a great influence on the calculation of consolidation settlement and permeability of soil. After considering adsorbed water as a part of the solid phase, the same initial conventional and modified void ratio of the four soil samples were set for laboratory consolidation tests and the consolidation and compression of the samples were observed. One-dimensional consolidation apparatus method was adopted for consolidation test. According to the specification for highway geotechnical test (JTGE40-2007), CH, MH, CL and ML soil specimens were prepared with the same initial void ratio. The height and area of the ring cutter used in the test are equal to 2 cm and 30 cm2, respectively. After the specimen preparation, the vacuum saturator was used for air extraction and saturation, and the test was started for 48 h after water immersion and saturation. According to the calculation of the overburden load in the actual soil engineering, the maximum load of the test was equal to 400 kPa. Under the side limit condition, the saturated ring cutter specimens were tested by the following sequence of loads, 50, 100, 200, 300 and 400 kPa. The duration of each level of load was equal to 24 h, and the tank was always filled with water. The compression change of the specimen with time and the overlying load were recorded. The consolidation compression curves of the test soil samples were sorted out, and the results are shown in Figures 6 and 7.
The results related to Figures 6 and 7 show that the height of the four soil samples decreases with increasing overburden pressure, and the compactness of the soil specimens increases.Figure 6 shows that the compression height of the CH, MH, CL and ML soil specimens increases with the overburden pressure, and the compression amount increases in turn, which is negatively related to the trend of their adsorbed water content. The compression curves were not consistent. The characteristics are different for the 4 soil specimens, which indicates that the initial conventional void ratio designed for the experiment is not its true void ratio. As the soil particle surface is negatively charged, in a saturated state, cations and dipole molecules in water molecules are adsorbed on the soil particles surface under the action of static electricity, and this adsorbed water is not easy to discharge under the action of external forces. The larger the specific surface area of the soil, the higher the content of adsorbed water on the particle surface. Therefore, consistent with the results of particle analysis tests, the higher the content of fine-grained soil, the higher the water content due to the soil absorption capacity, the stronger its water retention capacity, and the smaller the amount of compression change. It is not difficult to know from test results that the compressibility of good fillers considered in engineering is higher than that related to other poor soils, and the higher the adsorbed water content, the lower the compressibility of the soil. The consolidation curves of the 4 soil specimens shown in Figure 7 are nearly coincident, indicating that under the same overburden pressure, the compression changes of the soil samples are consistent. The initial modified void ratio set in the test is the true void ratio of the specimen. The modified void ratio can more accurately describe the internal pore characteristics of the soil. It can be seen that the content of adsorbed water has a certain effect on the compressibility of the soil.
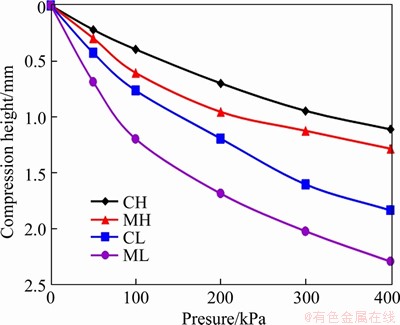
Figure 6 Consolidation curve at the same initial conventional void ratio
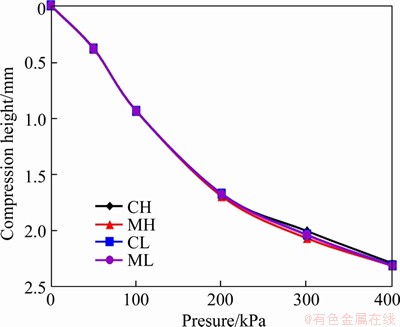
Figure 7 Consolidation curve at the same initial modified void ratio
5.2 Application in compaction control
Fine-grained soil is widely distributed in southern China, with high natural moisture content, strong hydrophilicity, and poor water stability. Because the south of China is dominated by hills and mountains, the construction of expressways often faces countless problems of excavation and treatment of fine-grained soil. From this situation, it is difficult to reach the compaction degree specified in the control standard due to the high moisture content of fine-grained soil in the humid climate of South China. Existing engineering practices in China have shown that using fine-grained soil as filling material for expressway subgrades, under the premise of meeting the requirements for strength and deformation associated with subgrade, can appropriately reduce the compaction control standards, and also ensure the long-term stability of the subgrade.
United States first proposed the concept of compaction and used it as an indicator of subgrade compaction control. The purpose of subgrade compaction is to minimize the volume changeable part (liquid phase and gas phase) in the subgrade soil, so as to avoid subgrade settlement after construction. Chinese and American highway subgrade design and construction technical specifications have proposed control standards for subgrade compaction. However, no matter what kind of soil quality is used, the adsorbed water was not considered in the determination of compaction. By measuring the adsorbed water content of fine-grained soil and testing the engineering properties of the filler, it can be found that the adsorbed water content in the fine-grained soil is large. The Japanese and British highway departments use air rate as an indicator for compaction control of fine-grained soil subgrade. This index takes into account soil particles, adsorbed water, and free water. Existing research results in soil quality and soil mechanics show that, in addition to strongly adsorbed water, part of the weakly adsorbed water has a solid-like property within a certain temperature range. Therefore, in the calculation of the compaction degree of the fine-grained soil used in the subgrade engineering, the adsorbed water should be considered as the solid phase part.
Engineering practice in Southern China has considered that adsorbed water will not be discharged during operation. In the engineering practice, the temperature of embankment filling is not more than 25 ��C, the natural temperature is not more than 30 ��C in hot and humid areas, the adsorbed water content is reduced by no more than 1% [39]. Moreover, the water content will increase year by year up to the vicinity of the soil plastic limit [40], and it cannot be discharged under the pressure during operation. Because the plastic limit is greater than the adsorbed water content, the adsorbed water in the fine-grained soil is relatively stable during the operation period after the moisture balance of the fine-grained soil subgrade is achieved until the end of the design life. Therefore, the adsorbed water can be regarded as a part of the solid phase of the fine-grained soil, and the compaction degree can be calculated.
A schematic diagram of the three phases after considering adsorbed water as a solid phase in soil is shown in Figure 5.
Assuming that the fine-grained soil is compacted at a state where the water content is greater than the adsorbed water content, the solid phase density at this time is:
 (10)
(10)
If the adsorbed water content of the soil is greater than the optimal water content, then the maximum solid phase density is given:
 (11)
(11)
The degree of compaction after considering the adsorbed water as a part of the solid phase in the soil is shown, referred to herein as the solid phase degree of compaction:
 (12)
(12)
where ��d, �ѡ�d, ��max, �ѡ�max and K�� represent the dry density, the solid phase dry density, the maximum dry density, the solid phase maximum dry density, and the solid-phase degree of compaction, respectively.
Because adsorbed water has the characteristics of approximately solid, and is relatively stable after the moisture balance of the fine-grained soil roadbed is achieved, the adsorbed water can be regarded as a part of the solid phase in the soil with the objective of considering it in the compaction degree calculation. A compaction degree equation of solid-phase based on adsorbed water content and optimal water content was proposed. The greater the difference between the adsorbed water content and the optimal water content, the greater the solid phase degree of compaction.
5.3 Application in engineering
The compaction degree control method of solid-phase related to fine-grained soil proposed in this paper has been applied to an embankment of Wanning-Yangpu Expressway in Hainan Province, China. (Sample-2 sampling point). The test results show that the average value of on-site degree of compaction is equal to 90.2%, which cannot meet the requirements of Chinese specifications; while the average value of compaction degree of solid-phase is equal to 93.6%, if the compaction degree of solid-phase is used as the standard, it can meet the requirements of Chinese specifications. The control method of the mentioned parameter proposed in this paper helps the subgrade engineering in southern China to make full and efficient usage of a large amount of fine-grained soil.
The settlement of the above embankment section is predicted by using the modified compression index. The humid climate in Hainan Province proved that it is vital to pay special attention to the embankment settlement after constructions. The height and the width of the embankment were equal to 8.0 and 12.25 m, respectively.
6 Conclusions
In this study, the adsorbed water in four fine-grained soils from different areas is studied. The adsorbed water content of test soil samples is measured by using different methods, and the difference among the adsorbed water content related to each soil sample is evaluated. The influence of adsorbed water on soil compression characteristics and compaction is studied. Based on the experimental results and previous analysis, the following conclusions can be drawn.
1) The desorption temperature range of adsorbed water is equal to 100-115 ��C, and the adsorbed water is the main part of the moisture content of fine-grained soil, which is difficult to be removed in the natural environment of normal construction.
2) The adsorbed water content of four fine-grained soils is tested by using thermogravimetry analysis and volumetric flask method. The adsorbed water density is determined by using back calculation of the results, and the value is about 1.30 g/cm3. A simple and accurate test method is obtained.
3) Through SEM and XRD tests, it is found that the ability of fine-grained soil to adsorb water is greatly affected by soil size, composition, clay mineral type and content.
4) Adsorbed water characteristics are different from free water, it has large density and is difficult to discharge it. It can be classified as a part of solid phase, which has an impact on the void ratio of soil. A modified equation of void ratio considering adsorbed water content is proposed and verified by utilizing engineering practice. Compared with the conventional calculation method, the modified equation of void ratio is closer to the prediction and monitoring results of settlement of fine-grained soil embankment. The adsorbed water content has a great influence on the engineering characteristics of soil, hence it is suggested that this parameter should be considered in engineering calculation.
5) Because adsorbed water has the characteristics of approximately solid, and is relatively stable after the moisture balance of the fine-grained soil roadbed is achieved, it can be regarded as a part of the solid phase in the soil, when carrying out the calculation of compaction degree.
References
[1] LOW P F. Nature and properties of water in montmorillonite-water systems [J]. Soil Science Society of America Journal, 1979, 43(4): 651-658. DOI: 10.2136/sssaj1979.036159950 04300040005x.
[2] SPOSITO G, PROST R. Structure of water adsorbed on smectites [J]. Chemical Reviews, 1982, 82(6): 553-573. DOI: 10.1021/cr00052a001.
[3] MEDVEDEVA N A, ANUKHINA A V. Evaluation of bound water forms in clays [J]. Engineering Geology World, 2018, 13(4, 5): 52-61. DOI: 10.25296/1993-5056-2018-13-4-5-52-61.
[4] CHENG L, FENTER P, NAGY K L, STURRCHIO N C. Molecular-scale density oscillations in water adjacent to a mica surface [J]. Physical Review Letters, 2001, 87(15): 156103. DOI: 10.1103/PhysRevLett.87.156103.
[5] ARENS P L. Moisture content and density of some caly minerals and some remarks on the hydration pattern of clay [J]. Transactions of the International Congress of Soil Science, 1950(1): 59-62
[6] MARTIN R T. Adsorbed water on clay: A review [J]. Clays & Clay Minerals, 1962, 9(1): 28-70. DOI: 10.1346/ CCMN.1960.0090104.
[7] MITCHELL J K, SOGA K. Fundamentals of soil behavior [M]. Hoboken: John Wiley & Sons, Inc. Press, 2005.
[8] BHARAT T V, SRIDHARAN A. Prediction of compressibility data for highly plastic clays using diffuse double-layer theory [J]. Clays & Clay Minerals, 2015, 63(1): 30-42. DOI: 10.1346/CCMN.2015.0630103.
[9] SRIDHARAN A. Soil clay mineralogy and physico-chemical mechanisms governing the fine-grained soil behavior [J]. Indian Geotechnical Journal, 2014, 44: 371-399. DOI: 10.1007/s40098-014-0136-0.
[10] BHARAT T V, SIVAPULLAIAH P V, ALLAM M M. Novel Procedure for the estimation of swelling pressures of compacted bentonites based on diffuse double layer theory [J]. Environmental Earth Sciences, 2013, 70: 303-314. DOI: 10.1007/s12665-012-2128-7.
[11] TRIPATHY S, SRIDHARAN A, SCHANZ T. Swelling pressures of compacted bentonites from diffuse double layer theory [J]. Canadian Geotechnical Journal, 2004, 41(3): 437-450. DOI: 10.1139/t03-096.
[12] GRISMER M E. Water vapor adsorption kinetics and isothermal infiltration [J]. Soil Science, 1988, 146(5): 297-302. DOI: 10.1097/00010694-198811000-00001.
[13] KAGAYAMA T, OOMI G. Sate and location of water adsorbed on clay minerals: Consequences of the hydration and swelling-shrinkage phenomena [J]. Clays & Clay Minerals, 1998, 46(2): 117-131. DOI: 10.1346/CCMN.1998.0460201.
[14] WANG Y, LU S, REN T, LI B. Bound water content of air-dry soils measured by thermal analysis [J]. Soil Science Society of America Journal, 2011, 75(2): 481-487. DOI: 10.2136/ sssaj2010.0065.
[15] KULIGIEWICZ A, DERKOWSKI A. Tightly bound water in smectites [J]. American Mineralogist, 2017, 102: 1073-1090. DOI: 10.2138/am-2017-5918.
[16] LIN R S, WANG X Y, LEE H S, CHO H K. Hydration and microstructure of cement pastes with calcined hwangtoh clay [J]. Materials, 2019, 12(3): 458-501. DOI: 10.3390/ ma12030458.
[17] ZHANG R, WU M L, PRINCE K, GAO Q F. Influence of loosely bound water on compressibility of compacted fine-grained soils [J]. Advances in Civil Engineering, 2020, Article ID 1496241. DOI: 10.1155/2020/1496241.
[18] CALVET R. Cation migration into empty octahedral sites and surface properties of clays [J]. Clays & Clay Minerals, 1971, 19(3): 175-186. DOI: 10.1346/CCMN.1971.0190306.
[19] RASCIO A, NICASTRO G, CARLINO E, FONIO N D. Differences for bound water content as estimated by pressure�Cvolume and adsorption isotherm curves [J]. Plant Science, 2005, 169(2): 395-401. DOI: 10.1016/j.plantsci.2005.03.026.
[20] HATAKEYAMA T, NAKAMURA K, HATAKEYAMA H. Determination of bound water content in polymers by DTA, DSC and TG [J]. Thermochimica Acta, 1988, 123(1): 153-161. DOI: 10.1016/0040-6031(88)80018-2.
[21] DEIRIEH A A M. From clay slurries to mudrocks: A cryo-SEM investigation of the development of the porosity and microstructure [D]. Boston: Massachusetts Institute of Technology, 2016.
[22] ZUO R, DU G, YANG W, LIAO L, LI Z. Mineralogical and chemical characteristics of a powder and purified quartz from Yunnan Province [J]. Open Geosciences, 2016, 8(1): 606-611. DOI: 10.1515/geo-2016-0055.
[23] RAJKUMAR K, RAMANATHAN A L, BEHERA P N. Characterization of clay minerals in the sundarban mangroves river sediments by SEM/EDS [J]. Journal Geological Society of India, 2012, 80: 429-434. DOI: 10.1007/s12594-012-0161-5.
[24] RAMON A. ALVAREZ P, SANTOS D S D, BLANCO C, ECHEVERRIA J, GARRIDO J. Particle and surface characterization of a natural illite and study of its copper retention [J]. Journal of Colloid and Interface Science, 2005, 285(1): 41-49. DOI: 10.1016/j.jcis.2004.11. 044.
[25] MARSH A, HEATH A, PATUREAU P, EVERNDEN M, WALKER P. Alkali activation behaviour of uncalcined montmorillonite and illite clay minerals [J]. Applied Clay Science, 2018, 166(15): 250-261. DOI: 10.1016/j.clay.2018. 09.011.
[26] CHITTOORI B, PUPPALA A J. Quantitative estimation of clay mineralogy in fine-grained soils [J]. Journal of Geotechnical and Geoenvironmental Engineering, 2011, 137(11): 997-1008. DOI: 10.1061/(ASCE)GT.1943-5606. 0000521.
[27] HE S, YU X, BANERJEE A, PUPPALA A J. Expansive soil treatment with liquid ionic soil stabilizer [J]. Transportation Research Record, 2018, 2672(52): 185-194. DOI: 10.1177/ 0361198118792996.
[28] ZHANG C, LU N. What is the range of soil water density? critical reviews with a unified model [J]. Reviews of Geophysics, 2018, 56(3): 532-562. DOI: 10.1029/2018RG 000597.
[29] BAHRAMIAN Y, BAHRAMIAN A, JAVADI A. Confined fluids in clay interlayers: A simple method for density and abnormal pore pressure interpretation [J]. Colloids and Surfaces A: Physicochemical and Engineering Aspects, 2016, S0927775716306525. DOI: 10.1016/j.colsurfa.2016.08.021.
[30] KURICHETSKY �� H. The combination of soil water translation [M]. Beijing, China: Geological Publishing House Press, 1982.
[31] ZHANG C, LU N. Soil sorptive potential: Its determination and predicting soil water density [J]. Journal of Geotechnical and Geoenvironmental Engineering, 2020. 146(1): 04019118. DOI: 10.1061/(ASCE)GT.1943-5606.0002188.
[32] JACINTO A C, VILLAR M V, LEDESMA A. Influence of water density on the water-retention curve of expansive clays [J]. G��otechnique, 2012, 62(8): 657-667. DOI: 10.1680/ geot.7.00127.
[33] FERNANDEZ A M, BAEYENS B, BRADBURY M, RIVAS P. Analysis of the porewater chemical composition of a Spanish compacted bentonite used in an engineered barrier [J]. Physics and Chemistry of the Earth, 2004, 29(1): 105-118. DOI: 10.1016/j.pce.2003.12.001.
[34] KUCERIK J, TOKARSKI D, DEMYAN M S, MERBACH I, SIEWERT C. Linking soil organic matter thermal stability with contents of clay, bound water, organic carbon and nitrogen [J]. Geoderma, 2018, 316: 38-46. DOI: 10.1016/ j.geoderma.2017.12.001.
[35] LI Y L, WANG T H, SU L J. Determination of bound water content of loess soils by isothermal adsorption and thermogravimetric analysis [J]. Soil Science, 2015, 180(3): 90-96. DOI: 10.1097/SS.0000000000000121.
[36] HOLT R M, KOLST M I. How does water near clay mineral surfaces influence the rock physics of shales? [J] Geophysical Prospecting, 2017, 65(6): 1615-1629. DOI: 10.1111/1365-2478.12503.
[37] SHANG X Y, ZHOU G Q, KUANG L F, CAI W. Compressibility of deep clay in east china subjected to a wide range of consolidation stresses [J]. Canadian Geotechnical Journal, 2015, 52(2): 244-250. DOI: 10.1139/cgj-2014-0129.
[38] OSIPOV V I, KARPENKO F S, RUMYANTSEVA N A. Active porosity and its effect on the physical mechanical properties of clay [J]. Water Resources, 2015, 42(7): 951-957. DOI: 10.1134/S009780781507009X.
[39] SHAO Yu-xian, SHI Bin, LIU Chun, GU Kai, TANG Chao-sheng. Temperature effect on hydro-physical properties of clayey soils [J]. Chinese Journal of Geotechnical Engineering, 2011, 33(10): 1576-1582. DOI: 10.1111/j.1759-6831.2010. 00113.x. (in Chinese)
[40] ZHENG Jian-long, ZHANG Rui. Prediction and control method for deformation of highway expansive soil subgrade [J]. China Journal of Highway and Transport, 2015, 28(3): 1-10. DOI: 10.1109/ICNP.2015.33. (in Chinese)
(Edited by FANG Jing-hua)
���ĵ���
ϸ�����������ˮ�����IJⶨ������Ӧ��
ժҪ�����IJⶨ��ϸ����������ˮ�ĺ��������ܶȣ������ݲ��Խ���Ľ��˹���ѹʵ�Ⱥ����Ŀ�϶�ʼ��㷽����ѡȡ���ҹ���ͬ������4��ϸ�����������ط�������ƿ���ⶨ��4��ϸ����������ˮ�������ܶȣ�����ɨ��羵��X������������˸�������ˮ�����IJ��졣Ϊ���о�����ˮ��ѹ�����ԣ����ù̽ᷨ��4�ֱ����������������顣�������������ˮ�Ľ����¶ȷ�ΧΪ100~115 ��C���ܶ�Ϊ����1.30 g/cm3������ˮ�Ըߺ�ˮ��ϸ�������ֵ�ѹ�����л������á����⣬��·����Ӫ�ڣ�����ˮ����һ���ȶ�ֵ���������ų���ͨ������ʵ����ϸ����·�̵ij���������Ԥ�⣬�봫ͳ�ļ��㷽����ȣ����øĽ���Ŀ�϶����Ϊ�������м�����ӽ��ֳ��������
�ؼ��ʣ��������ˮ������ƿ�������ط���������϶�ʣ�����
Foundation item: Project(51978085) supported by the National Natural Science Foundation of China; Project (K2019G045) supported by the Science and Technology Research and Development Plan of China National Railway Group Co., Ltd.; Project(201808430102) supported by the China Scholarship Council
Received date: 2020-04-09; Accepted date: 2020-10-22
Corresponding author: ZHANG Rui, PhD, Professor; Tel: +86-18508428180; E-mail: zr@csust.edu.cn; ORCD: https://orcid.org/0000-0003-2451-7103
Abstract: In this paper, the content and density of adsorbed water in fine-grained soil are determined. According to the test results, the calculation method of compaction degree of the solid-phase and void ration of soil is improved. Four kinds of fine-grained soils from different regions in China were selected, and the adsorbed water content and density of four kinds of fine-grained soils were determined by thermogravimetry and volumetric flask method. Furthermore, SEM and XRD experiments were used to analyze the differences in the ability of each soil sample to absorb water. In order to study the compression characteristics of adsorbed water, four saturated soil samples were tested by consolidation method. The results show that the desorption temperature range of the adsorbed water and its density were equal to 100-115 ��C and 1.30 g/cm3, respectively. Adsorbed water plays a positive role in keeping the compressibility of fine-grained soil at a low rate when it has high water content. Besides, adsorbed water can be a stable parameter and is difficult to discharge during the operation period of subgrade. The settlement of fine-grained soil embankment is predicted by engineering example, and compared with the result of conventional calculation method. The results show that it is more close to the field monitoring results by using the improved void ratio of soil as the parameter.
