
J. Cent. South Univ. (2016) 23: 379-393
DOI: 10.1007/s11771-016-3083-3

Mechanism and optimization of fuel injection parameters on combustion noise of DI diesel engine
ZHANG Qing-hui(�����), HAO Zhi-yong(��־��), ZHENG Xu(֣��), YANG Wen-ying(����Ӣ), MAO Jie(ë��)
College of Energy Engineering, Zhejiang University, Hangzhou 310027, China
 Central South University Press and Springer-Verlag Berlin Heidelberg 2016
Abstract:
Combustion noise takes large proportion in diesel engine noise and the studies of its influence factors play an important role in noise reduction. Engine noise and cylinder pressure measurement experiments were carried out. And the improved attenuation curves were obtained, by which the engine noise was predicted. The effect of fuel injection parameters in combustion noise was investigated during the combustion process. At last, the method combining single variable optimization and multivariate combination was introduced to online optimize the combustion noise. The results show that injection parameters can affect the cylinder pressure rise rate and heat release rate, and consequently affect the cylinder pressure load and pressure oscillation to influence the combustion noise. Among these parameters, main injection advance angle has the greatest influence on the combustion noise, while the pilot injection interval time takes the second place, and the pilot injection quantity is of minimal impact. After the optimal design of the combustion noise, the average sound pressure level of the engine is distinctly reduced by 1.0 dB(A) generally. Meanwhile, the power, emission and economy performances are ensured.
Key words:
diesel engine; injection parameters; pilot injection; combustion noise; online optimization��
1 Introduction
Diesel engines have been widely installed on passenger cars and have broad market prospects because of their better fuel economy and lower CO2 emission than gasoline engines [1]. However, due to the rough working process of compression ignition of a diesel engine, the considerable level of noise and vibration causes the problem of ride comfort of diesel cars [2�C4], which has caught people��s attention.
Internal combustion engine noise mainly consists of aerodynamic noise, mechanical noise and combustion noise. For a direct injection (DI) diesel engine, combustion noise is one of the most important noise sources, which is dominant at low and medium rotating speeds [5�C6]. Therefore, the studies of influence factors and optimization of combustion noise play an important role in noise reduction for diesel engines.
Combustion noise is generated from the revulsion of cylinder pressure caused by the rapid combustion of diesel and air mixture in the combustion chamber [7]. Combustion noise and mechanical noise are inseparable in most cases. And the combustion noise has been obtained by different means in the past research. HE et al [8] and CAI and CAI [9] toke pressure rise rate and pressure oscillation to indicate the combustion noise, respectively. However, only one factor was considered in their research. Different methods of digital signal processing were also used to separate the combustion noise [2, 10�C11]. Nonetheless, the separation method was usually suitable for single-cylinder engines. Besides, motoring method and individual cylinder fuel cut method were also common ways to obtain the combustion noise [12�C13]. However, the high equipment requirements and low veracity were not negligible. Therefore, the effect of fuel injection parameters on combustion noise was studied by an improved attenuation curve method and the combustion noise was optimized by measured engine noise in this work.
The combustion noise is induced by the transmission from the cylinder pressure to the exterior through the engine components such as the block and the cylinder head cover. Then, a linear attenuation relationship from the cylinder pressure to the combustion noise can be established when the transmission is linear, which is the attenuation theory. The earliest attenuation curve theory was put forward by AUSTEN and PRIEDE [14]. And then, they put forward attenuation curves by analyzing the relation between the cylinder pressure and engine noise, and then used them on engine noise control [6�C7]. Though the traditional attenuation curves are commonly used, they cannot predict engine noise accurately. One of the reasons is that the structure transmission attributes are different in accordance to the different type, size and design of internal combustion engines. On the other hand, the attenuation characteristic is variable when the operating condition changes for the same engine. Consequently, for a certain engine working under a certain condition, the specific attenuation curve is required.
Thanks to the application of high pressure common rail injection system, the fuel injection quantity and timing can be accurately controlled. Multi-injection can also be easily achieved [15�C16]. Researchers have done a lot of work on the effect of the injection parameters to reasonably design the injection strategy to reduce the engine noise [16�C22]. But, the effect of injection parameters has not been deeply analyzed. The previous engine noise optimization was based on the separated or computed combustion noise, which could cost a considerable amount of time to accomplish the noise optimization task. Moreover, the emission performance of the engine was not taken into consideration.
In the present work, a bench test for measuring the cylinder pressure and radiation noise of a diesel engine was designed on the basis of previous studies. The generation mechanism of the combustion noise and the rationality of the improved attenuation curve method were described in detail. Then, the attenuation curves of the engine under different conditions were obtained. The effect of the injection parameters (including main injection advance angle (MIAA), pilot injection interval time (PIIT) and pilot injection quantity (PIQ)) on combustion noise was discussed on the basis of these attenuation curves. At last, the engine noise was optimized by an online optimization method.
2 Experiment
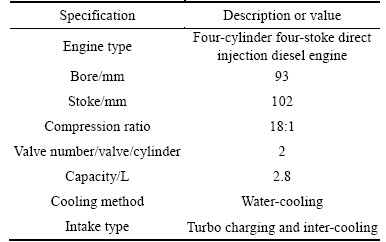
The engine used for this experiment is a turbocharged four-cylinder water-cooled four-stroke- cycle diesel engine. The specification of the engine is listed in Table 1.
Table 1 Specification of diesel engine
The whole experimental facilities are shown in Fig. 1. The flywheel end of the diesel engine is connected with an electric eddy current dynamometer to control the operating condition of the engine, including engine rotation speed and torque. The test equipment mainly consists of three parts: the cylinder pressure test section, the engine noise test section and the emission test section.
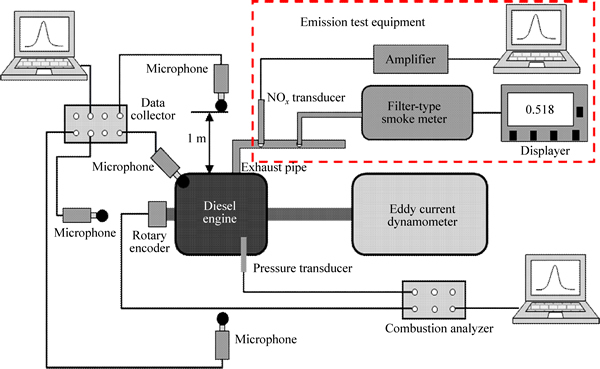
Fig. 1 Schematic diagram of experimental setup
All of the experimental setup is set in a semi- anechoic room. To measure the engine noise, a 3560C type vibration and noise test front end manufactured by Danish B&K Company and pulse8.0 post-processing software are used. Four MPA201 type 1/2 inch microphones are placed at the exhaust side, intake side, front and top of the engine, respectively. The perpendicular distance from each microphone to the engine surface is 1 m according to GB/T 1895�C2000. The sampling frequency is 25.6 kHz and the measuring time is 5 s. The operation noise and cooling water noise of the dynamometer are shielded by covering made with porous sound absorption material. And the air inlet and exhaust port are led to the outside to avoid the interference caused by intake and exhaust noise. The accuracy of the noise test can be improved.
The pressure variation in the fourth cylinder is measured by Kibox 2893AK1 combustion analyzer. The analyzer consists of a pressure sensor, a crankshaft position sensor, a signal amplifier and collector, connecting wires and an analysis software. The piezoelectric cylinder pressure sensor is installed in the fourth cylinder through the heater plug hole to measure the cylinder pressure at each 0.1�� crankshaft angle (CA). The crankshaft position sensor is fixed on the pulley of crankshaft and the center shaft of the sensor rotates with crankshaft. Their signals are both input to the signal amplifier and collector and analysis system. The cylinder pressure should be collected for at least 50 operating cycles in order to get average data.
The NOx and PM emissions are monitored to assess the emission performance of the engine during operation. The ceramic NOx sensor is installed in the exhaust pipe through thread. And the NOx content is measured when the exhaust gas flows past the sensor probe directly. The filter paper type 415S smoke meter is used to monitor PM content. The above measurements are carried out three times in every experiment to avoid abnormal data. And then, the three data are averaged as the final result. The emissions testing equipment is only installed in the experiment of NOx and soot emissions optimization.
3 Effect of injection parameters on combustion noise
Figure 2 shows the average sound pressure levels at a near distance from the engine under full load, half load and motored conditions. As shown in Fig. 2, the engine noises have large differences among the three different loads at the same engine speed. And the difference becomes smaller when the engine speed rises. The engine noises under full load and half load are almost the same at the speeds above 2600 r/min. And the noises under all three loads are basically equal at the rotation speed of 3400 r/min. Therefore, combustion noise takes a large proportion of the engine noise and dominates at low to medium rotating speeds. And at higher speeds, it is the mechanical noise that dominates the engine noise. So, the study of the combustion noise is important for the optimization of engine noise at low to medium engine speed.
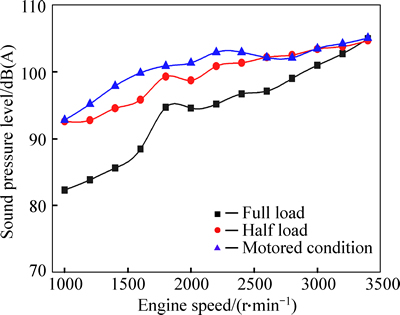
Fig. 2 Engine noise at different load conditions
3.1 Generation mechanism of engine combustion noise
As shown in Fig. 3, the generation of combustion noise contains three processes. Firstly, the cylinder pressure impacts the combustion chamber wall and motivates the vibration of engine structure. Secondly, the vibration is transmitted to the engine surface through the engine body and piston-connecting rod-crankshaft. At last, the vibrative surface radiates airborne noise [2, 23].
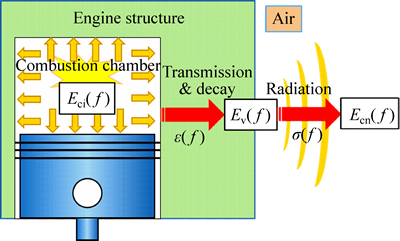
Fig. 3 Sketch of generation mechanism of engine combustion noise
In a period of time, the mean combustion impact energy in multiple cycles can be defined as [2, 23]
 (1)
(1)
where Eci(f) is the mean combustion impact energy and f means the variable is in the frequency domain;  is the cylinder pressure; ��c is the acoustic radiation impedance;
  is the average contact area between the mixture and the combustion chamber wall in a working cycle.
The combustion impact is converted into engine surface vibration when being transmitted through the engine components. This process can be written as follows [24]:
 (2)
(2)
where Ev(f) is the engine surface vibration energy, and ��(f) is the transfer coefficient of the engine structure. Considering the engine structure as a linear system, the transfer coefficient ��(f) at a specific frequency is constant when the engine structure and operating condition are invariant.
And then, the process of combustion noise radiation can be given by [25]
 (3)
(3)
where Ecn(f) is the combustion noise energy, ��( f) is the acoustic radiation efficiency, and ��( f) is also constant when the engine structure and material are invariant.
Consequently, integrating Eqs. (1) and (2), the process from combustion impact to combustion is
 (4)
(4)
The total radiation noise of engine can be expressed by [22]
 (5)
(5)
where Emn is the mechanical noise of engine.
So, it is defined that
 (6)
(6)
On one hand, when the engine operates at low to medium speeds, the engine noise is dominated by the combustion noise. And the mechanical noise takes a small proportion of the engine noise. The mechanical noise can be considered as constant when the engine speed and load are invariant and the cylinder pressure changes are small at the same time. Under these circumstances, the transfer coefficient �ǡ���(f)=Emn(f)/Eci(f) can be approximated as a constant value.
On the other hand [2],
 (7)
(7)
where  is the average sound pressure on the envelope surface of the engine, and An is the area of the envelope surface.
Substituting Eq. (1) into Eq. (7), it can be derived that
 (8)
(8)
Then, attenuation value of the cylinder pressure in frequency domain is

 (9)
(9)
It can be seen from the process above that the attenuation value La(f) is related to engine structure and operating condition, which can be approximated as a constant value when the engine works at low to medium speeds and the load and speed are invariant. The attenuation curve at a specific engine speed and load can be obtained through measuring the cylinder pressure and engine noise. And then, engine noise can be calculated by the cylinder pressure and the improved attenuation curves in the following research.
3.2 Improved attenuation curve method
The attenuation characteristics of the diesel engine and the attenuation curves at different speeds are obtained. For instance, the attenuation at 1000 r/min is introduced. The first cylinder pressure and sound pressure at each measure point are measured. Then, the measured time domain results are transferred to the cylinder pressure level and the sound pressure level in one-third octave by FFT transform, as shown in Fig. 4. The average sound pressure level of the engine is obtained by
 (10)
(10)
where  is the average sound pressure level in the center frequency of f, N is the number of measure points, and Lp(f) is the sound pressure level at the ith measure point.
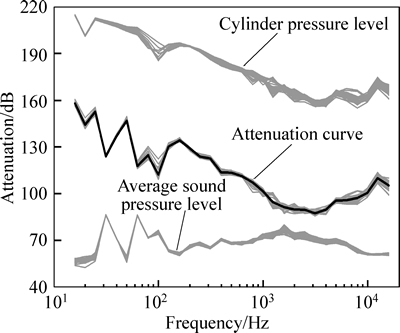
Fig. 4 Calculation of attenuation curve at 1000 r/min
An attenuation curve can be obtained by subtracting the average sound pressure level of the engine from the cylinder pressure level in one-third octave. The fuel injection parameters are changed to calculate another attenuation curve while the engine speed is held at 1000 r/min under full load. The calculation process above is repeated to obtain the attenuation curves, as shown in Fig. 4. These curves have the similar trend in the concerned frequency range, while the values at the same center frequency are consistent with each other. Eventually, the attenuation curve (the black curve in Fig. 4) at 1000 r/min is obtained by numerically fitting these curves.
The attenuation curves of the engine at different speeds are calculated by the method above. The attenuation characteristics of the engine structure at 1000, 1600 and 2200 r/min are similar in frequency range, as shown in Fig. 5. The attenuation is very high in low frequency range and gradually declines as the frequency increases until 1000�C3000 Hz in which the attenuation reaches the minimum. And then, the attenuation rises as the frequency increases above 3000 Hz. At the same center frequency, the attenuation increases along with the rise of the engine speed in 0�C150 Hz and decreases in 500�C3000 Hz.
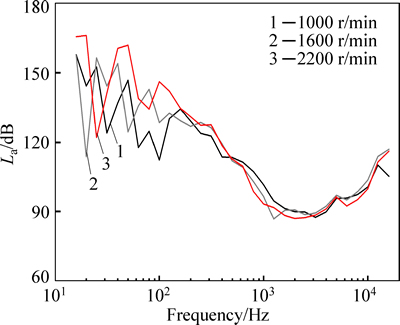
Fig. 5 Attenuation curves at different engine speeds
The engine noise at different speeds is predicted by these attenuation curves. Figure 6 shows the comparison between the predicted engine noise and the measured engine noise. It can be seen that the values are uniform and close around the straight line. The predicted value and the measured value are basically the same. The attenuation curves obtained in this section are credible and can be used in the following research.
3.3 Effect of main injection advance angle
For the diesel engine in this research, the fuel is injected into the cylinder twice��pilot injection and main injection in one working cycle. In this section, the TIQ (total injection quantity), PIQ and PIIT are fixed at specific value while MIAA is variable at each engine speed. The variation range of MIAA was controlled between �C10 and 2.5�� CA.
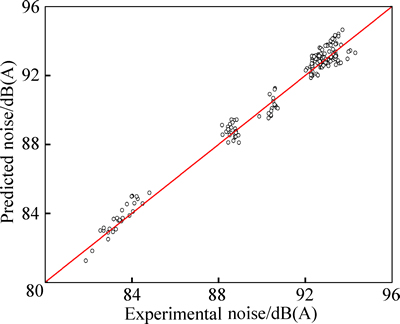
Fig. 6 Engine noise predicted by attenuation curves
MIAA has important effects on in-cylinder combustion process. The ignition delay and the combustible mixture generated in ignition delay period can be reduced by appropriate injection timing. And then, the rate of combustion and pressure oscillation in the rapid burning duration can be restrained. Consequently, the combustion noise can be reduced. As shown in Fig. 7, the engine noise has different variations as the MIAA changes at different speeds. As the main injection timing advances, the engine noise rises at 1000 r/min. However, it declines at 1400, 1600 and 2600 r/min. Nevertheless, it decreases at first and then decreases at 1800�C2200 r/min.

Fig. 7 Effect of MIAA on predicted engine noise
The combustion process under the condition of full load at 1000 r/min is explored to discuss the effect of the MIAA on combustion noise. The original injection parameters at 1000 r/min are listed in Table 2. The pilot injection strategy is fixed at original value while the main injection timing varies. Figure 8 shows the cylinder pressure at different MIAAs. As shown in Fig. 8(a), the cylinder pressure curves have two peaks because of two fuel injections. The first peak is lower due to the small PIQ. The pressure slightly declines after the first peak and then rises sharply until the second peak. It can also be seen that after deterring the main injection timing these two peaks shift backwards and the peak values become lower. When the MIAA is put off to �C10�� CA, the combustion pressure peak value is almost equal to the compressed air pressure. But, the pressure at the MIAA of �C10�� CA is higher than that at other two MIAAs in the after-burning period.
Table 2 Original injection parameters at 1000 r/min

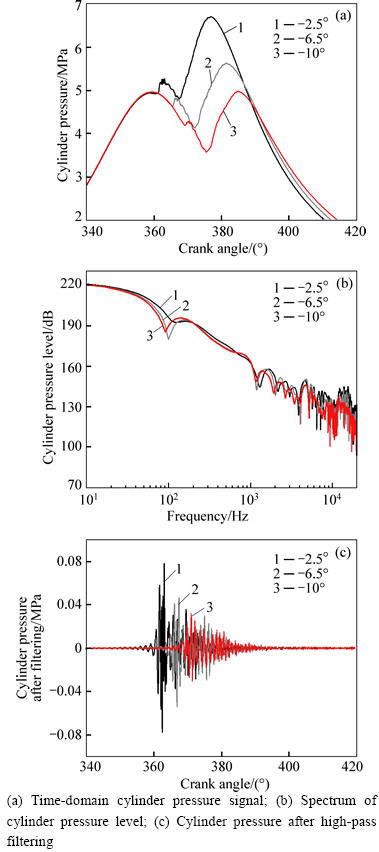
Fig. 8 Cylinder pressure of diesel engine with different MIAAs:
As shown in Fig. 8(b), the cylinder pressure level reaches the maximum in low frequency range and goes down as the frequency rises in a general view. The pressure level curves have valleys at around 100 Hz. And those smoothly decline in 100�C1000 Hz while fluctuantly decline in 1000�C4000 Hz. Moreover, the curves rise slightly at 4000 Hz above which the pressure oscillation occurs. When the main injection advance timing is deferred, the cylinder pressure level remains invariant below 1000 Hz. However, it distinctly goes down above 1000 Hz, especially at around 4000 Hz.
The cylinder pressure after 4000 Hz high-pass filtering is shown in Fig. 8(c). As can be seen from the chart, the cylinder pressure oscillation mainly occurs at the first peak which is close to top dead center and gradually recedes. As the main injection timing delays, the time of the pressure oscillation occurrence also steps back and its amplitude declines. The maximum amplitudes of the pressure oscillation at the MIAA of �C2.5��, �C6.5�� and �C10�� are 0.0778, 0.0537 and 0.0321 MPa respectively.
Figure 9 shows the curves of the pressure rise rate and the heat release rate to investigate the variation of the in-cylinder combustion. It can be seen from Fig. 9(a) that the pressure rise rate curves have two peaks, which is the same as the pressure curves. After delaying the main injection timing, the maximum value of the pressure rise rate is almost unchanged but the curves change distinctly with the tendency of postponement. Meanwhile, the first peak dramatically becomes lower. And the combustion rate declines. So, the cylinder pressure variation becomes gentle. Moreover, the beginning of burning is kept away from the top dead center, which leads to a larger combustion chamber space. The probability of the pressure oscillation occurrence is reduced. At the same time, the second peak value almost remains the same. Whereas the duration of the maximum pressure rise rate gets shorter, which means that the duration of the violent variation of cylinder pressure turns shorter too. And eventually, the combustion noise is reduced. It can also be seen from Fig. 9(b) that as the main injection timing delays, the heat release rate curve of the in-cylinder combustion postpones accordingly. The peak values of these three curves are fundamentally the same while the duration of the maximum heat release rate elongates, which means that the in-cylinder combustion rate gets down and the duration of the heat releasing varies from an extremely minimal value to a relatively longer one. And then, the cylinder pressure variation becomes gentle and the combustion noise dwindles.

Fig. 9 Comparison with effect of main injection advance angle:
3.4 Effect of pilot injection interval time
The pilot fuel injection means that a small amount of diesel fuel is injected into the cylinder and burns before the main injection to increase the temperature of the gas and the cylinder wall, in order to shorten the ignition delay and ameliorate the combustion process. As shown in Fig. 10, the measured engine noise with pilot injection is much lower than that without pilot injection at low and medium speeds of 1000�C2200 r/min. The pilot injection greatly reduces the engine noise, especially at 1000 r/min with the reduction of 8.9 dB(A).
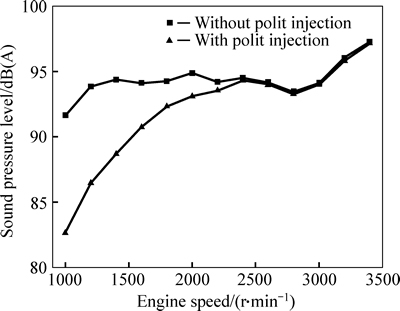
Fig. 10 Comparison of engine noise with and without pilot injection
There are two parameters to control the pilot injection in the injection strategy. One is the interval time from the pilot injection to the main injection. The other is the pilot fuel injection quantity. The first parameter will be studied in this section while the MIAA, PIQ and TIQ are fixed.
Only the appropriate pilot interval time can reduce combustion noise. The change rule of the engine noise along with the variation of pilot interval time at each engine speed is shown in Fig. 11. The variation range of pilot interval time in the experiment is set as 1038�C 2100 ��s. In Fig. 11, as the PIIT lengthens, the engine noise rises at first and goes down later at 1000, 1400 and 1600 r/min. At the same time, it monotonically increases at 1800, 2000 and 2200 r/min and decreases at 2600 r/min. The condition of 1000 r/min full load will be taken as an example to investigate the effect of PIIT.

Fig. 11 Effect of PIIT on predicted engine noise
Figure 12 indicates the comparison of cylinder pressure among five different situations. As seen in Fig. 12(a), a large amount of fuel burns in an instant and the cylinder pressure rises rapidly in the case of conventional combustion without pilot injection. After introducing pilot injection, the fuel burning becomes gentle and the peak pressure decreases. As the PIIT increases, the pressure peak of the pilot combustion moves forward and the peak value goes up. It can also be seen from Fig. 12(b) that the cylinder pressure level without pilot injection is much higher than that with pilot injection in the frequency range of 100�C4000 Hz, in which the engine noise energy is concentrated. However, the spectra of the cylinder pressure level remain basically unchanged as the pilot injection time varies. But the amplitude of the pressure oscillation gradually decreases (Fig. 12(c)). The start time moves forward, so the duration of the pressure oscillation lengthens. And the spectrum of cylinder pressure level almost stays unchanged above 4000 Hz. But the pressure level curves have valleys in 800�C4000 Hz, which move to lower frequencies as the PIIT increases.
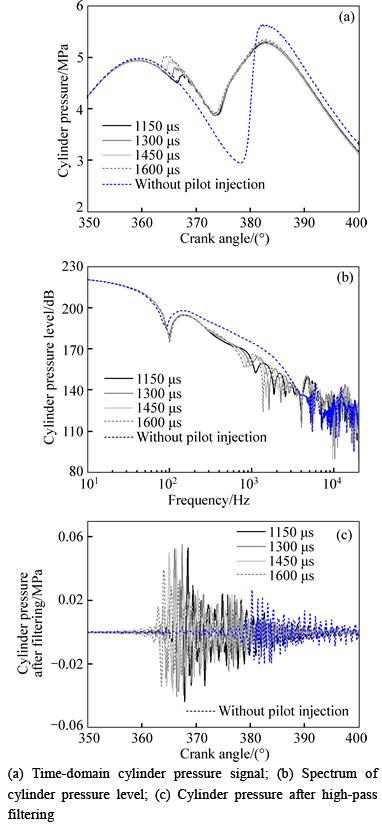
Fig. 12 Cylinder pressure of diesel engine with different PIITs:
The pressure rise rate and the heat release rate curves are shown in Fig. 13. It can be seen that, the peak pressure rise rate and the heat release rate without pilot injection are so much higher than those with pilot injection. This means that the conventional combustion process is very violent, which leads to the rude working of the engine and a high level of vibration and noise. After introducing the pilot injection, there are two peaks in one curve and even the higher peak value is much lower than that without pilot injection. And the engine operating process becomes gentler. Meanwhile, in Fig. 13(a), the first peak of the pressure rise rate moves forward and the peak value rises gradually as the PIIT increases. But the second peak doesn��t move in time domain. The peak value first increases and then decreases and reaches the highest peak at 1300 ��s. It can be seen from Fig. 13(b) that when prolonging the PIIT, the first peak of the heat release rate also moves forward and the peak value decreases gradually. The time location of the second peak doesn��t move as well and the peak value shows a trend of descending after ascending. Taking it all around, the combustion rate is higher at around 1300 ��s and the cylinder pressure varies violently. These go against reducing the combustion noise and the engine noise is the highest at 1300 ��s.
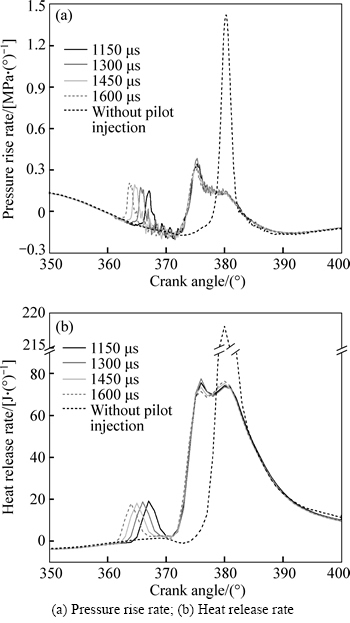
Fig. 13 Comparison with effect of pilot injection interval time:
3.5 Effect of pilot injection quantity
The different engine noise along with the variation of the PIQ at each speed is shown in Fig. 14. It can be seen that as the PIQ rises from 1.04 mg to 2.56 mg, the engine noise increases slightly at 1000�C1600 r/min. At 1800�C2600 r/min, the variation of engine noise is very unobvious. The effect is also studied by taking 1000 r/min as an example.
The cylinder pressure at different PIQs is shown in Fig. 15. As shown in Fig. 15(a), after increasing the PIQ, the first peak of the cylinder pressure goes up but the second peak almost gets unchanged. The downtrend of the pressure after the first peak becomes slow. And the valley value becomes higher. And then, the pressure rises slowly in the rapid burning duration. It can also be seen from Fig. 15(b) that as the PIQ augments, the cylinder pressure level almost remains unchanged in 10�C100 Hz. But it decreases slightly in 100�C700 Hz and around 1100 Hz, while it increases in 1400�C6000 Hz. So, the augment of the PIQ can lead to the enlargement of the pressure oscillation. The cylinder pressure after 4000 Hz high-pass filtering is shown in Fig. 15(c). When increasing the PIQ, the amplitude of the pressure oscillation goes up gradually. The amplitudes at 1.08, 1.68 and 2.08 mg are 0.0354, 0.0415 and 0.0477 MPa, respectively.
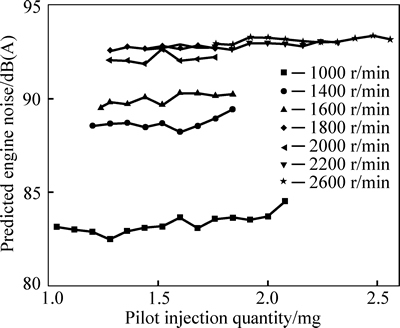
Fig. 14 Effect of PIQ on predicted engine noise
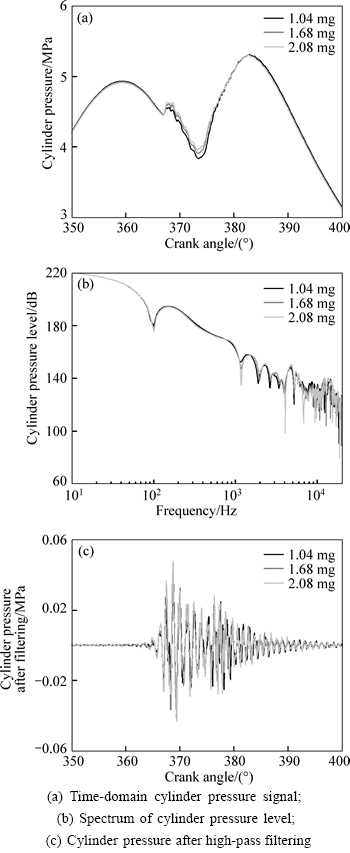
Fig. 15 Cylinder pressure of diesel engine with different pilot injection quantity:
As shown in the pressure rise rate curves (Fig. 16(a)), after increasing the PIQ, the first peak of the pressure rise rate rises obviously while the second peak decreases distinctly. So, the maximum pressure rise rate declines accordingly. It can be seen from the heat release rate curves (Fig. 16(b)) that, when the PIQ rises, the first peak of the heat release rate increases while the second peak decreases. And the curve of the heat release rate becomes gentle. This means that after the enlargement of the PIQ, more heat is released in the early combustion period. The gas temperature becomes higher. These effectively shorten the ignition delay, reduce the pressure rise rate in the rapid burning duration and lead the heat to release gentler. However, the increase of gas temperature aggravates the pressure oscillation in cylinder. And then, combustion noise becomes higher.

Fig. 16 Comparison with effect of pilot injection quantity:
4 Online optimization of combustion noise
The optimization of combustion noise is to reduce the engine noise by improving the in-cylinder combustion process. The methods of separating combustion noise from the engine noise usually need complex calculations. Moreover, the errors cannot be avoided. Besides, the improved attenuation curve method also needs a large amount of post-processing work. These methods cannot be used in the online optimization of combustion. In this section, a simple but effective way will be applied to optimizing the combustion noise online.
4.1 Method introduction
The mechanical noise of an engine can be considered as invariant under the condition of a fixed speed and load [26]. At this time, the variation of the engine noise is directly related to that of combustion noise. So, the variation of the engine noise caused by changing injection strategy is considered to be the variation of combustion. The direct measurement of the engine noise instead of the separation of combustion noise achieves the online assessment of combustion and greatly improves the working efficiency.
The optimization of combustion noise is multivariable as the parameters controlled by injection strategy include MIAA, PIIT and PIQ. A method combining single variable optimization and multivariate optimization is designed to achieve the online optimization of combustion noise. The experiment process is to seek the optimal MIAA on combustion noise with fixing the other two parameters at original value at a specific speed firstly. Then, find the optimal PIIT and PIQ in the same way. And then, work out the optimal injection strategy of combustion noise by combining these three optimal injection parameters. At last, the strategy is verified through experimental measurements. The power performance of the engine and the consecutiveness of the injection strategy map should be considered in the process.
4.2 Optimization of combustion noise
The engine combustion noise is optimized at ten different speeds. The online optimization at 1000 r/min full load is taken as an example.
The original injection strategy at 1000 r/min full load is given in Table 2 and the engine noise is 83.2 dB(A). The variation rule of engine noise according to the injection parameter is obtained by changing one parameter while fixing the other two parameters. The results are shown in Fig. 17. The engine noise rises rapidly from �C8 to �C7�� CA when advancing the main injection timing (Fig. 17(a)). As the PIIT increases, the engine noise gradually goes up and has a slight fluctuation at around 1450 ��s (Fig. 17(b)), which indicates that the influence of PIIT on combustion noise begins to abate. It can be seen from Fig. 17(c) that the engine noise monotonically increases along with the enlargement of PIQ.
According to the results of the univariate optimization, the optimal MIAA, PIIT and PIQ are �C10�� CA, 1100 ��s and 1.04 mg, respectively. 1100 ��s,1150 ��s and 1200 ��s are chosen as variables of the PIIT. 1.04 mg, 1.12 mg and 1.52 mg are chosen as variables of the PIQ. The MIAA is fixed at �C10�� CA. Nine injection strategy groups are created by random combinations of the three injection parameters, as given in Table 3. The engine noise at each group is measured, as shown in Fig. 18. It is shown that the engine noise at group 1# and 2# are the lowest. The MIAA and PIIT can be determined as �C10�� CA and 1100 ��s, respectively. The PIQ is determined as 1.2 mg considering the consecutiveness of the injection strategy map. Eventually, the engine noise after optimization at 1000 r/min is 81.9 dB(A) and is reduced by 1.3 dB(A).
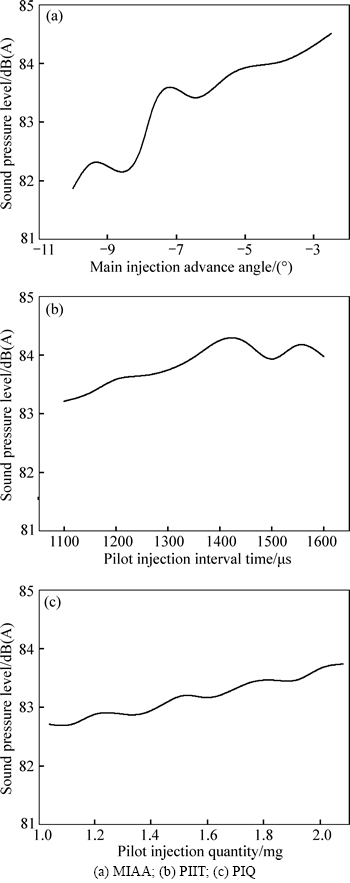
Fig. 17 Effect of injection parameter on engine noise at 1000 r/min:
Table 3 Multivariate combination of injection parameter
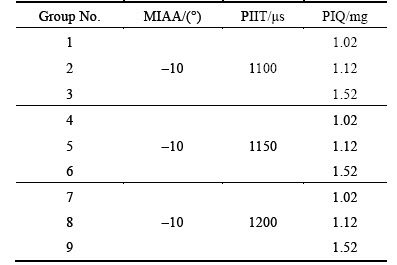
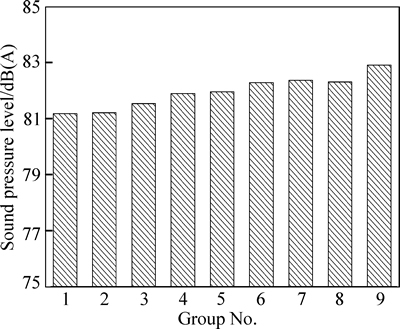
Fig. 18 Comparison of engine noise at different injection parameter group
As shown in Fig. 19(a), the engine noise energy mainly concentrates upon the frequency range of 1000�C 4000 Hz. After the combustion noise optimization, the sound pressure obviously decreases in 1000�C2000 Hz and 2500�C3500 Hz, especially around 1600 Hz. It can also be seen from Fig. 19(b) that the cylinder pressure level declines distinctly above 1500 Hz. And the pressure oscillation is also restrained effectively.
The combustion status before and after the optimization is shown in Fig. 20. After the combustion noise optimization, the cylinder pressure curve in combustion phase moves back. And the curve shape in the rapid burning period remains unchanged. But, the cylinder pressure in the slow combustion period increases slightly (Fig. 20(a)). The cylinder pressure curve becomes more gradual and the amplitude of the pressure oscillation declines observably (Fig. 20(b)). At the same time, the maximum pressure rise rate increases slightly while the first peak dramatically declines (Fig. 20(c)). The combustion in cylinder becomes gentler. As shown in Fig. 20(d), the heat release rate slightly rises in the slow combustion period but decreases obviously at the initial stage of burning. From the above, after optimization, the combustion status is effectively improved and the combustion noise is reduced.

Fig. 19 Comparison of noise and cylinder pressure before and after optimization:
The engine noise at other speeds is optimized by the method above. The results of noise are shown in Fig. 21(a). It can be seen that engine noise at each speed is significantly reduced. And the highest reduction value of the average sound pressure level of the engine is 2.5 dB(A) at 2400 r/min. The emission performance after the noise optimization is detected by the emissions testing equipment. The results are shown in Figs. 21(b) and (c). It can be seen that the emission performance is deteriorated at some speeds. The NOx emission increases at 1400�C3400 r/min and the soot emission rises at 1400�C2000 r/min. The engine with the original injection strategy meets the national IV standard. The deterioration of the emission performance after the noise optimization is not worth the candle. So, the second round of optimization should be considered to reduce the NOx and soot emissions.
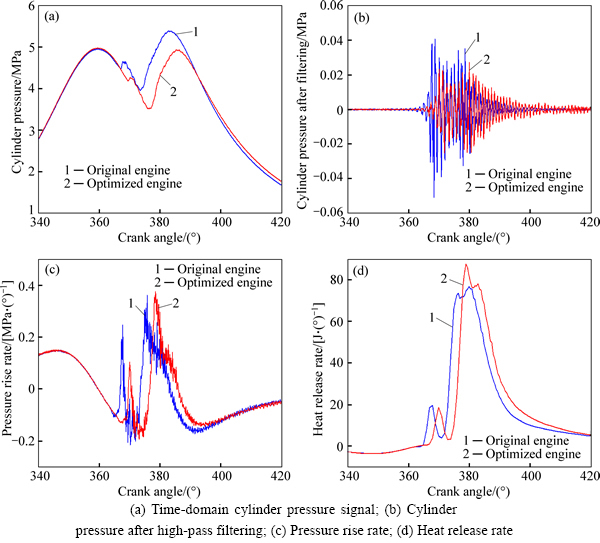
Fig. 20 Comparison of combustion process before and after optimization:
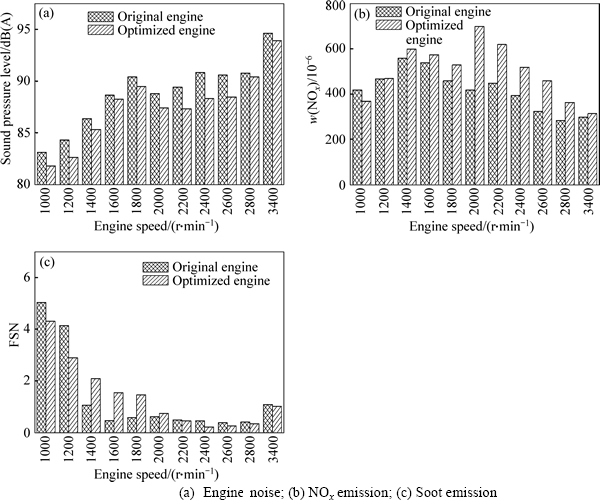
Fig. 21 Optimization results:
5 Optimization of NOx and soot emissions
The emissions testing equipment is added into the experiment, as shown in Fig. 1. This round of optimization is based on the noise optimization results. Nine groups of injection parameters are chosen after the noise optimization. The engine noise, NOx and soot emissions are measured and then the injection parameters are found at which noise and emissions are both suitable according to the results.
The emission optimization of 2200 r/min is taken as an example in this section. The injection parameters at 2200 r/min after the noise optimization are 3.5�� CA, 2538 ��s and 1.52 mg. As given in Table 4, nine groups of injection parameters are chosen. The engine performance at each group is shown in Fig. 22. It is shown that the main injection plays a greater influence on the engine noise and the NOx emission. The MIAA and PIIT have more important effect on soot emission. Considering the performance of the original engine, the parameters that need to be verified are �C2��C0�� CA, 2000 ��s and 2538 ��s, 2 mg and 2.3 mg. The verification results are given in Table 5. Compared with the status of the original engine, the test results of Group D are the most appropriate, at which the average sound pressure level of the engine is reduced by 1.5 dB(A), the NOx emission remains almost unchanged and the soot emission decreases. Finally, the injection parameters of Group D are determined as the optimized parameters.
Table 4 Injection parameters of each group

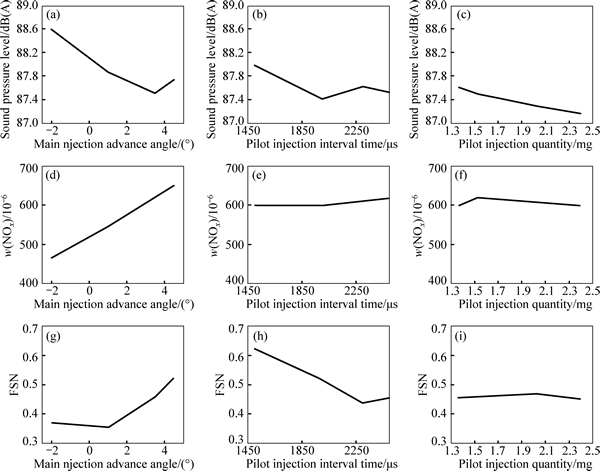
Fig. 22 Measurement results of engine performance of each group
Table 5 Verification of engine noise, NOx and soot emissions
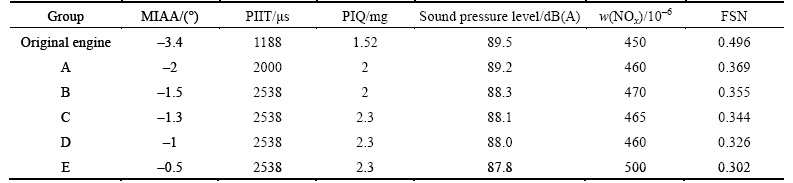
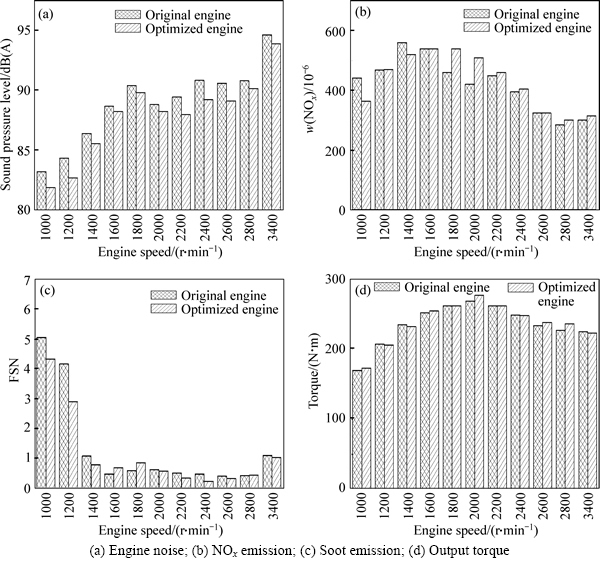
Fig. 23 Final optimization results:
The injection parameters at the speeds that need to be adjusted are optimized in this way at 2200 r/min. The results after optimization are shown in Fig. 23. The engine noise is still reduced obviously at each speed (Fig. 23(a)). The average sound pressure level of the engine is distinctly reduced by 1.0 dB(A) generally. And the highest reduction value of the average sound pressure level of the engine is 1.7 dB(A) at 1200 and 2400 r/min. The NOx emissions at 1800 and 2000 r/min and soot emissions at 1600 and 1800 r/min increase slightly (Figs. 23(b) and (c)). However, the emission performance has satisfied the national IV standard. The engine torque at each speed is almost unchanged (Fig. 23(d)). Besides, the total fuel injection quantity is not changed, so the fuel consumption is also invariant. The power and economy performance are ensured.
6 Conclusions
1) The improved attenuation curve method can be used to predict the engine noise accurately and study combustion noise of engines.
2) The pilot injection significantly affects the combustion process of DI diesel engines and plays an important role in ameliorating the noise and vibration of engines.
3) The injection parameters can affect the cylinder pressure rise rate and the heat release rate, and then affect the cylinder pressure load and the pressure oscillation to influence the combustion noise.
4) The main injection advance angle has the greatest influence on the combustion noise, while the pilot injection interval time takes the second place, and the pilot injection quantity is of the minimal impact.
5) The engine noise can be online optimized simply and effectively by the method combining the single variable optimization and the multivariate combination. After optimization, the engine noise at all speeds is distinctly reduced by 1.0 dB(A) generally. Meanwhile, the power, emission and economy performance are ensured.
References
[1] PAYRI F, TORREGROSA A J, BROATCH A, MONELLETTA L. Assessment of diesel combustion noise overall level in transient operation [J]. International Journal of Automotive Technology, 2009, 10(6): 761�C769.
[2] NGUYEN T A, MIKAMI M. Effect of hydrogen addition to intake air on combustion noise from a diesel engine [J]. International Journal of Hydrogen Energy, 2013, 38(10): 4153�C4162.
[3] LEE Jeongwoo, HONG Kookeui, CHOI Seungmok, YU Seongeun, CHOI Hoimyung, MIN Kyoungdoug. Comparison of the effects of multiple injection strategy on the emissions between moderate and heavy EGR rate conditions: Part 1�CPilot injections [J]. Journal of Mechanical Science and Technology, 2013, 27(4): 1135�C1141.
[4] TORREGROSA A J, BROATCH A, MARGOT X, MARANT V, BEAUGE Y. Combustion chamber resonances in direct injection automotive diesel engines: A numerical approach [J]. International Journal of Engine Research. 2004, 5(1): 83�C91.
[5] PISCHINGER F F, SCHMILLEN K P, LEIPOLD F W. A new mearuring method for the direct determination of diesel engine combustion noise [R]. SAE Paper 790267, 1979.
[6] ANDERTON D. Relation between combustion system and engine noise [R]. SAE Paper 790270, 1979.
[7] RUSSELL M F, HAWORTH R. Combustion noise from high speed direct injection diesel engines [R]. SAE Paper 850973, 1985.
[8] HE Z X, XUAN T M, JIANG Z C, YAN Y. Study on effect of fuel injection strategy on combustion noise and exhaust emission of diesel engine [J]. Thermal Science, 2012, 17(1): 81�C90.
[9] CAI Ji-ye, CAI Yi-xi. A new measure to judge diesel engine noise [J]. Small Internal Combustion Engine and Motorcycle, 2005, 34(1): 31�C34. (in Chinese)
[10] PISCHINGER F F. The naval method for measuring diesel combustion noise directly [J]. Noise and Oscillation Control, 1984, 4(5): 34�C38.
[11] SHU G Q, WEI H Q, WANG Y J, YANG Z Y, WEI J S. Secondary influence factors of combustion noise mechanism under transient conditions of DI-diesel engine [R]. SAE Paper, 2006-01-1530.
[12] YU Wen-ying, SHAN Bao-long, WANG Xia. Experimental study of separation and contribution of combustion& mechanical noise in a diesel engine [J]. Small Internal Combustion Engine and Motorcycle, 2011, 40(1): 90�C96.
[13] WANG Zhi-dong, SHEN Ying-gang, BI Feng-rong, WENG J Q, LI X N. An experimental study on diesel engine noise indentification between combustion noise and mechanical noise [J]. Internal Combustion Engines, 2007(6): 38�C41, 46. (in Chinese)
[14] AUSTEN A E W, PRIEDE T. Origins of diesel engine noise [R]. SAE paper, 1959: 590127.
[15] CHOI Hoimyung, LEE Jeongwoo, HONG Kookeui, LEE Sangyul, CHOI Seungmok, YU Seongeun, MIN Kyoungdoug. Comparison of the effects of multiple injection strategy on the emissions between moderate and heavy EGR rate conditions: Part 2�CPost injections [J]. Journal of Mechanical Science and Technology, 2013, 27(7): 2217�C2223.
[16] CARLUCCI P, FICARELLA A, LAFORGIA D. Study of the influence of the injection parameters on combustion noise in a common rail diesel engine using ANOVA and neural networks [R]. SAE Paper, 2001: 2001-01-2011.
[17] SELIM M Y E. Combustion noise measurements and control from small diesel and dual fuel engines [R]. SAE Paper, 2004: 2004-32-0072.
[18] WANG S, CHALU C, GAUTIER F. Optimization of combustion noise of modern diesel engines for passenger cars [R]. SAE Paper, 2007: 2007-01-2379.
[19] MENDEZ S, THIROUARD B. Using multiple injection strategies in diesel combustion: Potential to improve emissions, noise and fuel economy trade-off in low CR engines [R]. SAE Paper, 2008: 2008-01-1329.
[20] HWANG J Y, KIM D W, JEONG W J, SHIN D H, KANG K T. Optimization of the high frequency noise for the passenger car diesel engine [R]. SAE Paper. 2009: 2001�C2009.
[21] JUNG Insoo, JIN Jaemin, SO Hyunkee, NAM Choonggeun, WON Kwangmin. An advanced method for developing combustion noise through the analysis of diesel combustion [R]. SAE Paper, 2013: 2013-01-1901.
[22] KUMBHAR M S, BHAGATE R P, NADANASABAPATHY V, MOHAN K. Powertrain noise & sound quality refinement for new generation common rail engines [R]. SAE Paper, 2010: 2010-01-1414.
[23] NGUYEN T A, KAI Y, MIKAMI M. Study on combustion noise from a running diesel engine based on transient combustion noise generation model [J]. International Journal of Automotive Engineering, 2012, 3: 131�C140.
[24] KOMORI M, MIURA Y, MIKAMI M, KOJIMA N. Separation of combustion noise using transient noise generation model [R]. SAE Paper, 2002: 2002-32-1788.
[25] LIU Yue-hui, HAO Zhi-yong, BI Feng-rong, FU L H, HAN S T. Engine noise source identification with different methods [J]. Transactions of Tianjin University, 2002, 8(3): 174�C177.
[26] BRANDL F, VEIT J, ARNDT R, PRIEBSCH H H. The application of a new software tool for separating engine combustion and mechanical noise excitation [R]. SAE Paper, 2007: 2007-01-2376.
(Edited by YANG Bing)
Foundation item: Project(2011BAE22B05) supported by the National Science and Technology Pillar Program during the 12th Five-year Plan of China
Received date: 2014-12-22; Accepted date: 2015-04-20
Corresponding author: HAO Zhi-yong, Professor, PhD; Tel: +86�C571�C87953286; E-mail: haozy@zju.edu.cn
Abstract: Combustion noise takes large proportion in diesel engine noise and the studies of its influence factors play an important role in noise reduction. Engine noise and cylinder pressure measurement experiments were carried out. And the improved attenuation curves were obtained, by which the engine noise was predicted. The effect of fuel injection parameters in combustion noise was investigated during the combustion process. At last, the method combining single variable optimization and multivariate combination was introduced to online optimize the combustion noise. The results show that injection parameters can affect the cylinder pressure rise rate and heat release rate, and consequently affect the cylinder pressure load and pressure oscillation to influence the combustion noise. Among these parameters, main injection advance angle has the greatest influence on the combustion noise, while the pilot injection interval time takes the second place, and the pilot injection quantity is of minimal impact. After the optimal design of the combustion noise, the average sound pressure level of the engine is distinctly reduced by 1.0 dB(A) generally. Meanwhile, the power, emission and economy performances are ensured.
