- Abstract:
- 1 Introduction▲
- 2 Experimental▲
- 3 Results and discussion▲
- 4 Conclusions▲
- References
- Figure
- Fig.1 Relationship between viscosity and shear rate for suspensions of SiO2/silicon-oil at different SiO2 volume fractions
- Fig.2 Relationship between viscosity and volume fraction for suspensions of SiO2/silicon-oil at different shear rates
- Fig.3 Relationship between viscosity and volume fraction of silica at shear rate of 0.1 s-1
- Fig.4 Relationship between viscosity and shear rate of silica at volume fraction of 20%
- Fig.5 Relationship between viscosity and volume fraction after sifted
- Fig.6 Relationship between viscosity and shear rate of silica suspension after sifted
J. Cent. South Univ. Technol. (2008) 15(s1): 163-166
DOI: 10.1007/s11771-008-338-7
![]()
Viscosity model of high-viscosity dispersing system
WEI Xian-fu(魏先福)1, WANG Na(王 娜)1, HUANG Bei-qing(黄蓓青)1, SUN Cheng-bo(孙承博)2
(1. Laboratory of Printing and Packaging Material and Technology, Beijing Institute of Graphic and Communication,
Beijing 102600, China;
2. American T and A Instruments Corporation, Beijing 100025, China)
Abstract:
High-viscosity dispersing system is formed by dispersing the solid particles in the high-viscosity continuous medium. It is very easy to form the three-dimensional network structure for solid particles in the system and the rheology behavior becomes complicated. The apparent viscosity of this dispersing system always has the connection with the volume ratio and the shear rate. In order to discuss the rheology behavior and put up the viscosity model, the suspension of silicon dioxide and silicon oil were prepared. Through testing the viscosity, the solid concentration and the shear rate, the effects of the ratio and the shear rate on viscosity was analyzed, the model of the high-viscosity dispersing system was designed and the model with the printing ink were validated. The experiment results show that the model is applicable to the high-viscosity dispersing systems.
Key words:
dispersing system; network structure; viscosity; model; rheology;
1 Introduction
High-viscosity dispersing system is formed by dispersing the solid particles in the high-viscosity continuous medium. For the small size of particles in the system, the high active-energy on surface and the strong mutual applied force, the three-dimensional network structure are easily formed. Meantime, the complicated rheology behaviors are present. Major factors affecting the rheology behaviors are the viscosity of the dispersing particles, mutual attraction between particles and continuous medium, and the breakage of network structure and its recovery. All the factors affect the dispersion of the particles in the system. Most surveys on the rheology theory are limited in the viscosity of the dispersing system. Some typical models, such as Einstein viscosity formula[1], power law model and Casson experimental formula, can calculate yield values[2], Herschel-Bulkly model, Sisko model and so on[3]. All the models based on special assuming premise determines limitations in application.
In order to discuss the rheology behavior, the viscosity model is founded, and the suspension of silicon dioxide dispersed silicon-oil is prepared. Through measuring the viscosity, solid volume ratio and the shear rate, the effects of the ratio and the shear rate on viscosity are analyzed, the model in the high-viscosity dispersing system is designed and the model with the printing ink is validated. The experiment results prove that the model is applicable to the high-viscosity dispersing system.
2 Experimental
2.1 Preparation of samples
The suspension of SiO2/silicon-oil containing 20% SiO2 by volume is prepared by milling for 1 h using the three-roll milling machine. Diluting the system with the silicone oil, at last the testing samples can be obtained separately by SiO2 with volume fraction of 16%, 10%, 8%, 5% and 1%.
2.2 Determination apparatus and method
The size of the samples are determined by the laser particle sizer(3500, America). The results show that the average size is 15 μm and the distribution is about 5-30 μm. The viscosity of the samples is determined by the Rheometerics Ares. At the beginning, all the samples are exerted with the shear rate of 50 s-1 for 300 s. The testing shear rate is set from 0.1 s-1 to 100 s-1.
3 Results and discussion
3.1 Effects of shear rate on viscosity of SiO2/silicon-oil suspension
Fig.1 shows the relationship between viscosity and shear rate of samples at various volume ratio, the shear rate is set from 0.1-1 to 100-1. The results of Fig.1 reflect that the viscosity of the SiO2/silicon-oil suspensions decreases with the increase of shear rate. The reducement is fast in the low rate area, and the viscosity reaches balance when the viscosity reaches some fixed shear rates.

Fig.1 Relationship between viscosity and shear rate for suspensions of SiO2/silicon-oil at different SiO2 volume fractions
The test results also indicate the SiO2/silicon-oil suspensions can reflect the typical rheology behavior[4]. Because of the small size of the SiO2 particles, flocculated structure is formed but the structure can be broken down by the shear stress and the particles have the trend of going average distribution. So that the viscosity of the suspension is reduced. When the shearing stress is strong enough, the breakage and the recovery of the flocculated structure are dynamic balance and the viscosity is constant.
3.2 Effects of volume fraction of particles on viscosity of SiO2/silicon-oil suspension
Fig.2 shows the relationship between viscosity and volume fraction of SiO2 at different shear rates. With the volume fraction going up, the viscosity of the suspension increases in the exponential function. The viscosity

Fig.2 Relationship between viscosity and volume fraction for suspensions of SiO2/silicon-oil at different shear rates
increases fastly in the low rate area, and the increment stays little fast as the increment of volume fraction. For the small size of SiO2 particles, the high active-energy on surface and the strong mutual applied force, the flocculated structure forms and the viscosity of the system increase. When the volume fraction is fixed in some degree, the three-dimensional netlike cohesion structure can be fully filled with the particles. The volume fraction increase notably, which is called critical rate[5].
3.3 Foundation of model
From Figs.1 and 2, the viscosity of the SiO2/silicon- oil suspensions decreases with the increase of the shear rate when the volume fraction increases in the exponential function. So the experiment uses exponential function to simulate the two curves.
3.3.1 Relationship between viscosity and volume fraction
If the viscosity is set as y, volume fraction is set as x, the relationship can be expressed by the formula according to the increasing performance of the viscosity with the increase of volume fraction.
![]() (1)
(1)
Making logarithms on both sides of Eqn.(1), we obtain
![]() (2)
(2)
Supposed u=lny, v=x, A1=lna1, Eqn.(2) can be written to Eqn.(3).
![]() (3)
(3)
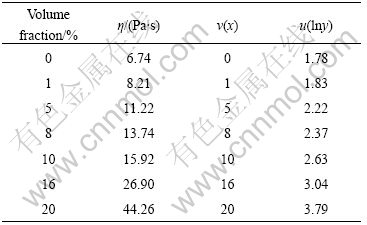
Table 1 shows the viscosity determined at shear rate of 0.1 s-1, and the numerical value makes logarithms through regression calculating.
![]() ,
, ![]() ,
, ![]() ,
, ![]() ,
, ![]() ,
, ![]() ,
, ![]() .
.
According to formula:
Table 1 Viscosity with different volume fraction at shear rate of 0.1 s-1

![]()
and
![]()
calculating parameter ![]() ,
, ![]() , the formulation between viscosity and volume ratio is
, the formulation between viscosity and volume ratio is
![]() (4)
(4)
3.3.2 Relationship between viscosity and shear rate
According to the decreasing performance of the viscosity with the increase of volume fraction, if the viscosity is set as y, while volume fraction is set as x, the relation can be expressed by the formula:
![]() (5)
(5)
Table 2 shows the viscosity after taking logarithms of the sample with volume fraction of 20% determined at different shear rates. Using the same method as 3.3.1, calculating parameter ![]() ,
, ![]() , the formulation between viscosity and shear rate is
, the formulation between viscosity and shear rate is
![]() (6)
(6)
Compared formula (4) and (6) with the real formula, the constant a is 2.5. The formula of viscosity and volume fraction, shear rate is
![]() (7)
(7)
where y is the viscosity; x1 is the volume fraction; x2 is the shear rate.
Table 2 Viscosity with different shear rate at volume fraction of 20%

3.4 Imitation of real values with model
The relationship between viscosity (factual value and theoretic value) is shown in Fig.3, and the volume fraction is calculated according to Eqn.(6). The relationship between viscosity (factual value and theoretic value) is shown in Fig.4 and the shear rate calculated according to Eqn.(6). Compared with Figs.3 and 4, the results show the experimental values are bigger than the theoretic values of viscosity and volume fraction. The experimental values are smaller than the theoretic values of viscosity and the shear rate. But the shapes of tow curves are the same and they can achieve great coincidence through moving the coordinate axis vertically. Assuming the moving factor is f, Eqn.(7) can be rewritten as
![]() (8)
(8)
The results after moving is shown in the Figs.5 and 6. After moving coordinate axis vertically, the experimental values and theoretic values coincide very well.

Fig.3 Relationship between viscosity and volume fraction of silica at shear rate of 0.1 s-1

Fig.4 Relationship between viscosity and shear rate of silica at volume fraction of 20%

Fig.5 Relationship between viscosity and volume fraction after sifted

Fig.6 Relationship between viscosity and shear rate of silica suspension after sifted
3.5 Moving factor f
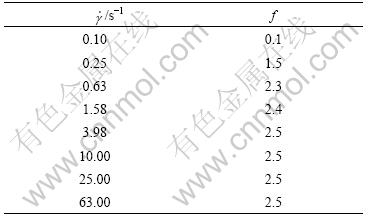
Through moving the coordinate axis vertically, the experimental value and theoretic value coincide very well. The moving factor f is connected with the factors affecting the forming of the flocculated structure, such as the volume fraction, the shear rate and temperature, and so on. All the factors of the above mentioned can lead the change of the flocculated structure. So the moving factor f is function of volume fraction, shear rate and temperature. Through experiment, the moving factor of SiO2/silicon-oil suspensions can be obtained and is listed in Tables 3 and 4. f in Table 3 is obtained from the relationship between the viscosity and the volume fraction at different testing shear rates. f in Table 4 is obtained from the relationship between the viscosity and the shear rate at different volume fractions. There are both inflection points and sites of the inflection points coincide.
Table 3 Value of f at different testing shear rates

Table 4 Value of f at different volume fractions

4 Conclusions
The relationship between viscosity and volume fraction, the shear rate of the SiO2/silicon-oil suspensions is ![]()
![]() , y is the viscosity;
, y is the viscosity;
x1 is the volume fraction; x2 is the shear rate; f is the moving factor. Moving factor f is a variable value concerned with the volume fraction, the shear rate and the temperature. At the fixed temperature, f increases with the increase of the shear rate while the volume fraction is fixed. At the fixed temperature, f begins to decline when the volume fraction reaches at some certain values. The inflection point obtained from the formula is consistent with that gained from the curves of the viscosity vs the volume fraction.
References
[1] The Society of Rheology Japan. Seminar rheology[M]. Kyoto: Polymer Press, 1992: 149. (in Japanes)
[2] HIRAI E. Rheology for chemical engineer[M]. Tokyo: Science & Technology Press, 1977: 45. (in Japanes)
[3] JIANG Ti-qian. Rheology of chemical engineering[M]. Shanghai: East China University of Science and Technology Press, 2004. (in Chinese)
[4] OTSUBO Y, WATANABE K. Rheological behavior of silica suspensions flocculated by bridging[J]. Journal of Non-Newtonian Fluid Mechanics, 1987, 24: 265-278.
[5] OTSUBO Y, WATANABE K. Application of percolation theory to the rheology of silica suspensions flocculated by bridging[J]. Journal of Colloid and Interface Science, 1989, 127(1): 214-221.
Received date: 2008-06-25; Accepted date: 2008-08-05
Corresponding author: WEI Xian-fu, PhD; Tel: +86-10-60261094; E-mail: Weixianfu@bigc.edu.cn
- Viscosity model of high-viscosity dispersing system


