

J. Cent. South Univ. (2019) 26: 640-653
DOI: https://doi.org/10.1007/s11771-019-4035-5

Teaching evaluation on a WebGIS course based on dynamic self-adaptive teaching–learning-based optimization
HOU Jing-wei(侯景伟)1, 2, JIA Ke-li(贾科利)1, 2, JIAO Xue-jun(焦学军)3
1. School of Resources and Environment, Ningxia University, Yinchuan 750021, China;
2. Ningxia (China-Arab) Key Laboratory of Resource Assessment and Environment Regulation in Arid Region, Yinchuan 750021, China;
3. Institute of Surveying Mapping and Geographic Information of Henan, Zhengzhou 450006, China
 Central South University Press and Springer-Verlag GmbH Germany, part of Springer Nature 2019
Abstract:
Teaching evaluation on a WebGIS course is a multi-objective nonlinear high-dimensional NP-hard problem. The index system for the teaching evaluation of a WebGIS course, including teacher- and student-oriented sub-systems, is first established and used for questionnaires from 2013 to 2017. The multi-objective nonlinear high-dimensional evaluation model is constructed and then solved via dynamic self-adaptive teaching–learning-based optimization (DSATLBO). DSATLBO is based on teaching–learning-based optimization with five improvements: dynamic nonlinear self-adaptive teaching factor, extracurricular tutorship factor, dynamic self-adaptive learning factor, multi-way learning factor, and non-dominated sorting factor. WebGIS teaching performance is fully evaluated based on questionnaires and DSATLBO. Optimal weights and weighted scores from DSATLBO are compared with those from the non-dominated sorting genetic algorithm-II using the Pareto front, coverage to two sets, and spacing of the non-dominated solution sets to validate the performance of DSATLBO. The results show that DSATLBO can be uniformly distributed along the Pareto front. Therefore, DSATLBO can efficiently and feasibly solve the multi-objective nonlinear high-dimensional teaching evaluation model of a WebGIS course. The proposed teaching evaluation method can help reflecting the quality of all aspects of classroom teaching and guide the professional development of students.
Key words:
teaching evaluation; multi-objective; WebGIS; DSATLBO; optimization;
Cite this article as:
HOU Jing-wei, JIA Ke-li, JIAO Xue-jun. Teaching evaluation on a WebGIS course based on dynamic self-adaptive teaching–learning-based optimization [J]. Journal of Central South University, 2019, 26(3): 640–653.
DOI:https://dx.doi.org/https://doi.org/10.1007/s11771-019-4035-51 Introduction
WebGIS is a popular computer system that combines geographic information system (GIS) and WWW technologies for browsing, collecting, transmitting, storing, retrieving, analyzing, visualizing, and applying geospatial information under the Internet or intranet environment. The teaching content of WebGIS courses in colleges and universities involves numerous theories and techniques, such as TCP/IP, XML, HTML, GML, Ajax, client/server structure, distributed system, and web mapping services. A WebGIS course is intended for students to understand and master the theories and techniques of WebGIS. In general, this course is uninteresting for third-year students majoring in geographic information science. Therefore, evaluating the teaching quality of WebGIS courses plays a crucial role in monitoring the teaching process, improving pedagogical skills, and achieving self-understanding and self-correction.
To the best of our knowledge, most related studies have focused on single-objective teaching evaluation models with different topics to handle ordinal data obtained statistically from questionnaires. These models include the fuzzy comprehensive evaluation model [1], item response theory [2, 3], and gray hierarchy evaluation model [4]. They do not adequately consider a scientific and comprehensive evaluation index system for different evaluation objects. A multi-objective function is generally transformed into a single-objective function by assigning empirical weights to various objective functions to obtain a single optimal solution, instead of Pareto optimal solutions [5–7]. Consequently, a multi-objective evaluation model should be constructed to provide teacher- and student-oriented evaluation objects with an accurate and scientific performance evaluation [8].
Teaching evaluation models generally involve multifactorial weight vectors, and the optimal solution relies primarily on the assigned weights. However, weights are difficult to accurately estimate because a decision maker cannot easily confirm the order of importance of various objectives in advance. To address this issue, numerous methods have been studied. These methods include the analytic hierarchy process (AHP) [9–11], fuzzy AHP [12], type-2 fuzzy sets [13, 14], rough and fuzzy set-based classification algorithm [15], self-organizing feature map algorithm [16], backpropagation neural network [17, 18], support vector machine [19], and meta-analysis [20].
The aforementioned methods can effectively handle a low-dimensional weight vector for teaching evaluation. However, they may be ineffective, imprecise, and time-consuming for solving a high-dimensional multifactorial weight vector. The teacher and students may inevitably select different solutions from multiple trade-off solutions based on the order of importance of objectives or different requirements of WebGIS teaching evaluation. Accordingly, a better optimization algorithm for solving the multi- objective high-dimensional teaching evaluation problem should be developed.
Teaching–learning-based optimization (TLBO) [21] is a nature-inspired population-based parameter-less metaheuristic swarm intelligence algorithm [22]. Students acquire and upgrade their knowledge and skills from the lecture of the most educated teacher and from mutual communication and daily interaction among students [23]. TLBO takes advantage of the individual best, the global best, and mean population information to develop new solutions [24]. Hence, TLBO is a promising algorithm for optimizing the weight parameters of a teaching evaluation model. However, with regard to the multi-objective high-dimensional optimization issue, adopting TLBO may result in falling into the local optimum or premature convergence, lowering of solution accuracy and global search capability, and decrease of the convergence rate and population diversity. Thus, TLBO should be improved.
In this study, a comprehensive evaluation index system, including 9 teacher-oriented criterion layers, 5 student-oriented criterion layers, and 50 high-dimensional index layers, is designed and then used for questionnaires from 2013 to 2017. A multi-objective teaching evaluation model for a WebGIS course, including teacher- and student- oriented sub-models with 64 high-dimensional weight parameters, is constructed. A dynamic self-adaptive TLBO algorithm (DSATLBO) is then proposed based on the basic TLBO to effectively enhance its global convergence capability. The improved strategies of DSATLBO include dynamic nonlinear self-adaptive teaching factor, extracurricular tutorship factor, dynamic self- adaptive learning factor, multi-way learning factor, and non-dominated sorting factor. Two performance criteria, namely, coverage to two sets and spacing, are then adopted to validate the performance of DSATLBO. The results show that the multi-objective teaching evaluation of a WebGIS course is comprehensive, effective, reliable, impartial, and acceptable for students, instructors, and administrators.
2 Materials and methods
2.1 Design and disposal of teaching evaluation indices
On the basis of scientific, systematic, comprehensive, practical, and innovative principles, the teaching evaluation index system of a WebGIS course is first designed as a preliminary questionnaire. The questionnaire is pilot tested among 10 third-year students majoring in geographic information system at the School of Resource and Environment in Ningxia University, China, at the end of a WebGIS course in 2013 to validate clarity and correlation among the indices.
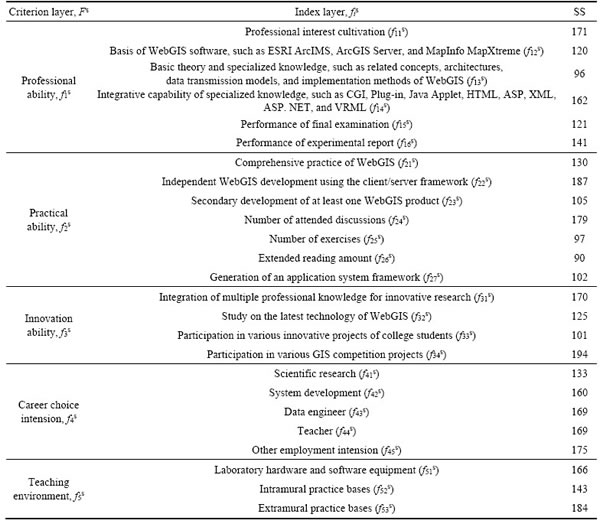
Second, teacher- and student-oriented criterion layers and their index layers are selected as the final evaluation index system of WebGIS teaching (Tables 1 and 2) according to the feedback results of the initially designed questionnaire and the validity of the Cronbach’s alpha coefficient and the intraclass correlation coefficient. For an evaluated object, O={performance evaluation of WebGIS teaching} = {F t, F s}={teacher-oriented criterion layers, student-oriented criterion layers}. F t={f1t, f2t, f3t, …, f9t}={teaching objectives, teaching strategies, teaching content, classroom control, class freedom, teaching atmosphere, problem inquiry, target attainment, innovation level}. F s={f1s, f2s, f3s, f4s, f5s}={professional ability, practical ability, innovation ability, career choice intension, teaching environment}. Each criterion layer is divided into two or more index layers, namely, fi t = {fi1t, fi2t, …, fijt}, i=(1, 2, …, 9) and fi s={fi1s, fi2s, …, fijs}, i=(1, 2, 3, 4, 5). For example, the set of teaching objectives f1t={f11t, f12t, f13t}.
Table 1 Teacher-oriented evaluation index system of WebGIS teaching and its statistical score (SS)
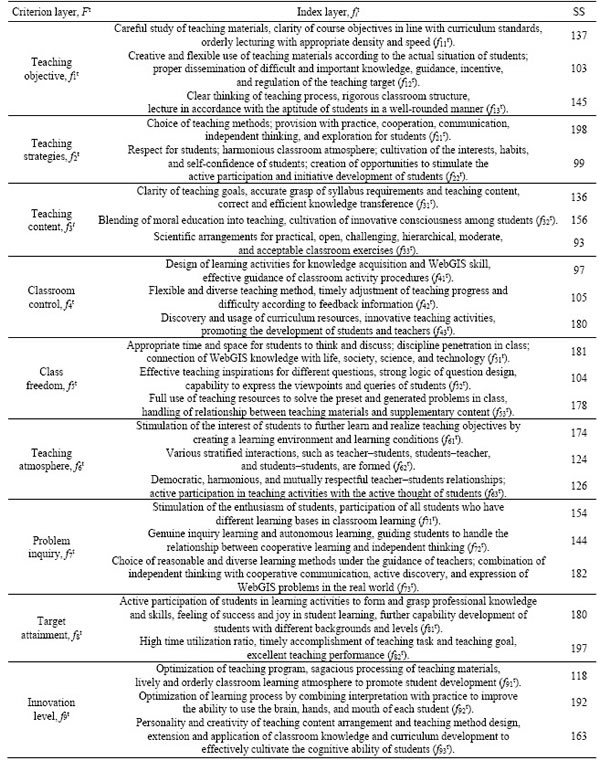
Table 2 Student-oriented evaluation index system of WebGIS teaching and its SS
Third, the questionnaires are distributed and then filled in anonymously by junior students, didactical experts, and peer teachers at the closing session of WebGIS courses from 2013 to 2017. A total of 189 individual questionnaires are collected. Among which, 182 complete questionnaires are selected.
Fourth, the original data from the questionnaires are dealt with through the following approach. The highest 5% and lowest 5% of abnormal data around the standard deviation of the scores are removed from the trusted zone to reduce bias from various evaluation entities. The remaining 90% of the data, i.e., 165 credible questionnaires, are considered valid data for evaluating the performance of WebGIS teaching.
Fifth, the survey results are statistically obtained. The set of each teacher- or student- oriented evaluation grades is denoted as E={e1, e2, e3, e4, e5}={excellent or strongly agree, good or agree, neutral, poor or disagree, poorest or strongly disagree}. The grade of each element in Set E is evaluated based on the coincidence rate, which is defined as the percentage of the number of completed goals that accounts for the total number of specified goals in a given index layer, i.e., {100%, 67%, 50%, 33%, 0}. The amount of different grades for each element in Set E is then statistically obtained. For example, when f11t is considered, 44 of the 165 survey results are selected as excellent, 65 as good, 40 as neutral, 16 as poor, and 0 as poorest. Similarly, the percentages of f12t for the excellent, good, neutral, poor, and poorest grades account for 20.0%, 45.9%, 26.7%, 5.2%, and 2.2%, respectively.
Finally, the total score of each index layer fijt or fijs is calculated. Let the score of E={e1′, e2′, e3′, e4′, e5′}={2, 1, 0, -1, -2}. Then, the total score s11t, for example, of f11t is 137. Similarly, the total score s12t of f12t is 103. Thus, the scores of all 50 index layers are calculated, as shown in Tables 1 and 2. They are the input variables sijt and sijs of the multi-objective teaching evaluation model described in Section 2.2.
2.2 Construction of multi-objective teaching evaluation model
In this study, a multi-objective WebGIS teaching evaluation model, including teacher- and student-oriented evaluation sub-models, is constructed.
Suppose that the set of weights for the teacher- oriented criterion layers is W={w1, w2, …, wi, …, wI}, i [1, I]. The set of weights for the teacher-oriented index layers is Wi={wi1, wi2, …, wij …, wIJ}, i[1, I], j[1, J]. Assume that the sets of total scores for the teacher-oriented criterion layers and index layers are S t={s1t, s2t, …, sit, …, sIt}, i[1, I] and Sit={si1t, si2t, …, sijt, …, sIJt}, i[1, I], j[1, J], respectively. Therefore, a teacher- oriented evaluation sub-model is established as follows:
 (1)
(1)
Similarly, suppose that the sets of the total scores for the student-oriented criterion layers and index layers are S s={s1s, s2s, …, sis, …, sIs}, i[1, I] and Sis={si1s, si2s, …, sijs, …, sIJs}, i[1, I], j[1, J], respectively. Therefore, a student-oriented evaluation sub-model is established as follows:
 (2)
(2)
The constraint conditions are as follows:

 …,
…, wi, wij(0, 1).
The values of Eqs. (1) and (2) are related to weights wi and wij because the other variables, sijt and sijs, can be easily obtained from Section 2.1. The optimization of the multi-objective evaluation model is intended to maximize the values of Eqs. (1) and (2) by finding the optimal weights of wi and wij. However, the model to be optimized has 64 weight variables (9 for teacher-oriented criterion layers, 5 for student-oriented criterion layers, 25 for teacher-oriented index layers, and 25 for student- oriented index layers). Therefore, this model is a multi-objective nonlinear high-dimensional NP- hard optimization problem.
2.3 Improvement of TLBO
To solve the high-dimensional nonlinear multi- objective teaching evaluation model, DSATLBO is designed based on TLBO.
2.3.1 Description of TLBO
TLBO simulates the teaching and learning phases, which learners need to sequentially undergo in a classroom. The teaching phase involves the upgrading and updating of the current mean knowledge and skills of students under the guidance of the teacher with the best-so-far fitness value to ensure that all learners are encouraged to approximate the current best solution. In the learning phase, a student randomly discusses and interacts with other students (peer learning) to improve his/her knowledge and skills.
In the teaching phase, students are randomly initialized as n members of a class in a solution space to ensure the diversity of individuals in the decision space. This condition can be expressed as
 (3)
(3)
where v[1, n] is an independent variable in the ith candidate solution xi, i[1, N]; n and N are the number of independent variables and the population, respectively. Rand (0, 1) is a function for randomly generating a uniformly distributed number between 0 and 1; ximax(v) and ximin(v) are the maximum and minimum values of xi(v) , respectively, in a solution space.
The independent variable v[1, n] in the ith candidate solution xi (i[1, N]) is then updated as follows:
 (4)
(4)
 (5)
(5)
where r[0, 1] is a learning step size that is equivalent to a random perturbation; xt is the best individual (teacher) in the population; Tf{1, 2} is a teaching factor that is heuristically set with an equal probability. Round () is a function for taking the nearest integer.
The learning phase aims to maintain population diversity through stochastical interactive learning among students. The ith learner xi approaches the selected learner xj and updates his/her knowledge and skills if the jth learner xj(j≠i) has more knowledge than him/her to enhance the quality of a solution. The learning process can be formulated as follows:
 (6)
(6)
2.3.2 Design of DSATLBO
In the teaching phase, a dynamic nonlinear self-adaptive teaching factor is first designed to adjust the contribution of students’ own knowledge to a learning process. An extracurricular tutorship factor is then introduced to improve the convergence rate of the algorithm. In the learning phase, a dynamic self-adaptive learning factor is designed to maintain population diversity and avoid the prematurity of the algorithm. The multi-way learning factor is then introduced to enhance the convergence capability of the algorithm. Finally, a non-dominated sorting strategy is adopted to obtain a multi-objective Pareto front.
1) Dynamic nonlinear self-adaptive teaching factor Tf
Teaching factor (Tf) in TLBO determines the average performance of all students. The value of Tf [1, 2] obtained from Eq. (5) reflects two extreme cases: students learn nothing or gain all the knowledge from the teacher. Students can learn any proportion of knowledge from the teacher, that is, the value of Tf is between “nothing” and “all the knowledge”. During the early stage of teaching, the gap of knowledge between students and teacher is large because students are unfamiliar with what they need to learn. Soon, however, students efficiently and quickly learn a large amount of knowledge from the teacher, and thus, the gap of knowledge between students and teacher becomes increasingly narrow. During the late stage of teaching, the amount of knowledge that students learn from the teacher decreases continuously, such that their learning efficiency declines sharply. The teacher should selectively instruct students according to their different aptitudes and learning abilities. Thus, Tf should be dynamic and self- adaptive.
 (7)
(7)
where Tfmax and Tfmin denote the maximum and minimum values of Tf, respectively; tmax and ti represent the maximum and current iterations, respectively; f, fmin, and favg are the current, minimum, and average values of the objective function, respectively.
In accordance with Eq. (7), a small value of Tf indicates strong exploration capability but weak learning and search capabilities, which can enhance the local exploration capability of the algorithm to close that of the optimal solution. By contrast, a large value of Tf indicates weak exploration capability but strong learning and search capabilities, which can enhance the global exploration capability to accelerate convergence.
2) Extracurricular tutorship factor
The teacher improves the achievement of students only through the average achievement of the teacher and the entire class in TLBO. The differences among the students must be considered. The teacher should tutor students with poor grades outside the classroom to enable them to quickly absorb knowledge and move closer to xt(v), thereby improving the convergence speed of the algorithm. Therefore, an extracurricular tutorship factor is introduced into the teaching stage, and the improved teaching process is expressed as follows:

 (8)
(8)
where r1, r2[0, 1] are the sizes of the learning steps that are equivalent to a random perturbation. r2[xt(v) – xi(v)] is an extracurricular tutorship factor.
3) Dynamic self-adaptive learning factor
Analogous to the teaching factor, students gain nearly all their knowledge of a course at the beginning of the actual learning process through the lecture of the teacher. This condition enables students to quickly improve their own state and the average achievement of the entire class, thereby ensuring that the gap between the teacher and students gradually narrows. With the development of the learning process, the evolution of their states will be influenced more by their own knowledge and less by that of the teacher. The dynamic change in the learning process can be reflected by a dynamic self-adaptive learning factor δi[δmin, δmax], which is related to the iterations as follows:
 (9)
(9)
Thus, Eq. (6) can be modified as follows:
 (10)
(10)
From Eqs. (9) and (10), a small δi in the initial iterations ensures that individual students can rapidly approach the search space of the teacher. A large δi in later iterations can maintain population diversity and avoid the prematurity of the algorithm.
4) Multi-way learning factor
Students can efficiently improve their knowledge in different ways, including learning from each other and from the opinion and guidance of the teacher. Therefore, a multi-way learning factor Gf is designed to enhance convergence, global search, and population diversity.
 (11)
(11)
Therefore, Eq. (11) can be added to the end of Eq. (10) as follows:
 (12)
(12)
5) Non-dominated sorting strategy
A non-dominated solution sorting strategy [25] is incorporated into the DSATLBO algorithm to efficiently and effectively deal with multiple objectives and obtain an optimal Pareto front.
The n initial solutions generated from Eq. (3) are sorted from best to worst and ranked according to the following rule: the ith solution xi dominates the jth solution xj if and only if the ith solution xi is not worse than the jth solution xj for all the objective functions, and the ith solution xi is strictly better than the jth solution xj for at least one objective function. A student with a higher rank is considered superior to another student, and the teacher has the highest rank. When the achievements of all the students are updated according to Eq. (8) in the teaching phase, they are then sorted and ranked again.
A constrained dominance approach [26, 27] is also introduced to efficiently deal with constraints [28, 29]. If the summation of the solutions (weights) of all the index layers within each criterion layer is equal to 1, then the ith solution xi is evaluated in terms of whether it dominates the jth solution xj according to one of the following conditions. 1) The ith solution xi and the jth solution xj are feasible, but the ith solution xi dominates the jth solution xj; 2) The ith solution xi is feasible, whereas the jth solution xj is not; 3) The ith solution xi and the jth solution xj are infeasible; however, the constraint violation of the ith solution xi is less than that of the jth solution xj; 4) If the ith solution xi still fails to meet the aforementioned conditions, then a predetermined boundary is selected to replace the violated individual.
2.3.3 Realization process of DSATLBO
The DSATLBO algorithm is explicitly described as follows:
Step 1 Various parameters, such as population size, tmax, ti and xi(v), are initialized.
Step 2 The best individual (learner) is selected as xt. The fitness value of each individual in the population is calculated.
Step 3 The improved Tf is calculated according to Eq. (7).
Step 4 The achievement xi(v) of each student xi is calculated using Eq. (8).
Step 5 The fitness values of each student are arranged in ascending order using non-dominated sorting and constraint dominance approaches. If xi′(v) is better than xi(v), then xi(v) is replaced with xi′(v). Otherwise, xi(v) is retained. The best solution is selected based on the non-dominated rank.
Step 6 The variable δi is calculated according to Eq. (9).
Step 7 The variable xi(v) is updated using Eqs. (11) and (12). The non-dominated sorting strategy is reimplemented. If xi′(v) is better than xi(v), then xi(v) should be replaced with xi′(v). Otherwise, xi(v) must be retained.
Step 8 The teaching and learning phases are executed and repeated for each individual in the class.
Step 9 If ti<>max, then return to Step 3. Otherwise, the current optimal Pareto solutions are outputted.
2.4 Performance verification of DSATLBO
Two performance criteria, namely, coverage to two sets and spacing, are adopted to evaluate the performance of DSATLBO.
1) Coverage to two sets
Coverage to two sets C(X, Y) denotes the percentage of non-dominated solutions of one set, called X dominated, by that of another set, referred to as Y [30, 31] as follows:
 (13)
(13)
where X and Y are two sets with non-dominated solutions for comparison. x =y, (xX, yY) implies that the non-dominated solution x in Set X is dominated by or equal to the non-dominated solution y in Set Y. None of the non-dominated solutions in Set Y is covered by the solutions in Set X if C(X, Y)=0. By contrast, all solutions in Set Y are dominated by or equal to all solutions in Set X if C(X, Y)=1. The solutions in Set X completely dominate the solutions in Set Y if C(X, Y)=1 and C(Y, X)=0.
2) Spacing
Spacing S is used to measure the uniform distribution of non-dominated solutions along the Pareto front approximation [32, 33], as follows:

 (14)
(14)
where n denotes the number of non-dominated solutions; m is the number of objective functions; fik and fjk are the ith and jth solutions of the kth objective function, respectively, i, j[1, n] and k[1, m]. If S=0, then all non-dominated solutions are uniformly distributed, which presents the best possible performance [34, 35].
3 Results
3.1 WebGIS teaching evaluation based on questionnaires
The statistical scores of the teaching performance of WebGIS courses is calculated according to the questionnaires distributed from 2013 to 2017, as shown in Tables 1 and 2. Each teacher- and student-oriented criterion layer and its index layers are analyzed in the succeeding sections.
3.1.1 Analysis of teacher-oriented evaluation
As indicated in Table 1, the highest score of the three index layers in the teaching objectives is 145 for clear thinking of the teaching process, a rigorous classroom structure, and giving lectures in accordance with the aptitude and differences of students. By contrast, the lowest score is 103 for the use of teaching materials, and the dissemination of difficult and important knowledge, guidance, incentive, and regulation of the teaching target. The lowest score indicates that in the future classroom teaching of WebGIS, teaching materials should be appropriately adapted, adjusted, and expanded for a creative, realistic, humane, and flexible teaching situation. Difficult and important knowledge should be effectively solved using different teaching methods, such as systematic arrangement, case- based heuristic, classroom discussion, situation creation, comparative analysis, and extracurricular activities, according to the different contents of teaching materials and learning levels of students. Learning targets should be set at different levels, implemented in various forms, changed at appropriate times, and consolidated on the key points of knowledge.
In the teaching strategies, students are satisfied with teaching methods, practice, cooperation, communication, independent thinking, and exploration, which have the highest score of 198. However, they are dissatisfied with harmonious classroom atmosphere, self-confidence, active participation, and initiative development, which have a score of only 99. The teaching strategies with the lowest score should be strengthened and improved in future teaching processes. With regard to teaching content, the highest score is 156 for the cultivation of moral education, consciousness, and innovation. Most students believe that classroom exercises for WebGIS courses should be arranged in a more practical, open, challenging, hierarchical, and acceptable manner.
With regard to classroom control, students are highly satisfied with curriculum resources and innovative teaching activities but are dissatisfied with the design and guidance of learning activities. Therefore, the teacher should control the time and space of classroom activities, combine individual with group activities, and deal with the relationship between in-class and out-of-class resources. With regard to class freedom, most students believe that the teacher has provided them with sufficient time and space to think about and discuss WebGIS problems and extend them to other disciplines, life, society, and new technologies in classroom teaching. However, the teacher should design more logical questions, and inspire students to think about questions more effectively and to express their viewpoints and queries more adequately.
With regard to teaching atmosphere, the teacher has efficiently stimulated the interest of students to achieve the teaching objectives by creating a learning environment and conditions for a WebGIS classroom. However, the teacher should deal with interactions and relationships between teacher–students, students–teacher, and students– students in a hierarchical, democratic, and harmonious manner.
With regard to problem inquiry, the teacher can effectively guide students to choose reasonable and diverse learning methods to solve WebGIS problems. Students can actively think, discover, and express inquiries encountered in the WebGIS learning stage. However, they cannot effectively master the methods, such as inquiry learning, autonomous learning, and cooperative learning. Thus, the teacher should pay attention to these methods in the WebGIS teaching process.
The scores of the two index layers of “target implementation” are both high, which shows that the teacher can accomplish the teaching task and goal on time, and thus, ensure that students feel the success and joy of learning because they can grasp most professional knowledge and skills. With regard to innovation level, the last criterion layer of the teacher-oriented WebGIS evaluation, the teacher can optimize the learning process by combining interpretation with practice to improve the ability to use the brain, hands, and mouth of each student. Meanwhile, students hope to optimize the teaching program, teaching material, and classroom learning atmosphere to promote their personal development.
3.1.2 Analysis of student-oriented evaluation
As indicated in Table 2, the highest score in the six index layers of professional ability is 171 for professional interest cultivation. This score shows that the teacher can automatically mobilize all the senses and strong desire of the students to actively participate in the teaching and learning process by creating a teaching situation, designing flexible practices, encouraging enquiries, and avoiding direct negative evaluations. The higher score for f14s is 162, which indicates that students have nearly grasped specialized knowledge and skills, such as CGI, Plug-in, Java Applet, HTML, ASP, XML, ASP.NET, and VRML. The lowest score is 96 for f13s because many students have a learning tendency to pay more attention to experimental practice and less attention to abstract, boring, and invisible theoretical learning, such as the architectures and data transmission models of WebGIS.
The scores of the majority of the index layers for practical ability are high, which shows that the teacher has cultivated the professional ability and practical ability for WebGIS of students to a certain extent. The abilities with the highest scores are “independent WebGIS development using client/ server construction technology” and “number of attended discussions.” By contrast, the abilities “extended reading amount” and “number of exercises” have the worst teaching effects with the lowest scores of 90 and 97, respectively. These scores indicate that most students are unwilling to spend their spare time reading and exercising more materials on WebGIS. Therefore, the teacher should raise extracurricular reading habit and reading interest; optimize the content, platform, and evaluation of extracurricular reading; and select significant, novel, and typical exercises for students to enhance their thirst for knowledge.
With regard to innovation ability, students prefer to participate in various competition projects and innovative research based on multiple professional knowledge rather than innovative projects for college students and the latest WebGIS technology. Therefore, in future WebGIS teaching process, the teacher should conduct more academic innovation activities and encourage students to participate in innovative practice and research projects to cultivate their innovative consciousness and cognitive ability.
College students majoring in GIS have nearly the same proportions of career choice intension, such as system development, data engineering, and geography education. The uniform career choice intension is probably determined by the intersectionality and comprehensiveness of GIS specialty. However, the number of employments intended to engage in scientific research is slightly less than those of other employments. Therefore, the teacher should guide students to select their employment directions by strengthening the training of their interest and ability to adapt to society in the future teaching process.
The criterion layer “teaching environment” indicates that basic experimental equipment, such as laboratory hardware and software equipment, and intramural and extramural practice bases, can fulfill teaching requirements. However, the latest surveying and mapping equipment, such as electronic level, 3D laser scanner and real-time kinematic instrument, are still scarce due to the lack of financial input of local governments and schools. The teacher should enrich and expand the content of practical teaching to enable students to keep abreast of the latest WebGIS trends according to intramural and extramural practice bases.
3.2 WebGIS teaching evaluation based on DSATLBO
3.2.1 Pareto front based on DSATLBO
The constructed bi-objective teaching evaluation model, including Eqs. (1) and (2), is solved based on DSATLBO. Population is set as [50, 100]. The maximum iteration is 100. The optimal individual coefficient is 0.3. The fitness function deviation is 0.01. Tfmax=2 and Tfmin=1; δmin=1 and δmax=5. An optimal non-dominated solution set, also known as the Pareto front, is then obtained, as shown in Figure 1.

Figure 1 Pareto fronts of NSGA-II and bi-objective teaching evaluation model based on DSATLBO (Three optimal solutions a, b and c are randomly selected as later analysis, Pareto front is obtained from DSATLBO)
From Figure 1, the discovered non-dominated solutions are uniformly spread out as far as possible along the Pareto front. The teacher- and student- oriented evaluation sub-objectives cannot simultaneously reach their maximum values. Neither the teacher-oriented sub-objective nor the student-oriented sub-objective uses other solutions, and none of the solutions in the figure dominates the others. The values of the teacher-oriented evaluation sub-objective range from 132 to 170, whereas those of the student-oriented evaluation sub-objective range from 126 to 168. The DSATLBO approach yields a slightly compact and continuous solution set and finds as many optimal solutions as possible.
3.2.2 Comprehensive evaluation of WebGIS course
Optimal criterion weights, index weights, and weighted scores from the Pareto front labeled a, b, and c, respectively, in Figure 1, are statistically obtained as shown in Tables 3 and 4.
Table 3 Optimal criterion weights (CW) for teacher- and student-oriented criterion layers according to three non-dominated solutions a, b and c in Figure 1 obtained from DSATLBO
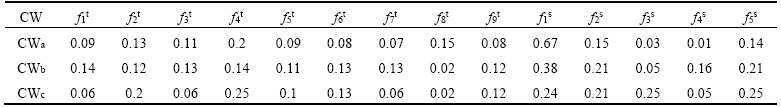
Table 4 Optimal index weights (IW) and weighted scores (WS) of each index layer for teacher- and student-oriented criterion layers according to three non-dominated solutions a, b and c in Figure 1 obtained from DSATLBO

From Table 3, teaching strategies (f2t) and classroom control (f4t) of the teacher-oriented criterion layers in optimal solutions a, b, and c in Figure 1 have relatively high weights. This result shows that the teacher should place considerable importance to teaching strategies and classroom control during the WebGIS teaching process. With regard to student-oriented criterion layers, the optimal weights of professional ability (f1s) in solutions a, b, and c are relatively the highest. Practical ability (f2s) and teaching environment (f5s) have high weights. This result indicates that students look forward to improving their professional and practical abilities in a complete and comfortable teaching environment.
From Table 4, the importance of the evaluation indices is compared and quantified to distinguish the quality and differences between various indices to the greatest extent. The summations of the weighted scores of the teacher- and student-oriented evaluation indices for optimal solution a in Figure 1 are 158.0 and 127.2, which are the abscissa and ordinate of point a, respectively. Similarly, the weighted scores of the index layers in b and c are added to 141.1, 138.7 and 132.3, 157.4, respectively. The solutions in the non-dominated set are all acceptable because none of them is absolutely superior to another. Each solution in the Pareto front depends upon a specific order of importance of the multiple objectives. The Pareto front with global optimal weights contains abundant information from which the hidden valuable information can be extracted to obtain accurate, alternative, objective, and realistic evaluation results.
3.3 Validation of DSATLBO performance
To validate the performance of the DSATLBO algorithm, the non-dominated sorting genetic algorithm-II (NSGA-II), a fast elitist non- dominated sorting genetic algorithm, is adopted. The initial values of NSGA-II parameters, such as population and number of generations, are set to be the same as those of DSATLBO. In addition, specific NSGA-II parameters, such as mutation probability and crossover probability, are set to 0.15 and 0.90, respectively. NSGA-II is then utilized to solve the multi-objective teaching performance evaluation model. The Pareto front is obtained according to NSGA-II, as shown in Figure 1.
From Figure 1, all individuals can converge to the optimal Pareto front after 100 generations of NSGA-II evolution, and non-dominated solutions are uniformly distributed along the Pareto front, similar to that in DSATLBO. Evidently, the Pareto front from DSATLBO in Figure 1 is nearly overlapped with that of the NSGA-II algorithm in Figure 1. However, the number of non-dominated solutions from NSGA-II is evidently less than those from DSATLBO. Therefore, DSATLBO outperforms NSGA-II.
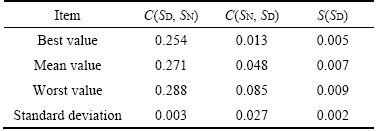
To further validate the performance of DSATLBO, the best, mean, and worst values of coverage to two sets and spacing of the optimal solutions from DSATLBO and NSGA-II are calculated and averaged over 100 independent runs (Table 5).
The mean values and standard deviations in Table 5 show a minimal difference in the optimal results between DSATLBO and NSGA-II. The best value of C(SD, SN)=0.254 indicates that 25.4% of the best non-dominated solutions from NSGA-II are inferior to those of DSATLBO. The best value of C(SN, SD)=0.013 shows that only 1.3% of the non-dominated solutions from DSATLBO are inferior to those of NSGA-II. The best value of S(SD)=0.005 indicates better distribution of the non-dominated solutions from DSATLBO. Therefore, the proposed DSATLBO algorithm can generate more diverse, reliable, and alternative Pareto solutions than NSGA-II, which further confirms that DSATLBO outperforms NSGA-II.
Table 5 Coverage to two sets (C(SD, SN) and C(SD, SN)) and spacing (S(SD)) of the optimal solutions (SD and SN imply the sets of non-dominated solutions from DSATLBO and NSGA-II, respectively)
4 Conclusions
The teacher- and student-oriented teaching performance evaluation system of a WebGIS course is first established and used for questionnaires from 2013 to 2017. The multi-objective evaluation model of WebGIS teaching quality, which is a nonlinear high-dimensional NP-hard problem, is then constructed. The weights of the indices at different levels of the model are optimized using the proposed DSATLBO algorithm. DSATLBO is a nature-inspired TLBO-based algorithm used to simulate teaching and learning with five improvements: dynamic nonlinear self-adaptive teaching factor, extracurricular tutorship factor, dynamic self-adaptive learning factor, multi-way learning factor, and non-dominated sorting factor. Optimal weights and weighted scores from DSATLBO are compared with those from NSGA-II using the Pareto front, coverage to two sets, and spacing of the non-dominated solution sets to validate the performance of DSATLBO. The simulation results show that DSATLBO can avoid being trapped into the local optimum, converge to an optimum solution, and increase the solution accuracy and robustness of the algorithm with uniform distribution along the Pareto front. Therefore, the efficiency and feasibility of DSATLBO are proven in solving multi-objective high-dimensional nonlinear problems.
The results of the teaching performance evaluation can objectively and scientifically reflect the advantages and disadvantages of the teaching process and the quality of all aspects of classroom teaching. The proposed teaching evaluation method also helps in guiding the professional development of students, including solid basic knowledge, strong practical ability, self-learning ability, adaptive ability to geo-spatial technology, employment competitiveness, and an innovative spirit.
References
[1] WANG X P, JIANG L, ZHONG J M. Study on fuzzy comprehensive evaluation model of teacher’s performance [J]. Applied Mechanics & Materials, 2015, 701–702(11): 1352– 1358.
[2] CID J A. Using explanatory item response models to examine the impact of linguistic features of a reading comprehension test on English language learners [D]. Harrisonburg, USA: James Madison University, 2009.
[3] TOLAND M D. Practical guide to conducting an item response theory analysis [J]. Journal of Early Adolescence, 2014,34(1): 120–151.
[4] ZHANG X Y. Research on the gray hierarchy evaluation model based on multimedia system and English teaching evaluation [J]. International Journal of Multimedia and Ubiquitous Engineering, 2014, 9(8): 181–192.
[5] RAVADANEGH S N, OSKUEE M R J, KARIMI M. Multi- objective planning model for simultaneous reconfiguration of power distribution network and allocation of renewable energy resources and capacitors with considering uncertainties [J].Journal of Central South University, 2017, 24(8): 1837–1849.
[6] MOHAMMADI M, MONTAZERI M, ABASI S. Bacterial graphical user interface oriented by particle swarm optimization strategy for optimization of multiple type DFACTS for power quality enhancement in distribution system [J].Journal of Central South University, 2017, 24(3): 569–588.
[7] ZHOU X, GAO G J, DONG H P, LI J, ZHOU X S, CHEN W, GUAN W Y. Crushing analysis and multi-objective optimization of bitubular hexagonal columns with ribs [J]. Journal of Central South University, 2017, 24(5): 1164–1173.
[8] HOU Jing-wei, MI Wen-bao, LI Long-tang. Spatial quality evaluation for drinking water based on GIS and ant colony clustering algorithm [J].Journal of Central South University, 2014, 21(3): 1051–1057.
[9] YUE Y H. The AHP model of evaluation on quality- oriented education in college English teaching [J]. I J Education and Management Engineering, 2012, 5(5): 37–42.
[10] HUO H F, WEN X. The application of analytical hierarchy process in education evaluation [J]. Sci Technol, 2012, 28(4): 48–49.
[11] LU Y L, LIAN I B, LIEN C J. The application of the analytic hierarchy process for evaluating creative products in science class and its modification for educational evaluation [J]. International Journal of Science & Mathematics Education,2013, 13(2): 1–23.
[12] CHEN J, HSIEH H, DO Q. Evaluating teaching performance based on fuzzy AHP and comprehensive evaluation approach [J]. Appl Soft Comput A, 2015, 28(3): 100–108.
[13] ZHOU L T, LI H X, SUN K B. Teaching performance evaluation by means of a hierarchical multifactorial evaluation model based on type-2 fuzzy sets [J]. Appl Intell A, 2017, 46(1): 34–44.
[14] ZHOU L, SUN K, LI H. Multifactorial decision making based on type-2 fuzzy sets and factor space approach [J]. J Intell Fuzzy Syst B, 2016, 30(4): 2257–2266.
[15] WAN H G, PENG Y. Rough and fuzzy set based classification algorithm on computer practice teaching evaluation [J]. Applied Mechanics and Materials, 2014, 678(10): 43–46.
[16] LIN Z. An improved self-organizing feature maps algorithm and its application in arts course teaching evaluation [J]. Journal of Software Engineering, 2013, 9(4): 903–910.
[17] LI X W. Study on innovation education evaluation for university based on improved BP neural network [J]. J Conv Inform Technol, 2013, 8(9): 1080–1086.
[18] QUE J H. Mathematics teaching quality evaluation research based on harmony search BP neural network [J]. Computer Modelling & New Technologies C, 2014, 18(12): 1315–1319.
[19] ZHENG X M. A novel method for foreign language teaching evaluation based on feature selection [J]. International Journal of Digital Content Technology and its Applications (JDCTA), 2013, 7(2): 133–140.
[20] UTTL B, WHITE C A, GONZALEZ D W. Meta-analysis of faculty’s teaching effectiveness: Student evaluation of teaching ratings and student learning are not related [J]. Studies in Educational Evaluation, 2017, 54(9): 22–42.
[21] RAO R V, SAVSANI V J, VAKHARIA D P. Teaching- learning-based optimization: A novel method for constrained mechanical design optimization problems [J]. Computer- Aided Design, 2011, 43(2): 303–315.
[22] RAO V R. Teaching learning based optimization algorithm and its engineering applications [M]. Bern: Springer International Publishing, 2016.
[23] CHEN D, ZOU F, WANG J, YUAN W. A teaching–learning- based optimization algorithm with producer–scrounger model for global optimization [J]. Soft Computing B, 2015, 19(3): 745–762.
[24] YU K, WANG X, WANG Z. Constrained optimization based on improved teaching–learning-based optimization algorithm [J]. Information Sciences, 2016, 352–353(7): 61–78.
[25] BALASUBBAREDDY M, SIVANAGARAJU S, SURESH C V. Multi-objective optimization in the presence of practical constraints using non-dominated sorting hybrid cuckoo search algorithm [J]. Engineering Science and Technology, an International Journal,2015, 18(4): 603–615.
[26] DEB K, PRATAP A, AGARWAL S, MEYARIVAN T. A fast and elitist multiobjective genetic algorithm: NSGA-II [J]. IEEE Trans, Evol Comput, 2002, 6(2): 182–197.
[27] RAO R V, RAI D P. Optimization of fused deposition modeling process using teaching-learning-based optimization algorithm [J]. Engineering Science and Technology, An International Journal, 2016, 19(1): 587–603.
[28] RAO R V, PATEL V. A multi-objective improved teaching- learning based optimization algorithm for unconstrained and constrained optimization problems [J]. International Journal of Industrial Engineering Computations, 2014, 5(1): 1–22.
[29] PATEL V K, SAVSANI V J. A multi-objective improved teaching–learning based optimization algorithm (MO-ITLBO) [J]. Information Sciences, 2016, 357(8): 182–200.
[30] ZITZLER E, DEB K, THIELE L. Comparison of multi- objective evolutionary algorithm: Empirical results [J]. Evol Comput, 2000, 8(2): 173–195.
[31] RAO R V, RAI D P, BALIC J. A multi-objective algorithm for optimization of modern machining processes [J]. Engineering Applications of Artificial Intelligence,2017, 61(3): 103–125.
[32] CUI Y A, ZHU X X, CHEN Z X, LIU J W, LIU J X. Performance evaluation for intelligent optimization algorithms in self-potential data inversion [J]. Journal of Central South University, 2016, 23(10): 2659–2668.
[33] PHUONG T Y, LEE D Y, LEE J G. Impacts of optimization strategies on performance, power/energy consumption of a GPU based parallel reduction [J].Journal of Central South University, 2017, 24(11): 2624–2637.
[34] SCHOTT J R. Fault tolerant design using single and multicriteria genetic algorithm optimization [D]. Cambridge, MA, USA, Department of Aeronautics and Astronautics, Massachusetts Institute of Technology, 1995.
[35] CHEN D, ZOU F, LU R, YU L, LI Z, WANG J. Multi- objective optimization of community detection using discrete teaching–learning-based optimization with decomposition [J]. Inform Sci, 2016, 369: 402–418.
(Edited by FANG Jing-hua)
中文导读
基于动态自适应教与学优化算法的WebGIS课程教学评价
摘要:WebGIS课程教学评价是一个多目标非线性高维NP-难问题。首先,基于2013年到2017年的问卷调查,建立了包括面向教师和面向学生评价两个子系统的WebGIS课程教学评价指标体系。其次,构建了多目标非线性高维评价模型,并通过动态自适应教学优化算法(DSATLBO)进行求解。DSATLBO对传统的基于教与学优化算法进行了5个策略的改进:动态非线性自适应教学因子、课外辅导因子、动态自适应学习因子、多向学习因子和非支配排序因子。然后,利用调查问卷数据和DSATLBO算法对WebGIS教学绩效进行了全面评价。最后,利用Pareto前沿、两集合覆盖率和非支配解集间距3个指标分别比较了DSATLBO和NSGA-II算法所得的最优权值和加权分值,以验证了DSATLBO的性能。结果表明,DSATLBO可以沿Pareto前沿均匀分布。因此,DSATLBO可以有效地解决关于WebGIS课程的多目标非线性高维教学评价模型。本研究所提出的教学评价方法有助于全面反映课堂教学质量,指导学生的专业发展。
关键词:教学评价;多目标;WebGIS;DSATLBO;优化
Foundation item: Project(41661026) supported by the National Natural Science Foundation of China; Project supported by the Fund for the Construction of Western-China First-class Specialty of Ningxia University, China
Received date: 2018-02-23; Accepted date: 2018-08-24
Corresponding author: HOU Jing-wei, PhD, Associate Professor; Tel: +86-15121888067; E-mail: hjwei2005@163.com; ORCID: 0000- 0002-5308-3204
Abstract: Teaching evaluation on a WebGIS course is a multi-objective nonlinear high-dimensional NP-hard problem. The index system for the teaching evaluation of a WebGIS course, including teacher- and student-oriented sub-systems, is first established and used for questionnaires from 2013 to 2017. The multi-objective nonlinear high-dimensional evaluation model is constructed and then solved via dynamic self-adaptive teaching–learning-based optimization (DSATLBO). DSATLBO is based on teaching–learning-based optimization with five improvements: dynamic nonlinear self-adaptive teaching factor, extracurricular tutorship factor, dynamic self-adaptive learning factor, multi-way learning factor, and non-dominated sorting factor. WebGIS teaching performance is fully evaluated based on questionnaires and DSATLBO. Optimal weights and weighted scores from DSATLBO are compared with those from the non-dominated sorting genetic algorithm-II using the Pareto front, coverage to two sets, and spacing of the non-dominated solution sets to validate the performance of DSATLBO. The results show that DSATLBO can be uniformly distributed along the Pareto front. Therefore, DSATLBO can efficiently and feasibly solve the multi-objective nonlinear high-dimensional teaching evaluation model of a WebGIS course. The proposed teaching evaluation method can help reflecting the quality of all aspects of classroom teaching and guide the professional development of students.
