

J. Cent. South Univ. (2018) 25: 2601-2614
DOI: https://doi.org/10.1007/s11771-018-3939-9

Particle deposition in ventilation duct with convex or concave wall cavity
WANG Fei-fei(���ɷ�)1, ZHANG En-shi(�Ŷ�ʵ)1, XU Xin-hua(���»�)1,WANG Jin-bo(������)1, MI Jian-chun(����)2
1. School of Environmental Science and Engineering, Huazhong University of Science and Technology,Wuhan 430074, China;
2. College of Engineering, Peking University, Beijing 100871, China
 Central South University Press and Springer-Verlag GmbH Germany, part of Springer Nature 2018
Abstract:
A numerical study is carried out on particle deposition in ducts with either convex or concave wall cavity. Results show that, if compared with smooth duct, particle deposition velocities increase greatly in ducts with wall cavities. More specifically, for ��+<1,
  increase by about 2�C4 orders of magnitude in the cases with the convex and concave wall cavities; for ��+>1, grows relatively slower. Enhancement of particle deposition with wall cavities is caused by the following mechanisms, i.e., interception by the wall cavities, expanded deposition area, and the enhanced flow turbulence. In general, addition of wall cavities is contributive for particle deposition, so it provides an efficient approach to remove particles, especially with small size, e.g., PM2.5. Moreover, the convex wall cavity leads to a larger increment of than the concave wall cavity. However, taking pressure loss into account, thoughis relatively lower, duct with the concave wall cavity is more efficient than that with the convex wall cavity.
Key words:
numerical simulation; ventilation duct; particle deposition; deposition velocity��
Cite this article as:
WANG Fei-fei, ZHANG En-shi, XU Xin-hua, WANG Jin-bo, MI Jian-chun. Particle deposition in ventilation duct with convex or concave wall cavity [J]. Journal of Central South University, 2018, 25(11): 2601�C2614.
DOI:https://dx.doi.org/https://doi.org/10.1007/s11771-018-3939-91 Introduction
With the rapid improvement of human living standards, demand of high indoor air quality (IAQ) is increasingly expanding. Fine/micro particle matter (PM) exposure becomes an essential incentive to the human health [1]. The reduction of PM, either in the atmospheric or in the indoor air, has attracted great interests of scientists and engineers over the world. Ventilation ducts in the air-conditioning system are the main connection of indoor and outdoor environment. Though typically equipped with various filters to percolate the airborne particles, the airflow inside the ventilation ducts can still carry a large quantity of fine particles into the indoor. In special, when the airborne particles travel through the ventilation ducts, they are affected greatly by different forces and might deposit on the wall surfaces. It is hence important to investigate the particle characteristics in the ventilation ducts to control the indoor airborne PM level. Moreover, understanding particle behavior in ducts can also provide alternative method for the engineering design of air clean filters.
To explore effective method to reduce the PM, a large quantity of research on the particle depositions is carried out, generally via experiments or numerical modeling. On the experimental side, they are implemented and can provide valuable and accurate data, such as those reviewed by LAI [2] and recently by BOUILLY et al [3]. In the past few decades or so, some measurements of the particle deposition in the ventilation ducts were conducted, where the influence of the particle sizes, particle shapes, particle materials, airflow feature, wall surface roughness were mainly concerned [4�C7]. Among those studies, the roughness of wall surface was found to have great impacts on the particle deposition. For example, LAI et al [4, 5] experimentally found that the addition of the repeated surface ribs on the ventilation duct wall can greatly accelerate particle deposition. This indicates that the influence of the wall roughness on the particle behavior in the ducts is important and worth more investigations.
In practical ventilation systems, inside airflow is typically turbulent. Owing to the various forces, e.g., inertia force, turbulent dispersion, Brownian force, and Saffman��s lift force, the airborne particles move randomly. As a result, though the relationships between the particle deposition velocity and the particle size from different experiments exhibits a similar trend, those measured data can differ significantly by one to two orders of magnitude [2, 4�C8]. In particular, it is very difficult to measure all the crucial information in the experiments. Thus, the experimental investigation of the particle behavior in the ventilation duct is quite challenging.
Computational fluid dynamics (CFD) modeling is an alternative and powerful way to investigate particle characteristics in ventilation ducts. Table 1 summarizes some important information from the previous numerical literatures [9�C28]. It can be seen that modeling work is mainly focused on either replicating the measurements or understanding the physical observations. There are generally several typical numerical methods, i.e., Reynolds-averaged Navier-stokes (RANS), large eddy simulation (LES), and direct numerical simulation (DNS), currently available to predict the turbulent flow and particle behavior in ventilation duct. However, RANS is more feasible and suitable for the simulations of engineering applications when compared to the requirements of too much computational cost of the latter two. For instance, ZHANG et al [16] and GAO et al [22] investigated the accuracy and capability of various turbulent models, i.e., v2�Cf model, Reynolds stress model (RSM), RNG k�C�� model and SST k�C�� model, coupled with some proper corrections to the near-wall turbulence. They found that all of those RANS turbulent models can successfully predict the particle deposition velocity in ventilation ducts, and a consensus has been reached that RANS modeling coupled with some adequate corrections to the flow field can accurately predict the particle deposition in the turbulent flows [15, 16, 22, 24�C27].
Table 1 Previous research on particle deposition in ventilation ducts

Many studies were carried out for application of CFD models to predict behavior and deposition of particle in ventilation ducts with various forms [13, 24�C27]. For instance, LO LACONO et al [13] carried out a LES investigation and found that the surface ribs on the duct wall could intercept the particles and accelerate the accumulation. LU et al [24�C27] successfully developed an accurate numerical model, i.e., a RSM model with a correction to the near-wall normal turbulent fluctuating velocity, to predict the particle behavior in ventilation ducts with ribs. It was found the surface ribs may significantly strengthen the particle deposition which is consistent with the experimental observation [4]. This study also investigated the effect on the enhancement efficiency of the rib parameters, e.g., shape, arrangement configuration, spacing, and height. However, use of the surface ribs will surely increase the pressure loss. It is hence of great interest to optimize structure of wall surface to simultaneously enhance particle deposition and decrease pressure drop. In particular, addition of a concave cavity onto the wall surface is a useful approach to facilitate flow stability and heat transfer [29], similar with rib or convex cavity. Nevertheless, most previous studies carried out the investigation of particle deposition in ventilation duct with convex cavity. The effects of adding concave and convex cavity to the wall surface on particle deposition are not commonly studied.
From the above discussion, the aim of this article is to numerically investigate aerodynamics characteristics and deposition of airborne particle in ducts with either convex or concave wall cavity. Characteristics of air-flow and particles tracks are studied. Moreover, enhancement and mechanisms of particle deposition in the ducts with different wall cavities are seriously studied and discussed.
2 Model descriptions
2.1 Physical models
The schematic diagrams of the investigated smooth duct, duct with convex wall cavity, and duct with concave wall cavity are shown in Figure 1. The smooth duct as shown in Figure 1(a) is studied here for validation of the numerical models, and also is used as a reference for the other two ducts. The lengths and heights of all three ventilation ducts are 400 and 20 mm, which are the same as that used in Refs. [15, 16, 22, 24�C27]. To ensure the airflow in the ducts is fully developed into turbulent state, the first halves of all ducts are smooth (x<200 mm). For the latter half, 19 pairs of convex and concave cavities are arranged on the two sides of these two ducts separately as shown in Figures 1(b) and (c). The convex wall cavity has the same size as the concave one but in the opposite direction. The length and height of the cavities are all 1 mm, and the distance between each other is 10 mm.

Figure 1 Schematic diagrams of investigated ventilation ducts:
For all the calculations, the velocity and the density of the airflow are fixed at 5.5 m/s and 1.225 kg/m3 respectively, at 15 ��C. The Reynolds number can be calculated as 7532. 30000 spherical solid particles at the same diameter are released into the airflow at x=200 mm, which is selected as the particle release position to ensure that the flow field is fully developed. The density of the particle is 2000 times the density of air. In this study, the heat exchange among the particles, air and the wall is not ignored. The velocity and the temperature of the particle is the same as that of the airflow. Several different diameters of the particles, i.e., 0.1, 0.2, 0.3, 0.5, 1, 2, 3, 5, 10, 20, 30 and 50 ��m, are investigated in this study.
2.2 Numerical models
In numerical studies, the fluid flow field is usually described by Navier-Stokes equations, including the conservations of continuity, momentum, and energy, etc. The flow field numerical models, models for the particle-flow interaction, models for particle turbulent dispersion as well as corrections to the near-wall turbulence of the airflow are described as follows.
2.2.1 Models for flow field
The present simulations use the following governing equations to predict the airflow inside the ventilation duct.
Continuity equation:
 (1)
(1)
Momentum conservation equation:
 (2)
(2)
According to Refs. [15, 16, 22, 30, 31], accurate flow field prediction is crucial for the modeling of the particle deposition. Accordingly, the RSM model with a near-wall correction to the normal turbulent fluctuating velocity is utilized to predict the turbulent air-flow field. Compared to other models, RSM model considers anisotropic turbulent eddy-viscosity hypothesis. Besides the equation for turbulent dissipation rate (��), RSM model solves other seven additional equations in three-dimensional problems and directly predicts the time-averaged fluctuating velocity components to close the Reynolds-averaged Navier-stokes equations. The transport equations of the �� and Reynolds-stress  can be expressed by


 (3)
(3)

 (4)
(4)
where the empirical constant ����=1.3, C��2=1.44 and C��2=1.92 are used. A two-layer zonal model with enhanced wall function is selected to predict the turbulent flow in the near wall region. More details about the RSM model are referred in the literature [32].
2.2.2 Models for particle-flow interaction
In the present study, Lagrangian method is used to track particle in the flow for particle deposition. Because the concentration of the airborne particle is quite low, the impacts of the particles on the flow and the collision between particles are ignored. As a result, the main forces on particles are drag force, gravity, Brownian force and Saffman��s force. Based on the calculated flow field [32], in Lagrangian model, the force equation in the particle phase is as:

 (5)
(5)
 (6)
(6)
 (7)
(7)
 (8)
(8)
where CD, Rep, ug, up, ��g and ��p respectively are drag coefficient, particle Reynolds number, flow velocity, particle velocity, air density, and particle density; �� is particle relaxation time expressed by Eq. (6).
2.2.3 Models for turbulent dispersion of particles
The airflow state in air-conditioning ventilation duct is usually turbulent. For this reason, the discrete random walk (DRW) model is implemented to predict the particle movement caused by the turbulent dispersion. The DRW model includes the effect of instantaneous turbulent velocity fluctuations on the particle trajectories and allows a particle to interact with a series of turbulent eddies. The interaction between one particle and one eddy ends when the lifetime (��e) of the eddy is totally consumed or the particle pass the eddy boundary after a crossing time (��cross). Then, a new interaction between the particle and the next eddy starts.
The lifetime of the eddy is defined as a random variation about the fluid Lagrangian integral time as Eq. (9). The particle eddy crossing time (��cross) is defined as Eq. (10).
��e=�C��Llnr (9)
 (10)
(10)
here, ��L��0.3k/�� when the RSM model is used; r is uniform random number between 0 and 1; k is the kinetic energy of turbulence; �� is the particle relaxation time; Le is the eddy length scale (��(C��)3/4(k3/2/��)); |u�Cup|is the magnitude of the relative velocity.
When the airflow is turbulent, the DRW model will predict the trajectories of particles using the mean fluid phase velocity, in Eq. (4). To consider the dispersion of the particles due to turbulence, one can include the instantaneous value of the fluctuating airflow velocity,
  For the RSM model, anisotropy of the stresses is included from the derivation of the velocity fluctuation as Eqs. (11)�C(13):
u��=��urms�� (11)
v��=��vrms�� (12)
w��=��wrms�� (13)
where �� is a normally distributed random number; urms��, vrms��, wrms�� are the root mean-square (RMS) value of the velocity fluctuation in these three directions respectively.
2.2.4 Corrections to near-wall turbulence of air-flow
Previous studies [15, 16, 19, 22, 24�C27] have clearly demonstrated that the near wall turbulent fluctuating velocity, especially on the wall-normal direction, has important impacts on the particle deposition. Though being considered, the RSM model will overestimate the anisotropic feature of the instantaneous fluctuating velocities in the near wall region as shown subsequently in Section 3.1. Consequently, this study implements some corrections by adopting curve-fitted values of fluctuating velocity in the wall-normal direction. For the smooth duct, the correction is as Eq. (14) [19, 23]. For the duct with cavities, the correction is as Eq. (15). In this study, both correction are implemented at y+<30.
 at y+<4 (14)
 at y+<30 (15)
where the constant C, a, b and c are 0.008, 0.0116, 0.203, and 2.421 respectively; y+ is the normalized wall distance as Eq. (16); u* is the friction velocity as Eq. (17).
 (16)
(16)
 (17)
(17)
where ��w is the wall shear stress  umean is the mean velocity of the air and f is the friction factor as expressed as Eq. (18):
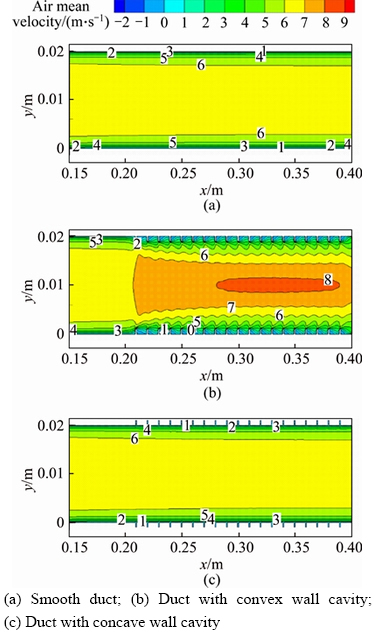
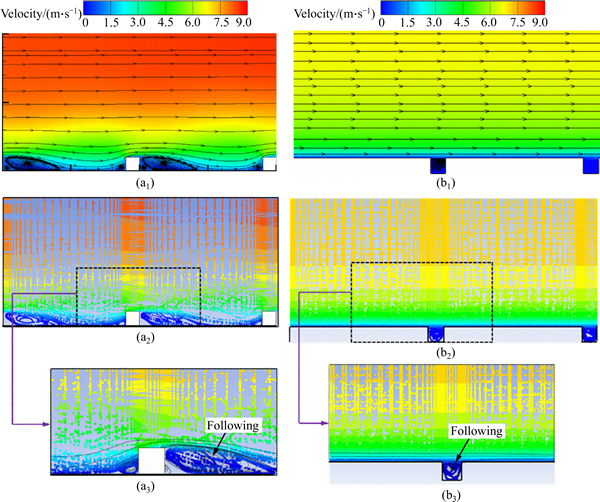
f=0.0791Re�C0.25 for 2800 2.3 Mesh dependence study and boundary conditions These three ducts as shown in Figure 1 are all considered two-dimensional, and all of them are discretized to orthogonally structured meshes. After verifying the grid-independency of the results by using a finer grid with 190000 grids, the meshes with 32000, 69180 and 67960 grids are respectively used for the smooth duct, the ducts with convex and concave wall cavities. The centroid of the first grid is 0.065 mm away from the wall with the y+ being about 1.3. The non-slip velocity wall condition is implemented to the wall. Because of their small diameters, the particles are assumed to be trapped once they contact with the wall and no reflection and collision between them are considered. To obtain an accurate flow field, the one-seventh power law is employed to express the velocity (u) as Eq. (19). The turbulent kinetic energy (k) and its dispersion (��) at the inlet of the ducts are expressed as Eqs. (20) and (21). where h is the height of the duct, i.e., 0.02 m; the constants C�� and �� are 0.09 and 0.4 respectively; H=y for 0��y��h/2, and H=h�Cy for h/2 All the transport equations (continuity, momentum, turbulence kinetic energy, RSM, ��, and DPM) are solved using the commercial package ANSYS FLUENT v14.0 [32]. The SIMPLE algorithm method is utilized to solve pressure and velocity coupling. The POSI scheme is selected to solve the pressure equation. The Runge-Kutta method and the DRM model are used to track the path of the particles. The second-order upwind scheme is employed for discretizing the equations in order to improve the accuracy of the simulations. To improve the prediction of the flow field, UDFs (user defined function) are used to introduce the boundary condition of the velocity distribution at inlet as Eqs. (19�C21). Solution convergence is determined by two criteria. The first one is to ensure that the numerical residuals are <10-6 for all the variables. The second criterion is to ensure that the variations between consecutive iterations of velocity are kept within 0.1 m/s at the downstream outlet of the computational domain. After the convergence of the flow field, a UDF, i.e., Eqs. (14) and (15), is used to modify the instantaneous fluctuating velocity near the wall region in the ventilation duct. 3 Validation of numerical models 3.1 Flow field To validate the present models, the prediction of the turbulent flow in the horizontal smooth ventilation duct was first carried out. Figure 2 shows the non-dimensional mean velocity (u+��u/y+) and the turbulent fluctuating wall-normal velocity (v+rms) against y+ at x=300 mm. In this figure, the results with or without the modification of Eq. (14) are presented. The direct numerical simulation (DNS) data of KIM et al [33] is also included for comparison. Figure 2(a) shows that the present models can well reproduce the DNS data. Since Eq. (14) is only used to modify the v+rms, it has little effect on the mean air velocity. Figure 2(b) illustrates that the use of Eq. (14) is critical to correctly predict the distribution of v+rms, especially in the near-wall region. For y+<30, the models without correction overestimates v+rms while the predictions match the DNS data well with the correction of Eq. (14). For y+>30, the numerical models with and without correction respectively produce similar results, i.e. slight underestimation when compared with the DNS data slightly. Therefore, the models with correction of Eq. (14) are used to reproduce the flow field characteristics in the smooth ventilation duct. The flow field may approximately capture the features of the airflow process. Figure 2 Non-dimensional mean velocity (u+) (a) and turbulent fluctuating velocity (v+rms) versus wall y+ (b) in horizontal smooth ventilation duct 3.2 Particle deposition The strength of particle deposition is usually characterized by its velocity as Eq. (22). The total of the particles deposited per unit time on the unit area of the duct is as Eq. (23). The relationship between the dimensionless deposition velocity Vd=J/C0 (22) J=Nd/t/A (23) where C0 is the average particle concentration in the air-flow, i.e., C0=N0/V. Nd, N0, t, A, and V are, respectively, the number of the particles deposited onto the wall surface, the total number of particles initially released into the air-flow, the residence time of one particle in the duct, the cross-section area and volume of the duct. Obviously, ��+ increases with dp. Figure 3 plots Figure 3 Comparison of particle deposition velocity 4 Particle deposition in ducts with different wall cavities As presented before, the predictions of airflow characteristic and particle deposition in the smooth duct by using the models with correction were validated by using the published literatures. These models are further used to predict the airflow characteristic and particle deposition etc. in the ducts with convex and concave wall cavities respectively. 4.1 Particle deposition enhancement Figure 4 presents the particle deposition velocity Figure 4(b) indicates that the enhancement ratio changes greatly as ��+ varies. For finer particles,the enhancement ratio increases with ��+. In other words, for ��+<0.3, the particle deposition is strengthened by about 2�C4 orders of magnitude, and it increases until a peak value, i.e., 7770 times and 1320 times respectively for the ducts with the convex and concave wall cavities respectively at ��+��0.3. In contrast, in the eddy diffusion-impaction regime and the inertia-moderated regime, the minimum enhancement ratios are only 1.3 and 1.1. Figure 4 Particle deposition velocity (a) and its enhancement ratio (b) in ventilation ducts with different wall cavities Nevertheless, Figure 4 reveals that both the convex and concave wall cavities have great effect on the particle deposition in ventilation ducts. Furthermore, this effect becomes more efficient for the particles with small sizes. Therefore, implementation of convex or concave wall cavity in ventilation ducts may provide an effective method for removing fine particle matters, e.g., PM2.5. 4.2 Particle deposition efficiency In engineering designs, the pressure drop and the energy consumption of the ventilation ducts should be carefully considered. Although adding convex or concave wall cavity onto the ducts leads to the acceleration of the particle deposition, it would increase the aerodynamic drag or the pressure drop of the airflow in the ducts. To consider these two factors, LU et al [24�C27] defined an efficiency ratio (��) to simultaneously evaluate the particle deposition and the duct resistance characteristics. The efficiency ratio �� can be expressed as Eq. (26). where ��Prough, ��Psmooth are the pressure drops in the duct with wall cavity and the smooth duct. Figure 5 indicates the pressure distributions along the direction of the airflow in these ducts. This figure shows that the pressure in the duct with concave wall cavity is quite close to that in the smooth duct and both of them have a smooth descent along x-direction. For the smooth duct, the pressure value at the particle releasing position, x=200 mm, is about 3.5 Pa, while that in the duct with the concave wall cavity is slightly higher, i.e., 4 Pa. However, for the duct with the convex wall cavity, the total pressure at the second half of the duct appears to be a periodic oscillation because of the repeating rids and decreases monotonously from about 24 Pa to zero along the x-direction. Due to the addition of the convex wall cavity, the pressure first increases and reaches a peak at the windward side of the rib, then decreases rapidly to the minimum value to form the periodic oscillation. The ratios (��Prough/��Psmooth) of the pressure losses in the ducts with the convex and concave wall cavity are about 6.85 and 1.14 respectively. Figure 5 Pressure distributions along air-flow direction in different ducts Figure 6 presents the efficiency ratio (��) of particle deposition in the ventilation ducts with convex and concave wall cavities verse relaxation time (��+). The difference between �� in both ducts with convex and concave wall cavities is so small that they almost overlaps each other. It is clear that �� first increases and then decreases with ��+. The peaks of �� are both larger than 1000 and located at ��+��0.17 or dp=2 ��m. However, the efficiency ratios are even close to 1 for large particles. This means that implementation of convex or concave wall cavity into ducts may cause excessive flow drag and might not be the best means to remove large particles. Figure 6 Efficiency ratio of particle deposition in duct with convex and concave wall cavities In addition, a careful inspection of Figure 6 demonstrates that the efficiency ratio of the particle deposition in the duct with the concave wall cavity is slightly higher than that in the duct with the convex wall cavity. This may be due to the larger pressure drop of the airflow in the latter duct. In other words, taking the pressure loss into account, though the particle deposition velocity is smaller as shown in Figure 4, the duct with the concave wall cavity is more efficient than that with the convex wall cavity, especially for small particles. 5 Analysis of particle deposition enhancement caused by different wall cavities 5.1 Mechanisms for particle deposition enhancement by wall cavities The mechanism of particle deposition enhancement in the ducts with different wall cavities is seriously analyzed. As far as the physical process is concerned, the particles in airflow can strike more easily onto the windward side of the wall surface due to the blocking effect when the convex wall cavity is implemented. In addition, the convex cavity in the duct can reduce the deposition distance of the particles to the wall. Moreover, the surface area of the ducts with cavities for particle deposition is 0.476 m2, which is 19% larger than 0.4 m2 for the smooth one as shown in Figure 1. These factors are all benefit for enhancing particle deposition. Besides the above physical reason, particle deposition in airflow is also closely related to flow field. The structures in the first halve of the ducts are all the same, and the airflow is fully developed into the turbulent state. However, the air velocity distributions in the latter halves of these three different ducts are quite different as shown in Figure 7. Figure 7(b) indicates that the air velocity is speeded up slightly for the duct with the convex wall cavity. Due to the compression effects of the convex ribs, the boundary layer deviates from the wall for some distance, and the flow in it changes greatly. Figure 8 presents these deviations in more details. Figure 7(c) shows that the air velocity distribution appears to be almost the same with that in the smooth duct. This is why the pressure loss of the airflow in the duct with the concave wall cavity does not increase much. Figure 7 Airflow velocity distributions in different ducts: Figure 8 shows the distribution of turbulence kinetic energy, i.e., TKE, and the flow streamlines in the smooth duct and the ducts with convex and concave wall cavities. The streamline of the airflow in the smooth duct is nearly parallel to x-direction. Apparently, there is no wall-normal velocity, which is negative to the particle deposition. In contrast, Figures 8(b) and (c) illustrate that the streamlines are changed greatly and eddies are formed in the near-wall region of the ducts with wall cavities. That means that some wall-normal velocities exist in both non-smooth ducts, which surely help to entrain particles and transport them to the wall. On the other hand, Figure 8 also indicates that the near-wall TKE is increased greatly with the addition of wall cavities. The improved TKE can accelerate the turbulent fluctuating wall-normal velocity, which enhances the momentum exchange between the flow in the near-wall region and that in the outer. For the smooth duct, the peak TKE is only about 0.18 m2/s2. However, for the duct with convex wall cavity and the duct with concave wall cavity, the value becomes 2.98 and 0.6 m2/s2 respectively. The near-wall TKE and the turbulence intensity of the air-flow in the duct with convex wall cavity are much stronger than those in the duct with concave wall cavity as shown in Figures 8(b) and 9(c). In the duct with convex wall cavity, due to the inverse flow, there are two eddies in the space between two cavities, i.e., a larger one and relatively smaller one respectively attached at both sides of the wall cavity. Obviously, this is beneficial to the entrainment and capture of particles to the near-wall region. However, for the duct with concave wall cavity, only a small eddy can be found inside the concave cavity. Figure 8 Turbulence kinetic energy (TKE) distribution and streamlines of airflow in different ducts: The strengthened turbulent fluctuation and the momentum exchange are both favorable for the airflow to entrain floating particles into eddies near the wall cavities. It is obvious that a larger TKE is conducive to particle deposition. Based on the above analysis, it can be concluded that interception by rids, expanded deposition area, and enhanced flow turbulence are all conducive to particle deposition in ducts with wall cavities. Considering the peculiar interception effect, it is obvious that the duct with the convex wall cavity results in a larger particle velocity and better particle deposition than that with the concave wall cavity as shown in Figure 4. 5.2 Understanding of particle deposition in different ducts at different sizes As mentioned earlier, in these two ducts with wall cavities, enhancement and efficiency of particle deposition differ with particle sizes.Figures 5 and 8 indicate that the airflow structure is quite important for particle deposition. For more detail analysis of the effects of particle sizes on deposition, Figures 9 and 10 respectively present the air velocity distributions, streamlines, distributions and tracks of particles in the ducts with the convex and concave wall cavities at two particle sizes. 2 ��m and 30 ��m are selected as representative particles with small and large diameters. Figures 9 and 10 demonstrate that distributions of particle at different sizes differ greatly. With respect to the uniform distribution in the region away from the wall, the particle distribution is more disordered in the near-wall region of the duct. For dp=2 ��m, a large number of particles are accumulative in the space between two cavities. In contrast, the path of the large particle at dp=30 ��m is relatively uncomplicated, and only a few particles exist in the near wall region. Figures 9(a3) and 9(b3) indicate that the particles follow closely the airflow and form attached eddies around the convex wall cavity and inside the concave wall cavity for dp=2 ��m. This is because small particle is so light that the airflow affects its path greatly. Thus, those small size particles can be easily entrained into the airflow eddies and captured by the wall. However, a careful insight into Figures 10(a3) and 10(b3) reveals that the particles at dp=30 ��m are nearly not controlled by the airflow because their gravity and inertia cannot be ignored. In the windward side of the cavity, the large particle penetrates directly the eddy and strikes onto the wall. On the other hand, the flow direction changes hastily after wall of the cavities, where it cannot follow and start to deviate discernibly from the air streamline due to the inertia. That means that the airflow has a weaker influence on the movement of larger particle instead of smaller particle. Consequently, since the addition of the convex/concave wall cavity changes the flow structure significantly in the near wall region, the deposition velocity of small particle increases more rapidly while the deposition velocity of larger particle does not increase too much as shown in Figure 4. Figure 9 Air velocity distribution contour, streamlines, distributions and tracks of particles in duct with convex (a1, a2, a3) and concave (b1, b2, b3) wall cavities at dp=2 ��m (Dashed lines in (a3) and (b3) are streamlines from (a1) and (b1)) Figure 10 Air velocity distribution contour, streamlines, distributions and tracks of particles in duct with concave (a1, a2, a3) and concave (b1, b2, b3) wall cavities at dp=30 ��m (Dashed lines in (a3) and (b3) are streamlines from (a1) and (b1)) 6 Conclusions A numerical study is performed on particle deposition in ventilation ducts with either convex or concave wall cavity, with particle diameter ranging from 0.1 ��m to 50 ��m. The built models, i.e., RSM and DPM model with some UDF corrections are validated by using published data from previous studies. Then, particle behavior in ducts with convex/concave wall cavities is predicted. The conclusion may be summarized as follows. 1) Particle deposition velocity 2) The airflow structure in the duct with convex wall cavity in the near-wall region is more complex than that in the duct with concave wall cavity. This leads to a higher turbulent kinetic energy in the former, which is conducive to particle deposition. Therefore, 3) Addition of the convex/concave wall cavity changes the airflow structure significantly in the near wall region and deposition velocity 4) In general, addition of the convex or concave wall cavity is an efficient way for reduction of PM2.5 (dp<2.5 ��m) to improve indoor air quality and also provides an alternative method for the engineering design of air clean filters. More work on experiments and also optimization of structure and arrangement of the wall cavities need more attentions. References [1] POPE C A, BURNETT R T, THUN M J, CALLE E E, KREWSKI D, ITO K, THURSTON G D. Lung cancer, cardiopulmonary mortality, and long-term exposure to fine particulate air pollution [J]. Journal American Medical Association, 2002, 287: 1132�C1141. [2] LAI A C K. Particle deposition indoors: A review [J]. Indoor Air, 2002, 12: 211�C214. [3] BOUILLY J, LIMAM K, B [4] LAI A C K, BYRNE M A, GODDARD A J H. Measured deposition of aerosol particles on a two-dimensional ribbed surface in a turbulent duct flow [J]. Journal of Aerosol Science, 1999, 30: 1201�C1214. [5] LAI A C K, BYRNE M A, GODDARD A J H. Enhanced particle loss in ventilation duct with ribbed surface [J]. Building and Environment, 2000, 35: 425�C432. [6] BARTH T, REICHE M, BANOWSKI M, OPPERMANN M, HAMPEL U. Experimental investigation of multilayer particle deposition and resuspension between periodic steps in turbulent flows [J]. Journal of Aerosol Science, 2013, 64: 111�C124. [7] SIPPOLA M R, NAZAROFF W W. Experiments measuring particle deposition from fully developed turbulent flow in ventilation ducts [J]. Aerosol Science Technology, 2004, 38(9): 914�C925. [8] BAGHDAR HOSSEINI S, HAGHIGHI KHOSHKHOO R, MALABAD S M. Experimental and numerical investigation on particle deposition in a compact heat exchanger [J]. Applied Thermal Engineering, 2017, 115(25): 406�C417. [9] ZHANG H, GOODARZL A. Aerosol particle transport and deposition in vertical and horizontal turbulent duct flows [J]. Journal Fluid Mechanics, 2000, 406: 55�C80. [10] MATIDA E A, FINLAY W H, LANGE C F, GRGIC B. Improved numerical simulation of aerosol deposition in an idealized mouth�Cthroat [J]. Journal of Aerosol Science, 2004, 35(1): 1�C19. [11] BEGHEIN C, JIANG Y, CHEN Q Y. Using large eddy simulation to study particle motions in a room [J]. Indoor Air, 2005, 15(4): 281�C290. [12] DRITSELIS C D. Numerical study of particle deposition in a turbulent channel flow with transverse roughness elements on one wall [J]. International Journal Multiphase Flow, 2017, 91: 1�C18. [13] LO IACONO G, TUCKER P G, REYNOLDS A M. Predictions for particle deposition from LES of ribbed channel flow [J]. International Journal Heat Fluid Flow, 2005, 26(4): 558�C568. [14] WANG Y. On the effect of anisotropy on the turbulent dispersion and deposition of small particles [J]. International Journal Multiphas Flow, 1999, 25: 551�C558. [15] ZHANG Z, CHEN Q. Comparison of the Eulerian and Lagrangian methods for predicting particle transport in enclosed spaces [J]. Atmospheric Environment, 2007, 41: 5236�C5248. [16] ZHANG Z, CHEN Q. Prediction of particle deposition onto indoor surfaces by CFD with a modified Lagrangian method [J]. Atmospheric Environment, 2009, 43(2): 319�C328. [17] HE C, AHMADI G. Particle deposition in a nearly developed turbulent duct flow with electrophoresis [J]. Journal of Aerosol Science, 1999, 30(6): 739�C758. [18] MEHEL A, TANI [19] TIAN L, AHMADI G. Particle deposition in turbulent duct flows-comparisons of different model predictions [J]. Journal of Aerosol Science, 2007, 38: 377�C397. [20] ZHANG J, LI A. CFD simulation of particle deposition in a horizontal turbulent duct flow [J]. Chemical Engineering Research Design, 2008, 86(1): 95�C106. [21] PARKER S, FOAT T, PRESTON S. Towards quantitative prediction of aerosol deposition from turbulent flows [J]. Journal of Aerosol Science, 2008, 39(2): 99�C112. [22] GAO N, NIU J, HE Q, ZHU T, WU J. Using RANS turbulence models and Lagrangian approach to predict particle deposition in turbulent channel flows [J]. Building Environment, 2012, 48: 206�C214. [23] LECRIVAIN G, SEVAN D M, THOMAS B, HAMPEL U. Numerical simulation of multilayer deposition in an obstructed channel flow [J]. Advance Powder Technology, 2014, 25(1): 310�C320. [24] LU H, LU L. Numerical investigation on particle deposition enhancement in duct air flow by ribbed wall [J]. Building Environment, 2015, 85: 61�C72. [25] LU H, LU L. A numerical study of particle deposition in ribbed duct flow with different rib shapes [J]. Building Environment, 2015, 94: 43�C53. [26] LU H, LU L. Effects of rib spacing and height on particle deposition in ribbed duct air flows [J]. Building Environment, 2015, 92: 317�C327. [27] LU H, LU L. CFD investigation on particle deposition in aligned and staggered ribbed duct air flows [J]. Applied Thermal Engineering, 2016, 93: 697�C706. [28] WANG F, ZHANG E, WANG J. A study of particle deposition in ventilation ducts with convex or con-cave wall cavity [J]. Procedia Engineering, 2017, 205: 3285�C3292. [29] RAN J, LI L, DU X, WANG R, PAN W. Numerical investigations on characteristics of methane catalytic combustion in micro-channels with a concave or convex wall cavity [J]. Energy Conversion Management, 2015, 97: 188�C195. [30] ANSARIPOUR M, ABDOLZADEH M, SARGAZIZADEH S. Computational modeling of particle transport and distribution emitted from a laserjet printer in a ventilated room with different ventilation configurations [J]. Applied Thermal Engineering, 2016, 103: 920�C933. [31] ZHOU J, ZHANG J. Numerical investigation of particle deposition on converging slot-hole film-cooled wall [J]. Journal of Central South University, 2017, 24(12): 2819- 2828. [32] FLUENT Inc. FLUENT 14.0 user's guide [M]. Lebanon, NH, 2011. [33] KIM J, MOIN P, MOSER R. Turbulence statistics in fully developed channel flow at low Reynolds number [J]. JournalFluid Mechanics, 1987, 177: 133�C166. [34] KVASNAK W, AHMADI G, BAYER R, GAYNES M. Experimental investigation of dust particle deposition in a turbulent channel flow [J]. Journal of Aerosol Science, 1993, 24(6): 795�C815. [35] SEHMEL G A. Particle resuspension from an asphalt road caused by car and truck traffic [J]. Atmospheric Environment, 1973, 7(3): 291�C309. [36] WOOD N B. A simple method for the calculation of turbulent deposition to smooth and rough surfaces [J]. J Aerosol Sci, 1981, 12: 275�C290. [37] MONTGOMERY T L, CORN M. Aerosol deposition in a pipe with turbulent airflow [J]. Journal of Aerosol Science, 1970, 1(3): 185�C194. [38] SEHMEL G A. Aerosol deposition from turbulent airstreams in vertical conduits [R]. Richland, Washington: Battelle Northwest Lab, BNWL-578, 1968. [39] LEE A, AHMADI G, BAYER R G, GAYNES M A. Aerosol particle deposition in an obstructed turbulent duct flow [J]. J Aerosol Sci, 1994, 25: 91�C112. [40] LIU B Y H, AGARWAL J K. Experimental observation of aerosol deposition in turbulent flow [J]. J Aerosol Sci, 1974, 5: 145�C155. [41] WELLS A C, CHAMBERLAIN A C. Transport of small particles to vertical surfaces [J]. British Journal of Applied Physics, 1967, 18: 1793�C1799. [42] FRIEDLANDER S K, JOHNSTONE H E. Deposition of suspended particles from turbulent gas streams [J]. Industrial and Engineering Chemistry, 1957, 49: 1151�C1156. [43] POSTMA A K, SCHWENDIMAN L C. Studies in micrometrics: Particle deposition in conduits as a source of error in aerosol sampling [R]. Richland, Washington: Hanford Lab, HW-65308, 1960. (Edited by YANG Hua) ���ĵ��� �����߰���ⰼ�۵�ͨ��ܵ��ڿ�����ij��������о� ժҪ�����IJ�����ֵģ���ֶζԴ����߰塢�ⰼ�۵�ͨ����ڿ�����ij������ɽ������о�������0.1~50 ��m�����Ŀ��������������RSM��DPMģ����ȷ��ģ��ͨ��ܵ��п�����ij������ԡ���⻬�ܵ���ȿ�֪�������ⰼ��ͨ��ܵ��п��������ٶ� �ؼ��ʣ���ֵģ�⣻ͨ��ܵ�������������������ٶ� Foundation item: Project(51506069) supported by the National Natural Science Foundation of China; Project(2016YFB0600605) supported by the National Key Research and Development Program of China; Projects(HUST2016YXMS286, HUST2015061) supported by the Fundamental Research Funds for the Central Universities, China Received date: 2017-08-21; Accepted date: 2018-03-26 Corresponding author: WANG Fei-fei, PhD, Lecturer; Tel: +86-13294160016; E-mail: ffwang@hust.edu.cn; ORCID: 0000-0002-6667- 912x (19)
(19) (20)
(20) (21)
(21) and the relaxation time (��+) of the particle is usually employed to evaluate the particle deposition efficiency [18]. The dimensionless deposition velocity is as Eq. (24). The relaxation time (��+) of the particle is a function of the particle diameter (dp) Eq. (25).
 (24)
(24) (25)against ��+ for the particle deposition in the smooth duct. For comparison, the experimental results, the empirical formula fitting curve, and the numerical results from other researchers [16, 19, 25] are also presented. Because of the random motion of the particles in the duct, the particle deposition efficiency (i.e., the relationships between and ��+) from various work cannot always match one curve. However, it is obvious that in the duct presents a clear S-shape trend with the increase of ��+. In the whole range of the dimensionless relaxation time, falls into three typical regimes, i.e., the turbulent- diffusion regime, the eddy diffusion-impaction regime, and the inertia-moderated regime. In the turbulent-diffusion regime, decreases with the increase of ��+ or the increase of the particle diameter because the particles are so small and both Brownian force and turbulent diffusion are important for their movements. In the eddy diffusion-impaction regime,increases by about several orders of magnitude with the increment of ��+. The particle movement is mainly affected by turbulent diffusion, inertia-impaction and shear- included lifted force. In the inertia-moderated regime, decreases slightly with ��+ due to the larger inertia of the coarser particles. The results show the predicted particle deposition by using the present models in this study is basically consistent with the previous data. The comparison in Figures 2 and 3 shows that the models and methods presented in this paper can accurately predict the particle motion and the flow characteristics in the smooth ventilation duct. Therefore, the same models are appropriate to predict the particle deposition in the ventilation ducts with convex and concave wall cavities respectively.
 in horizontal (a) and vertical (b) smooth ductsand its enhancement ratio
  in the ventilation ducts with and without wall cavities verse ��+. The enhancement ratio is the increasing rate with respect to that in the smooth duct. Figure 4(a) shows the particle deposition is significantly enhanced as a whole with the help of the convex or concave wall cavity when compared with the results from the smooth duct. The particle deposition in the duct with the convex wall cavity appears to be higher by about one order of magnitude than that with the concave wall cavity for ��+<20. For ��+>100, the particle deposition is almost the same. This figure also shows that exhibits a weakened S-shape trend with the increase of ��+ and the growth of slows down in the eddy diffusion-impaction and inertia-moderated regimes.
 (26)
(26)


 increases greatly for ducts with wall cavities when compared with that in the smooth duct. Specially, for ��+<1 in turbulent- and eddy-diffusion regions, increases by about 2�C4 orders of magnitude with the peak values being 7770 and 1320 times in both ducts with convex and concave cavities respectively. For ��+>1 in inertia-moderate region, does not increase too much since the particle movement is mainly controlled by gravity and inertia.increases more quickly and is higher in the duct with the convex wall cavity.of small particle increases more rapidly while the deposition velocity of larger particle does not increase too much. Therefore, addition of wall cavities may strengthen particle deposition while the duct with convex wall cavity may be much better for deposition for smaller particles.
 GHEIN C,ALLARD F. Effect of ventilation strategies on particle decay rates indoors: An experimental and modelling study [J]. Atmospheric Environment, 2005, 39: 4885�C4892.
 RE A, OESTERL B, FONTAINE J R. The influence of an anisotropic Lagrangian dispersion model on the prediction of micro- and nano-particle deposition in wall-bounded turbulent flows [J]. Journal of Aerosol Science, 2010, 41(8): 729�C744.
 ���ԥʱ�䣨��+���������������������������ߣ��������������ڦ�+<1��������ɢ��������ɢ��ײ����������ǿ2~4�����������ڦ�+��0.3 (dp=2 ��m)ʱ�ﵽ���ֵ�������߰���ⰼ���ֱܷ�ʹ���������������ǿ7770��1320�����ڦ�+>1�Ĺ�����������������˶���Ҫ�ܹ����������������ϻ���������ԣ����������ⰼ�ۿ���ǿ��������ij������Ҷ�С�������������ø���������ˣ���Ϊ����PM2.5 (dpm<2.5 ��m)�ṩ��һ�ֺõ�ѡ���⣬������ⰼ�ۣ������߰��ͨ��ܵ������������������Ӹ��ӣ��������ߵ��Ķ��ܣ������ڿ������������������Ȼ����������ѹ����ʧ�������ⰼ�۵�ͨ��ܵ���Ȼ��Խϵͣ���Ч�ʸ��ߡ�
Abstract: A numerical study is carried out on particle deposition in ducts with either convex or concave wall cavity. Results show that, if compared with smooth duct, particle deposition velocitiesincrease greatly in ducts with wall cavities. More specifically, for ��+<1, increase by about 2�C4 orders of magnitude in the cases with the convex and concave wall cavities; for ��+>1, grows relatively slower. Enhancement of particle deposition with wall cavities is caused by the following mechanisms, i.e., interception by the wall cavities, expanded deposition area, and the enhanced flow turbulence. In general, addition of wall cavities is contributive for particle deposition, so it provides an efficient approach to remove particles, especially with small size, e.g., PM2.5. Moreover, the convex wall cavity leads to a larger increment of than the concave wall cavity. However, taking pressure loss into account, thoughis relatively lower, duct with the concave wall cavity is more efficient than that with the convex wall cavity.
